| Param | Original file | Final file |
|---|---|---|
| Filename | modeM0/AS1A05_198T01_9000002578_17431cztM0_level2.evt | modeM0/AS1A05_198T01_9000002578_17431cztM0_level2_quad_clean.evt |
| Size (bytes) | 622,918,080 | 107,755,200 |
| Size | 594.1 MB | 102.8 MB |
| Events in quadrant A | 5,955,989 | 653,206 |
| Events in quadrant B | 4,322,227 | 710,468 |
| Events in quadrant C | 3,812,715 | 684,523 |
| Events in quadrant D | 4,247,263 | 674,325 |
| Mode M9 | |||
|---|---|---|---|
| Quadrant | BADHDUFLAG | Total packets | Discarded packets |
| A | 0 | 10 | 0 |
| B | 0 | 10 | 0 |
| C | 0 | 10 | 0 |
| D | 0 | 10 | 0 |
| Mode M0 | |||
|---|---|---|---|
| Quadrant | BADHDUFLAG | Total packets | Discarded packets |
| A | 0 | 22770 | 2 |
| B | 0 | 17963 | 2 |
| C | 0 | 16194 | 2 |
| D | 0 | 17975 | 2 |
| Mode SS | |||
|---|---|---|---|
| Quadrant | BADHDUFLAG | Total packets | Discarded packets |
| A | 0 | 160 | 0 |
| B | 0 | 160 | 0 |
| C | 0 | 160 | 0 |
| D | 0 | 160 | 0 |
| Quadrant | Total seconds | Saturated seconds | Saturation percentage |
|---|---|---|---|
| A | 7770 | 851 | 10.952381% |
| B | 7770 | 192 | 2.471042% |
| C | 7770 | 111 | 1.428571% |
| D | 7770 | 144 | 1.853282% |
Noise dominated data is calculated using 1-second bins in cleaned event files. If a bin has >2000 counts, and if more than 50% of those come from <1% of pixels, then it is considered to be noise-dominated and hence unusable.
| Quadrant | # 1 sec bins | Bins with >0 counts | Bins with >2000 counts | High rate bins dominated by noise | Noise dominated (total time) | Noise dominated (detector-on time) | Marked lightcurve |
|---|---|---|---|---|---|---|---|
| A | 8730 | 7772 | 713 | 713 | 8.17% | 9.17% | 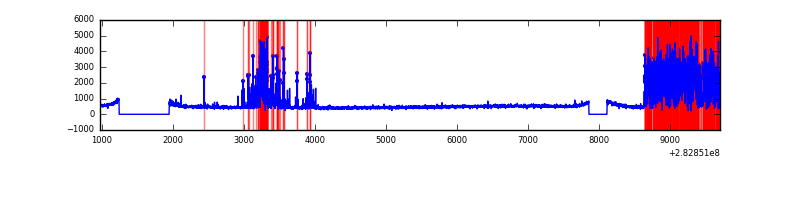 |
| B | 8730 | 7772 | 41 | 41 | 0.47% | 0.53% | 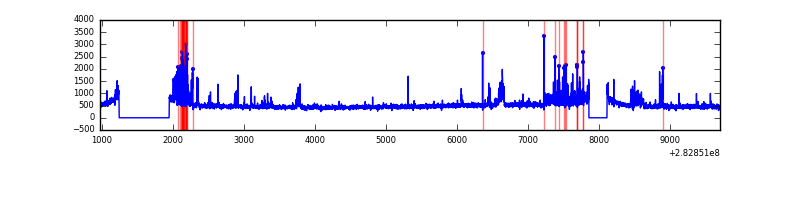 |
| C | 8730 | 7772 | 2 | 2 | 0.02% | 0.03% | 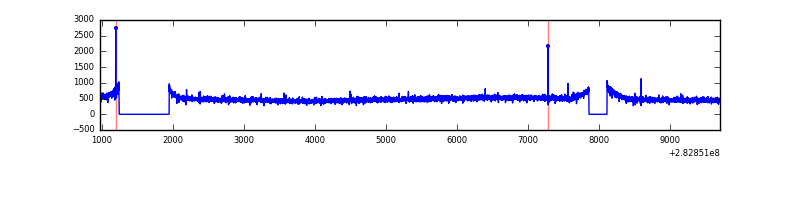 |
| D | 8730 | 7772 | 92 | 92 | 1.05% | 1.18% | 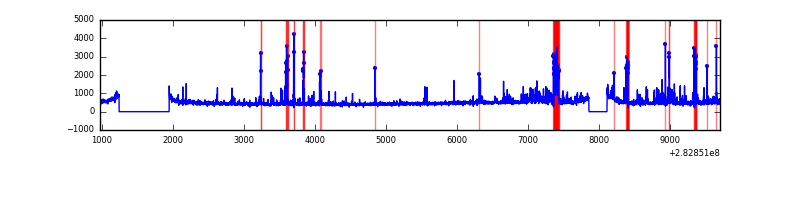 |
Top three noisy pixels from each quadrant. If the there are fewer than three noisy pixels in the level2.evt file, extra rows are filled as -1
| Pixel properties | Quadrant properties | ||||||
|---|---|---|---|---|---|---|---|
| Quadrant | DetID | PixID | Counts | Sigma | Mean | Median | Sigma |
| A | 10 | 253 | 2409137 | 12899.25 | 913 | 893 | 186.7 |
| A | 14 | 237 | 9282 | 44.93 | 913 | 893 | 186.7 |
| A | 6 | 16 | 9115 | 44.04 | 913 | 893 | 186.7 |
| B | 15 | 35 | 239491 | 1286.88 | 951 | 927 | 185.4 |
| B | 7 | 220 | 168451 | 903.67 | 951 | 927 | 185.4 |
| B | 3 | 209 | 62965 | 334.65 | 951 | 927 | 185.4 |
| C | 14 | 238 | 137500 | 642.08 | 902 | 906 | 212.7 |
| C | 5 | 218 | 113750 | 530.44 | 902 | 906 | 212.7 |
| C | 3 | 233 | 27717 | 126.03 | 902 | 906 | 212.7 |
| D | 1 | 52 | 182250 | 810.09 | 916 | 888 | 223.9 |
| D | 13 | 232 | 172191 | 765.16 | 916 | 888 | 223.9 |
| D | 13 | 189 | 151454 | 672.53 | 916 | 888 | 223.9 |
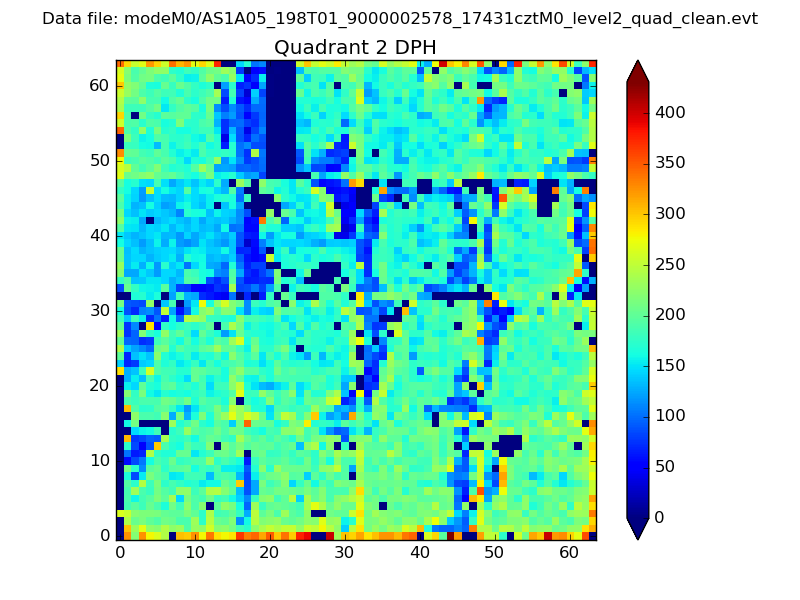
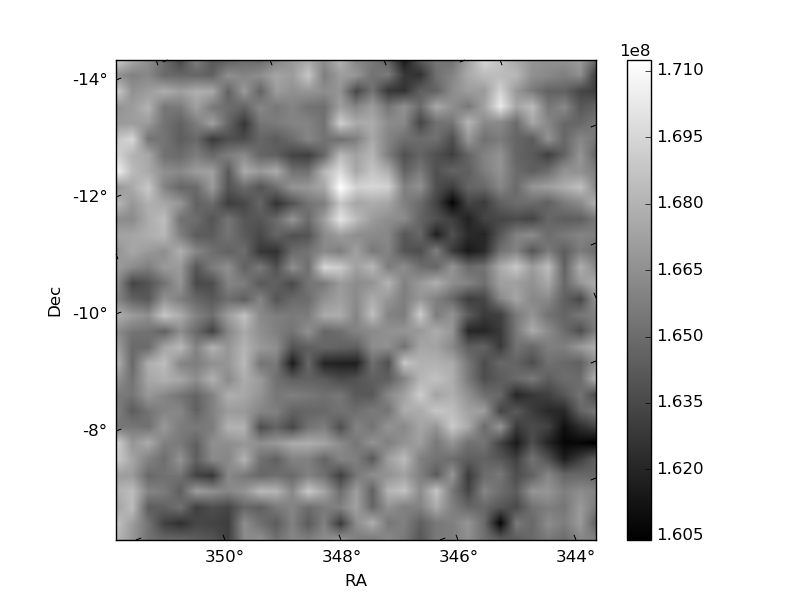
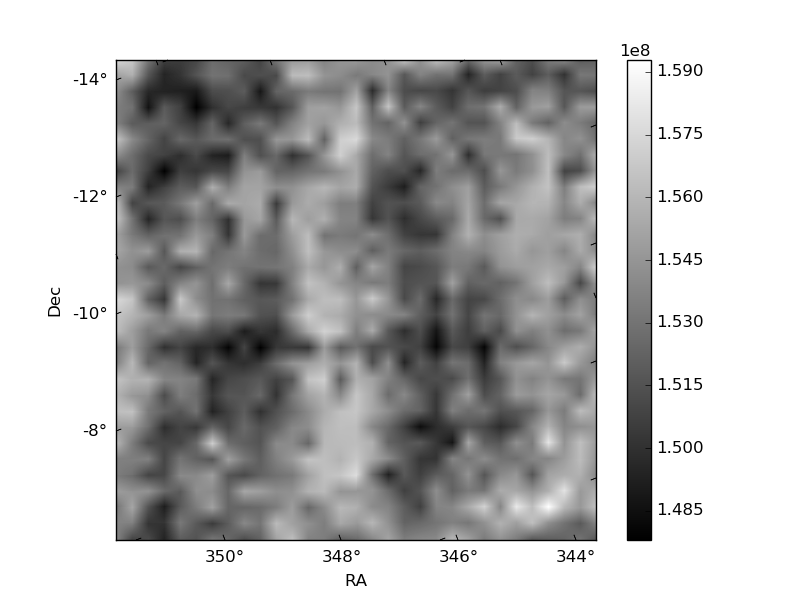
Histogram calculated using DETX and DETY for each event in the final _common_clean file
| Quadrant A | 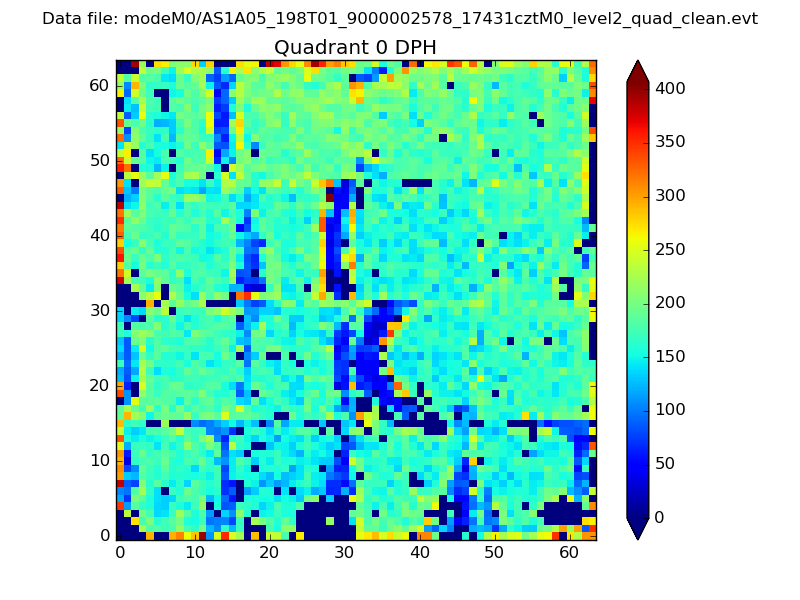 |
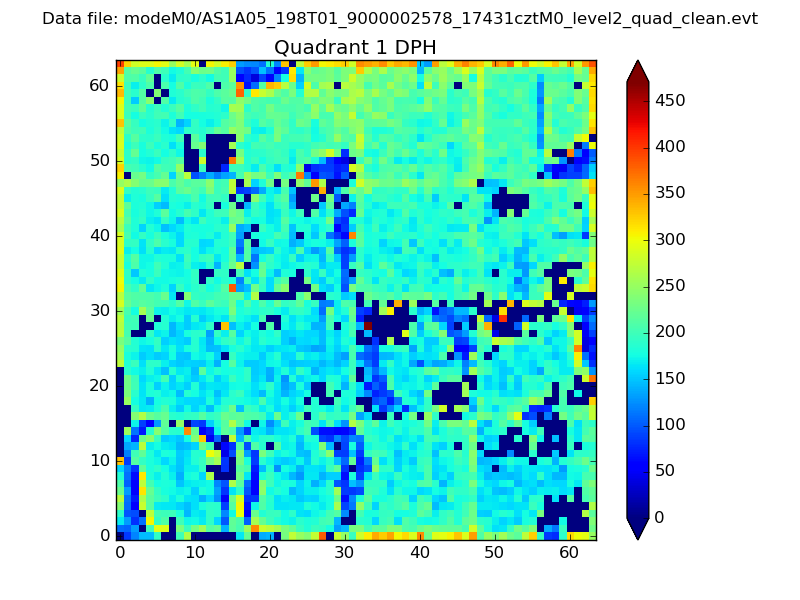 |
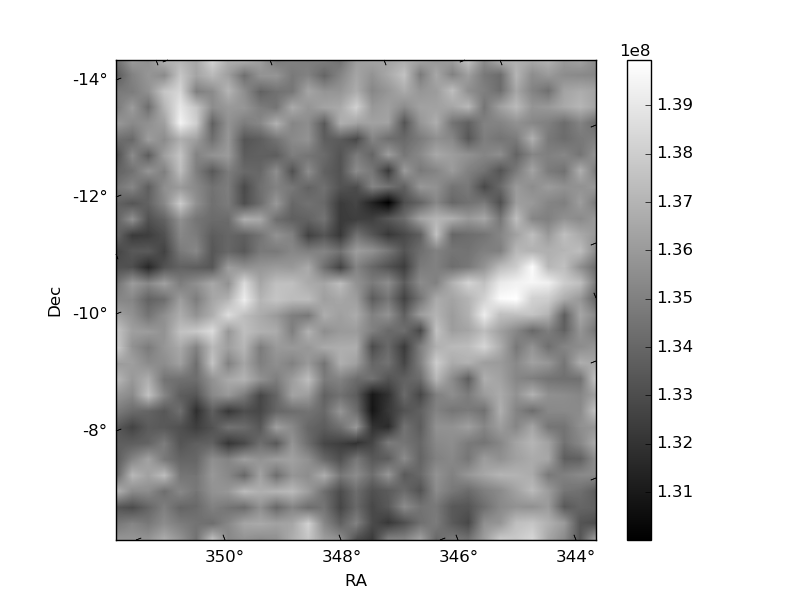
Quadrant B |
|---|---|---|---|
| Quadrant D | 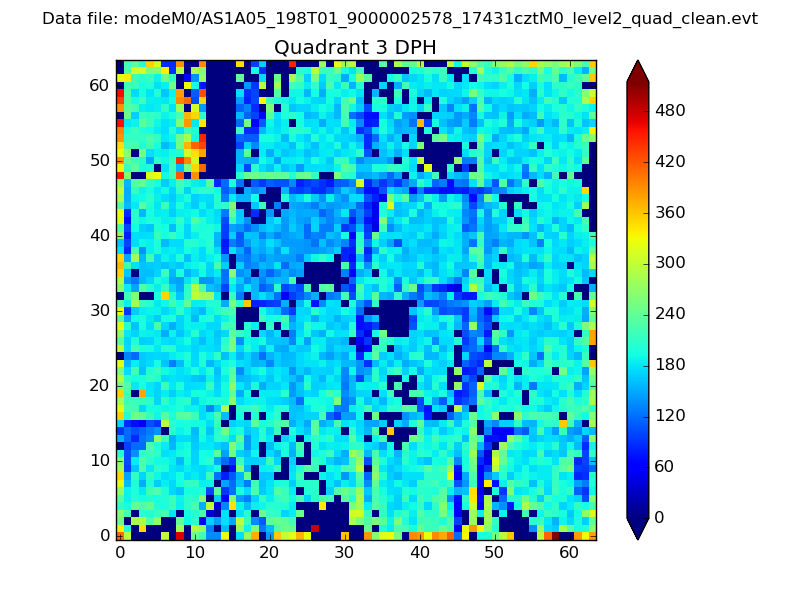 |
 |
Quadrant C |
| Plot type | Count rate plots | Images |
|---|---|---|
| Comparison with Poisson distribution Blue bars denote a histogram of data divided into 1 sec bins. Red curve is a Poisson curve with rate = median count rate of data. |
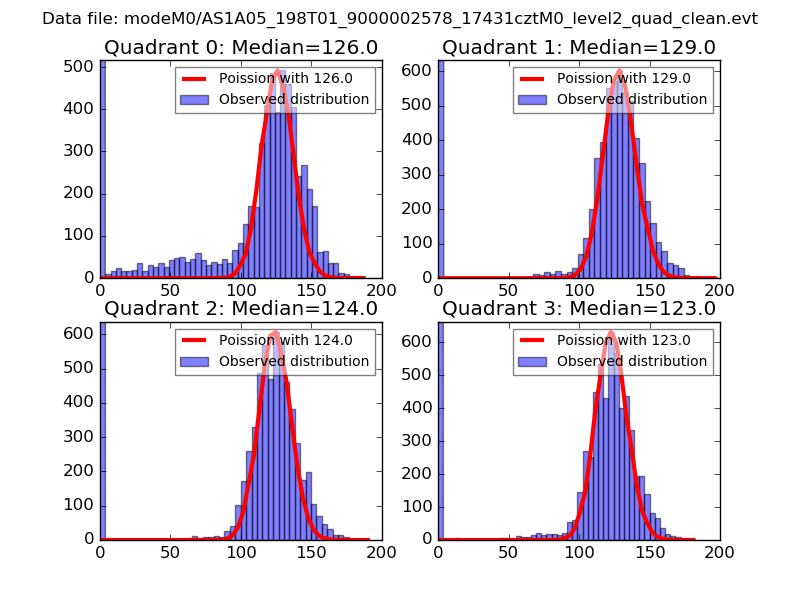 |
 |
| Quadrant-wise count rates Data is divided into 100 sec bins |
 |
|
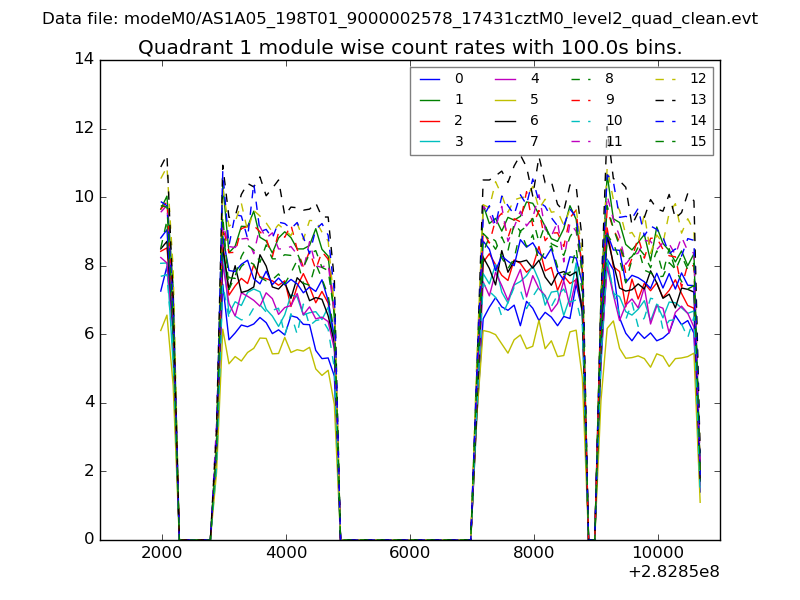
| Module-wise count rates for Quadrant A Data is divided into 100 sec bins |
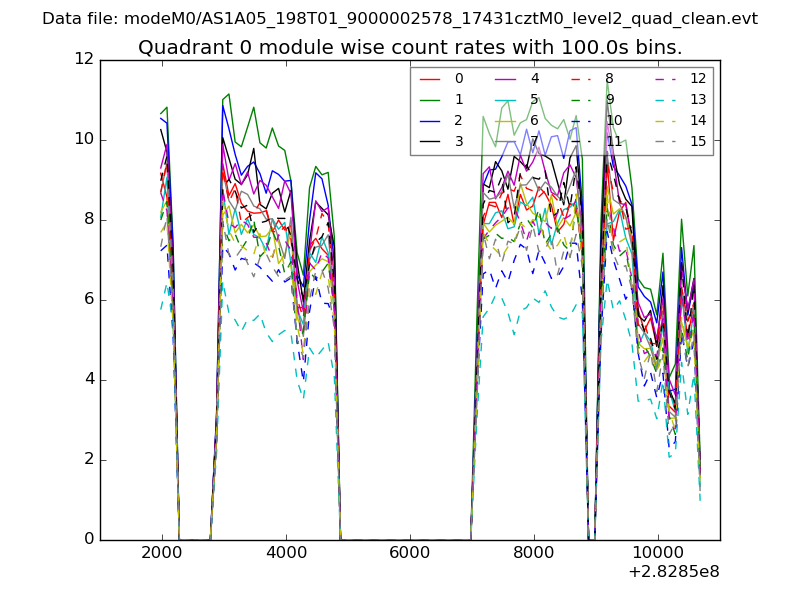 |
 |
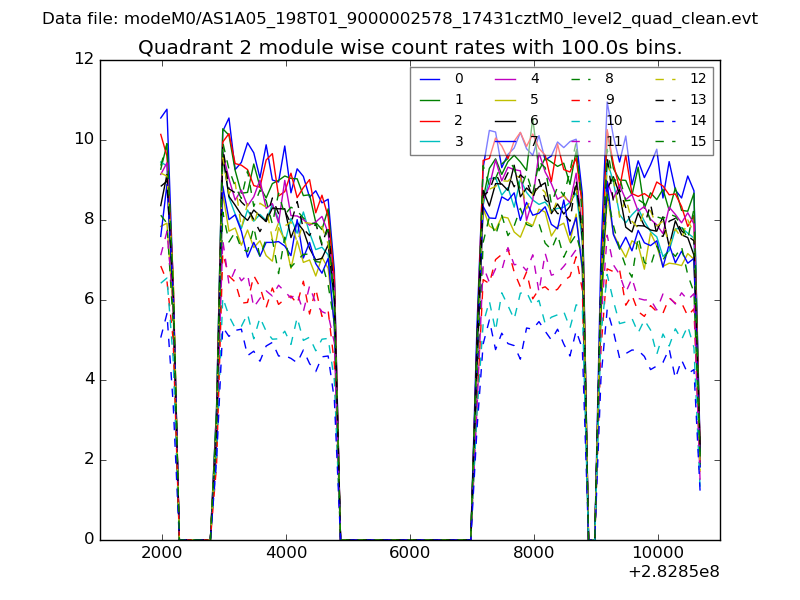
| Module-wise count rates for Quadrant B Data is divided into 100 sec bins |
 |
 |
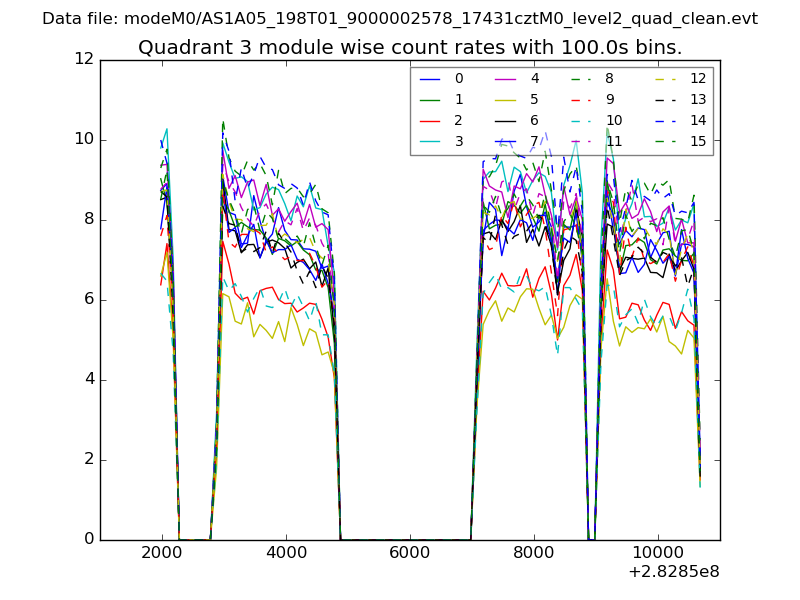
| Module-wise count rates for Quadrant C Data is divided into 100 sec bins |
 |
 |
| Module-wise count rates for Quadrant D Data is divided into 100 sec bins |
 |
 |
| Parameter | Plot |
|---|---|
| CZT HV Monitor | 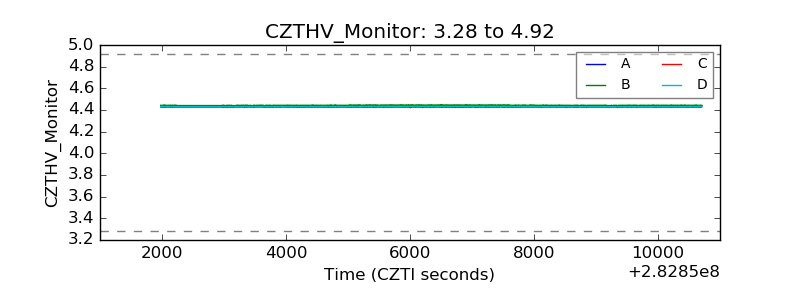 |
| D_VDD | 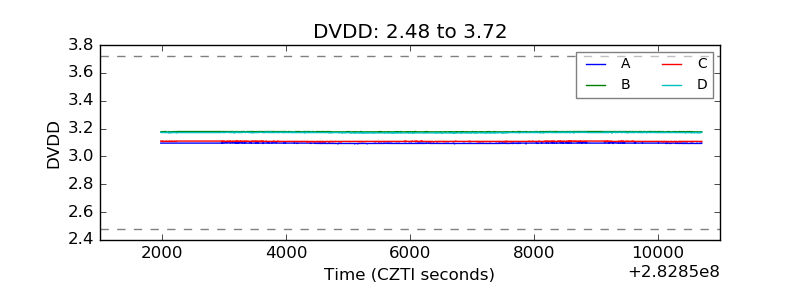 |
| Temperature 1 | 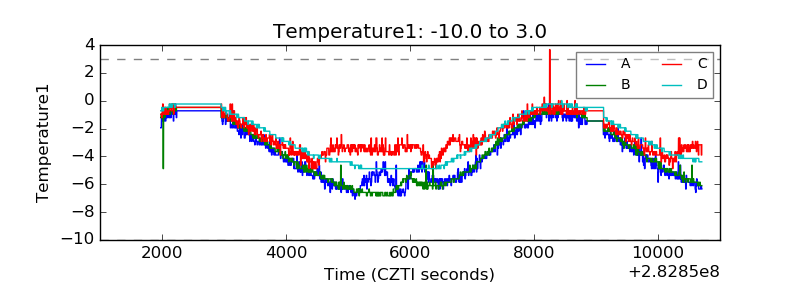 |
| Veto HV Monitor | 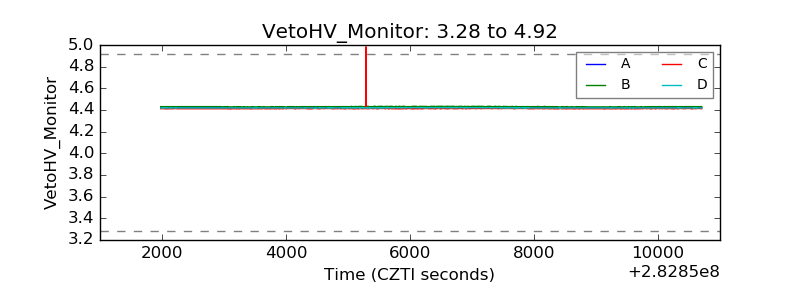 |
| Veto LLD | 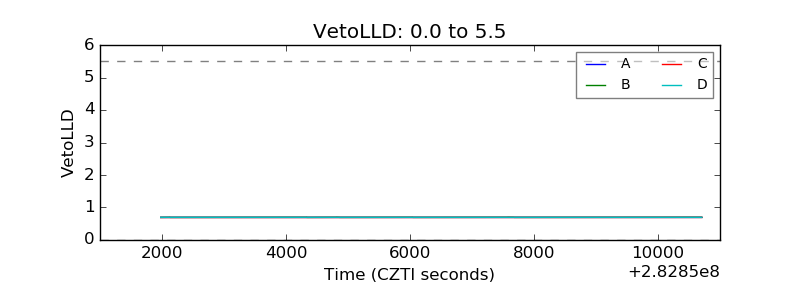 |
| Alpha Counter |  |
| _CPM_Rate |  |
| CZT Counter | 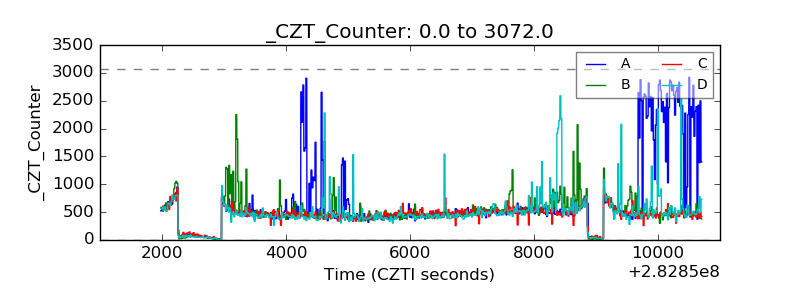 |
| +2.5 Volts monitor |  |
| +5 Volts monitor |  |
| _ROLL_ROT | 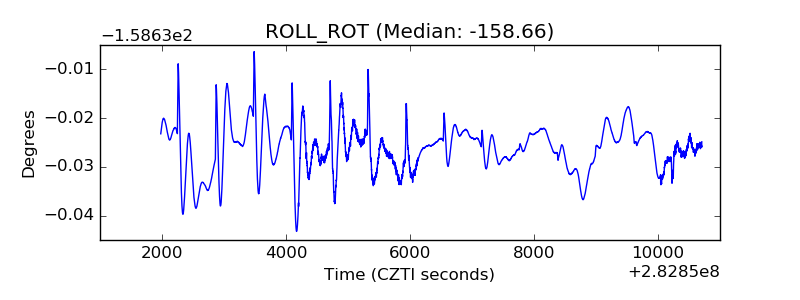 |
| _Roll_DEC | 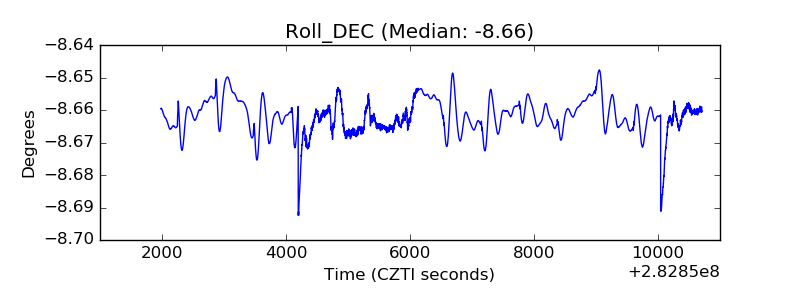 |
| _Roll_RA |  |
| Veto Counter | 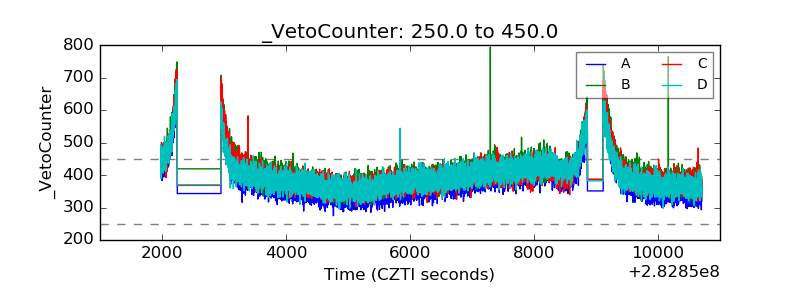 |