| Param | Original file | Final file |
|---|---|---|
| Filename | modeM0/AS1A05_198T01_9000002578_17432cztM0_level2.evt | modeM0/AS1A05_198T01_9000002578_17432cztM0_level2_quad_clean.evt |
| Size (bytes) | 634,011,840 | 100,886,400 |
| Size | 604.6 MB | 96.2 MB |
| Events in quadrant A | 6,011,571 | 606,708 |
| Events in quadrant B | 3,992,785 | 658,938 |
| Events in quadrant C | 3,829,782 | 629,409 |
| Events in quadrant D | 4,837,030 | 616,015 |
| Mode M9 | |||
|---|---|---|---|
| Quadrant | BADHDUFLAG | Total packets | Discarded packets |
| A | 0 | 5 | 0 |
| B | 0 | 5 | 0 |
| C | 0 | 5 | 0 |
| D | 0 | 5 | 0 |
| Mode M0 | |||
|---|---|---|---|
| Quadrant | BADHDUFLAG | Total packets | Discarded packets |
| A | 0 | 23003 | 2 |
| B | 0 | 16940 | 2 |
| C | 0 | 16290 | 2 |
| D | 0 | 19667 | 2 |
| Mode SS | |||
|---|---|---|---|
| Quadrant | BADHDUFLAG | Total packets | Discarded packets |
| A | 0 | 162 | 0 |
| B | 0 | 162 | 0 |
| C | 0 | 162 | 0 |
| D | 0 | 162 | 0 |
| Quadrant | Total seconds | Saturated seconds | Saturation percentage |
|---|---|---|---|
| A | 7820 | 872 | 11.150895% |
| B | 7820 | 165 | 2.109974% |
| C | 7821 | 151 | 1.930699% |
| D | 7821 | 207 | 2.646720% |
Noise dominated data is calculated using 1-second bins in cleaned event files. If a bin has >2000 counts, and if more than 50% of those come from <1% of pixels, then it is considered to be noise-dominated and hence unusable.
| Quadrant | # 1 sec bins | Bins with >0 counts | Bins with >2000 counts | High rate bins dominated by noise | Noise dominated (total time) | Noise dominated (detector-on time) | Marked lightcurve |
|---|---|---|---|---|---|---|---|
| A | 8240 | 7823 | 707 | 707 | 8.58% | 9.04% | 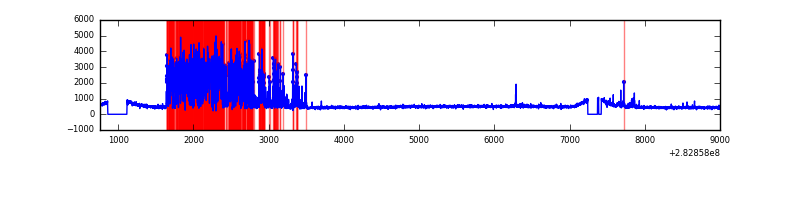 |
| B | 8240 | 7823 | 9 | 9 | 0.11% | 0.12% | 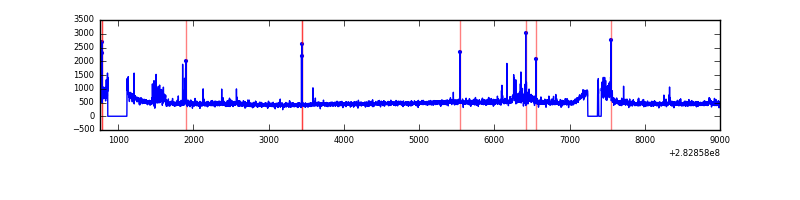 |
| C | 8241 | 7824 | 0 | 0 | 0.00% | 0.00% | 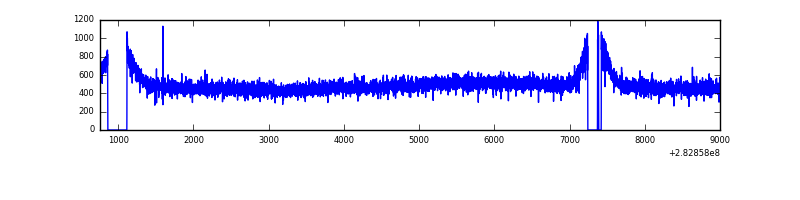 |
| D | 8241 | 7824 | 119 | 119 | 1.44% | 1.52% | 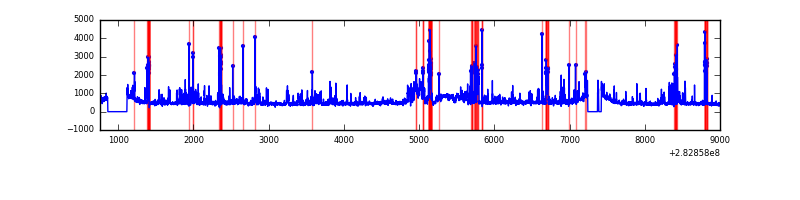 |
Top three noisy pixels from each quadrant. If the there are fewer than three noisy pixels in the level2.evt file, extra rows are filled as -1
| Pixel properties | Quadrant properties | ||||||
|---|---|---|---|---|---|---|---|
| Quadrant | DetID | PixID | Counts | Sigma | Mean | Median | Sigma |
| A | 10 | 253 | 2419222 | 12935.66 | 914 | 895 | 187.0 |
| A | 14 | 238 | 28419 | 147.23 | 914 | 895 | 187.0 |
| A | 14 | 237 | 25439 | 131.29 | 914 | 895 | 187.0 |
| B | 7 | 220 | 64125 | 345.01 | 956 | 932 | 183.2 |
| B | 15 | 35 | 52390 | 280.94 | 956 | 932 | 183.2 |
| B | 0 | 219 | 50791 | 272.21 | 956 | 932 | 183.2 |
| C | 14 | 238 | 138075 | 642.49 | 907 | 913 | 213.5 |
| C | 5 | 218 | 121741 | 565.98 | 907 | 913 | 213.5 |
| C | 3 | 233 | 23068 | 103.78 | 907 | 913 | 213.5 |
| D | 12 | 110 | 527162 | 2328.09 | 919 | 889 | 226.1 |
| D | 13 | 232 | 395028 | 1743.57 | 919 | 889 | 226.1 |
| D | 7 | 238 | 147861 | 650.16 | 919 | 889 | 226.1 |
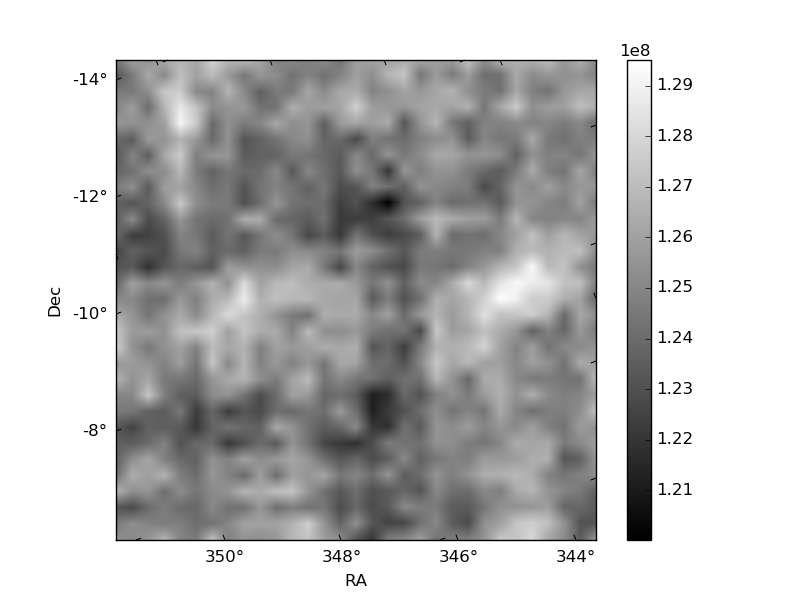
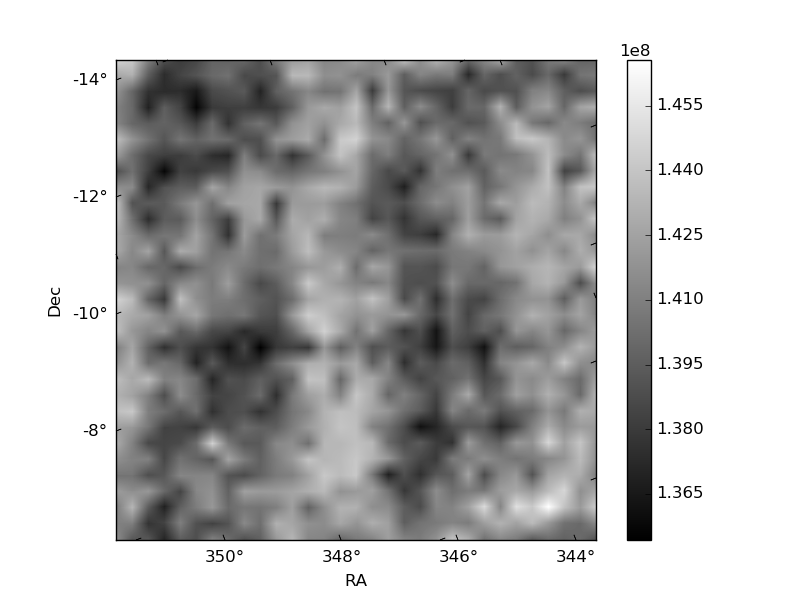
Histogram calculated using DETX and DETY for each event in the final _common_clean file
| Quadrant A |  |
 |
Quadrant B |
|---|---|---|---|
| Quadrant D |  |
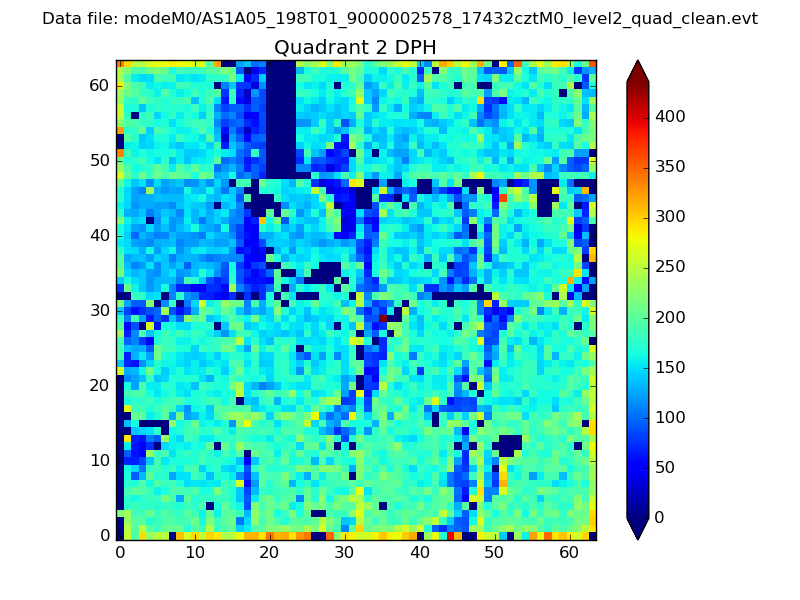 |
Quadrant C |
| Plot type | Count rate plots | Images |
|---|---|---|
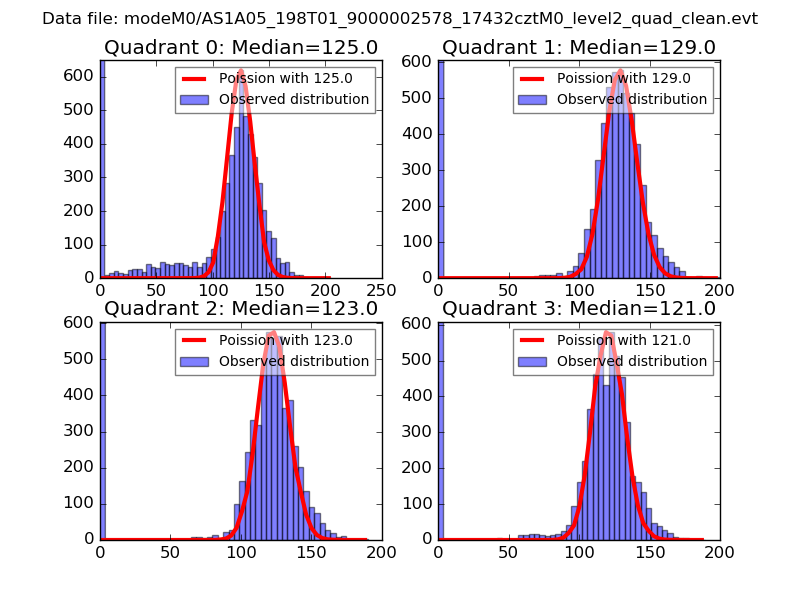
| Comparison with Poisson distribution Blue bars denote a histogram of data divided into 1 sec bins. Red curve is a Poisson curve with rate = median count rate of data. |
 |
 |
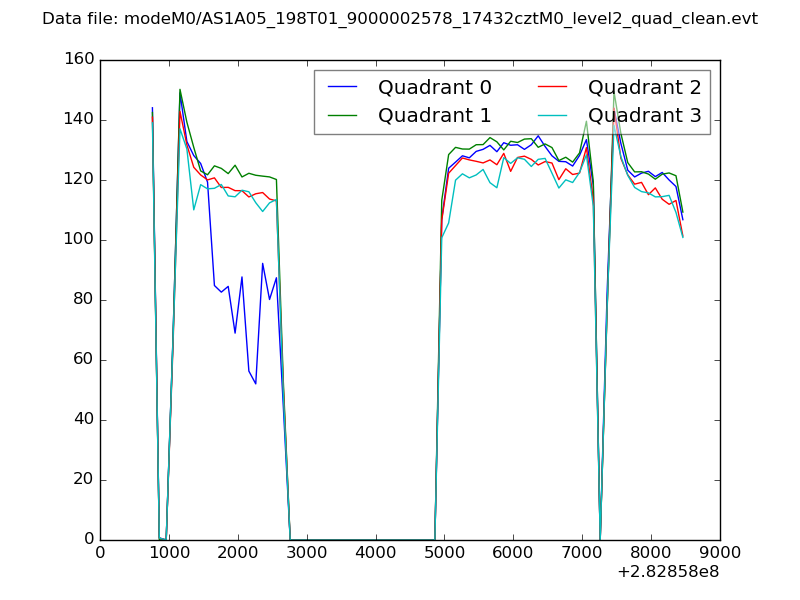
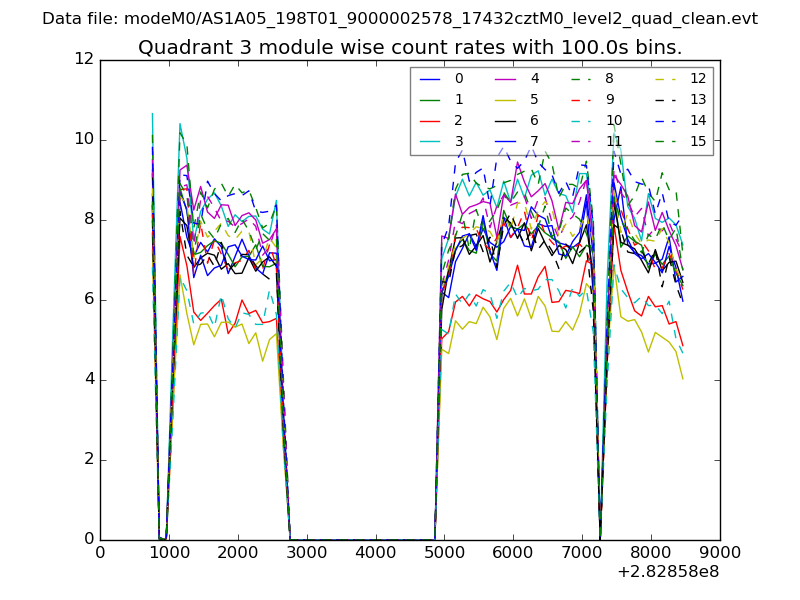
| Quadrant-wise count rates Data is divided into 100 sec bins |
 |
|
| Module-wise count rates for Quadrant A Data is divided into 100 sec bins |
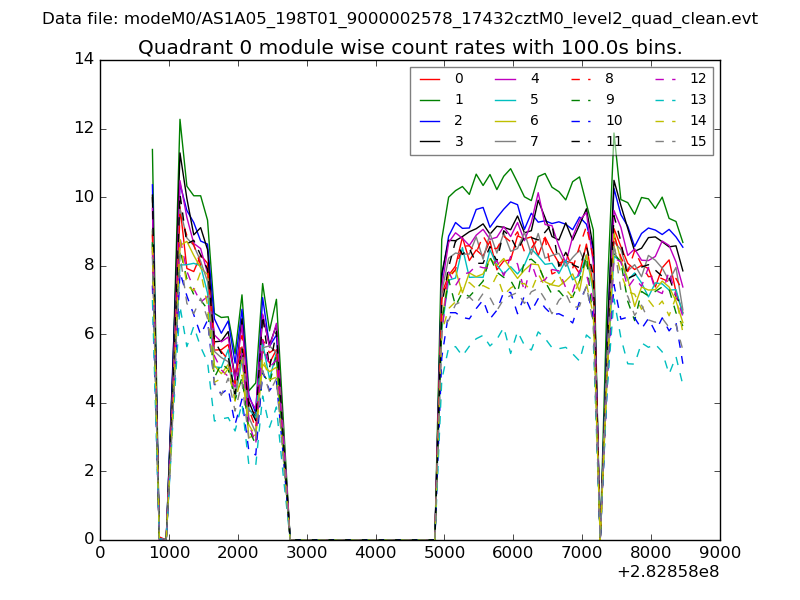 |
 |
| Module-wise count rates for Quadrant B Data is divided into 100 sec bins |
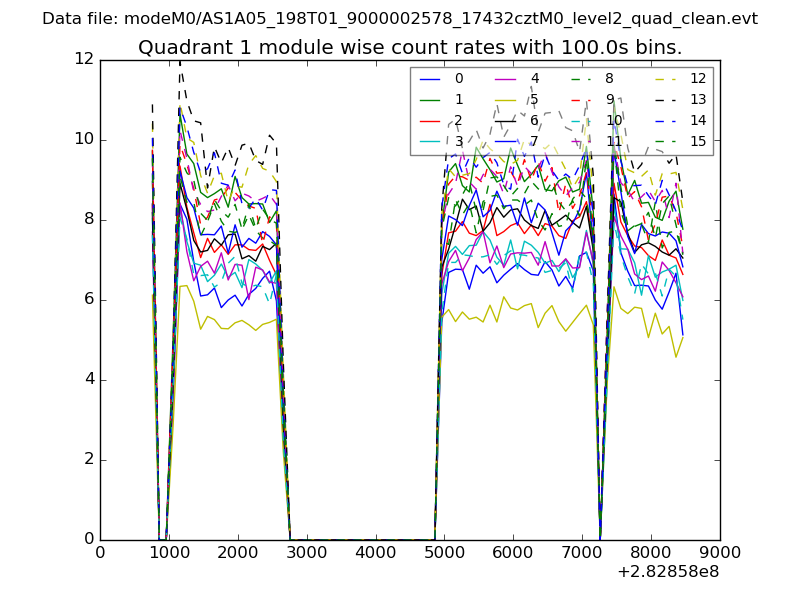 |
 |
| Module-wise count rates for Quadrant C Data is divided into 100 sec bins |
 |
 |
| Module-wise count rates for Quadrant D Data is divided into 100 sec bins |
 |
 |
| Parameter | Plot |
|---|---|
| CZT HV Monitor |  |
| D_VDD | 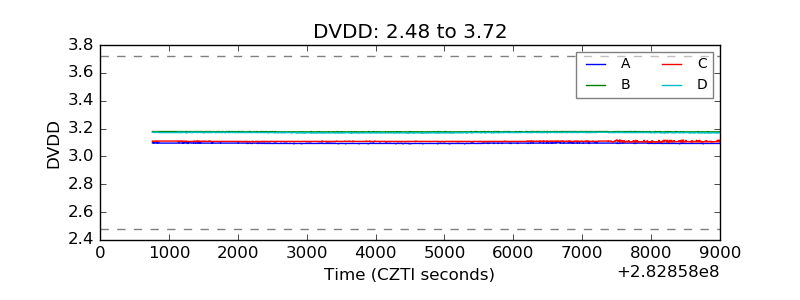 |
| Temperature 1 | 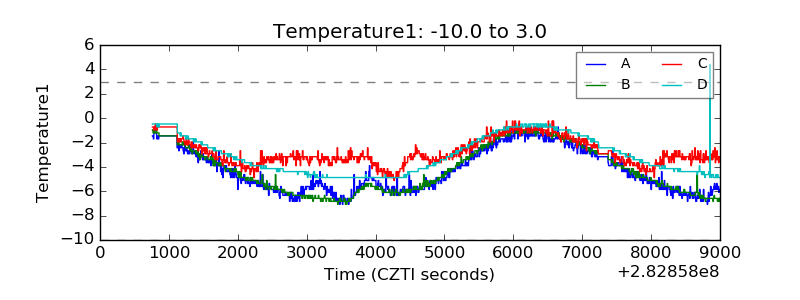 |
| Veto HV Monitor | 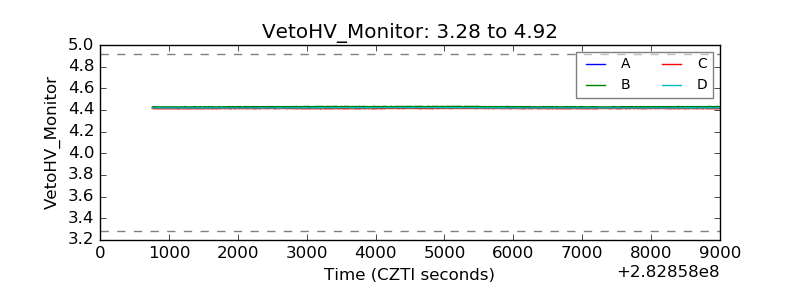 |
| Veto LLD | 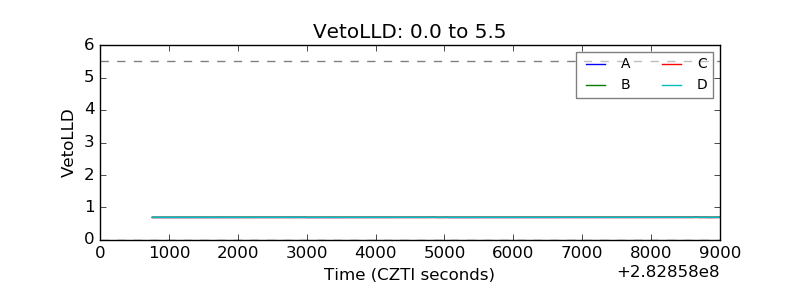 |
| Alpha Counter | 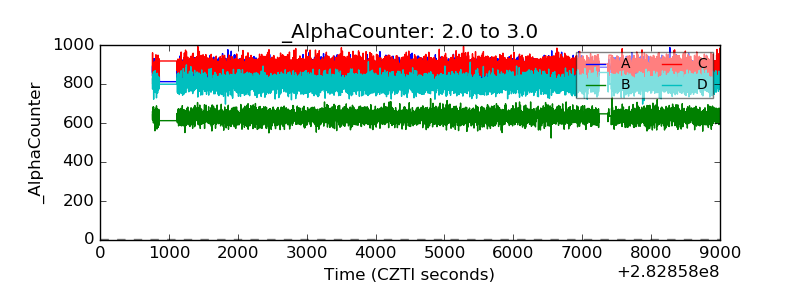 |
| _CPM_Rate | 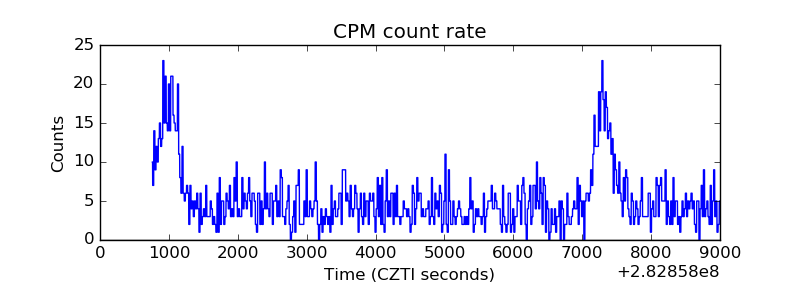 |
| CZT Counter | 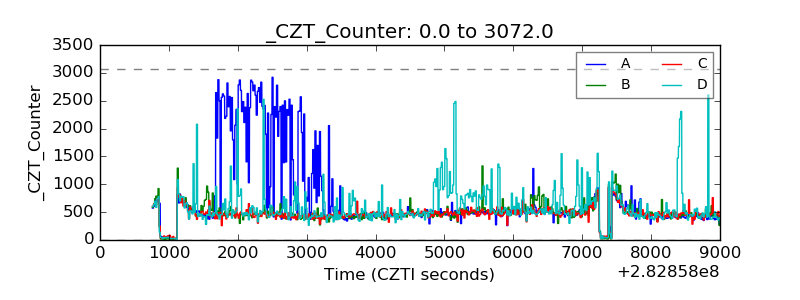 |
| +2.5 Volts monitor |  |
| +5 Volts monitor |  |
| _ROLL_ROT | 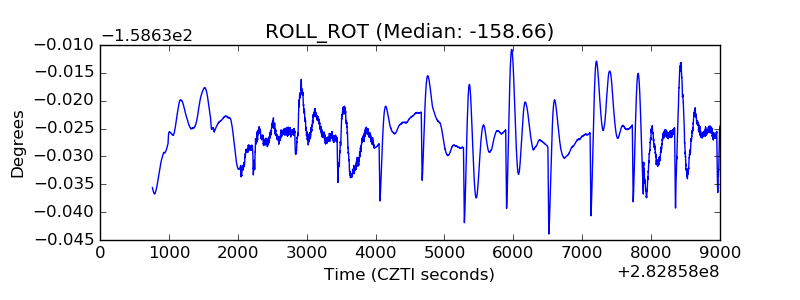 |
| _Roll_DEC | 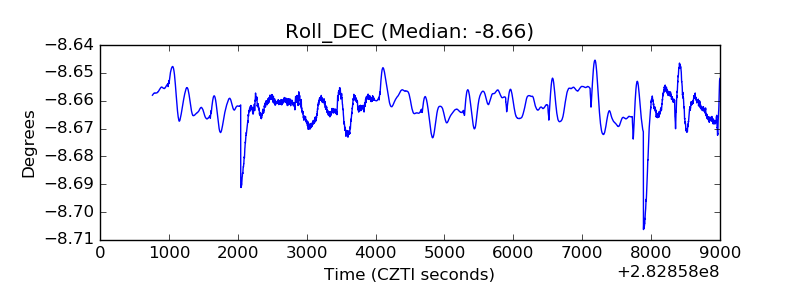 |
| _Roll_RA | 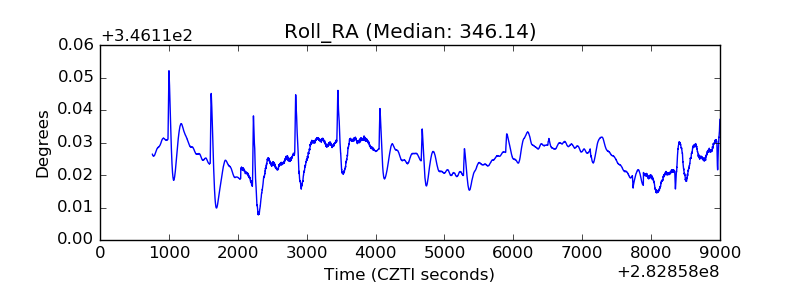 |
| Veto Counter | 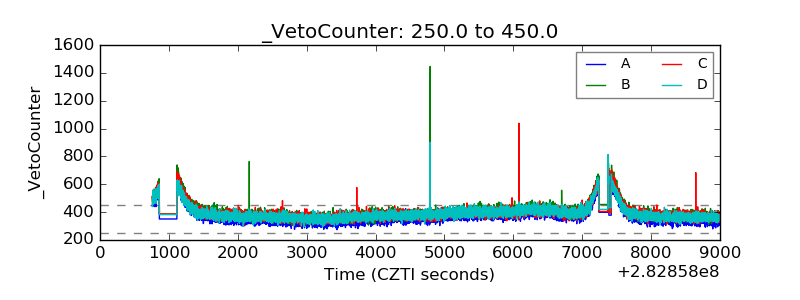 |