| Param | Original file | Final file |
|---|---|---|
| Filename | modeM0/AS1A05_198T01_9000002578_17433cztM0_level2.evt | modeM0/AS1A05_198T01_9000002578_17433cztM0_level2_quad_clean.evt |
| Size (bytes) | 700,977,600 | 103,377,600 |
| Size | 668.5 MB | 98.6 MB |
| Events in quadrant A | 7,547,853 | 592,858 |
| Events in quadrant B | 4,287,460 | 671,467 |
| Events in quadrant C | 4,189,017 | 641,546 |
| Events in quadrant D | 4,627,097 | 631,926 |
| Mode M9 | |||
|---|---|---|---|
| Quadrant | BADHDUFLAG | Total packets | Discarded packets |
| A | 0 | 6 | 0 |
| B | 0 | 6 | 0 |
| C | 0 | 6 | 0 |
| D | 0 | 6 | 0 |
| Mode M0 | |||
|---|---|---|---|
| Quadrant | BADHDUFLAG | Total packets | Discarded packets |
| A | 0 | 28251 | 2 |
| B | 0 | 18192 | 2 |
| C | 0 | 17648 | 2 |
| D | 0 | 19610 | 3 |
| Mode SS | |||
|---|---|---|---|
| Quadrant | BADHDUFLAG | Total packets | Discarded packets |
| A | 0 | 176 | 0 |
| B | 0 | 176 | 0 |
| C | 0 | 176 | 0 |
| D | 0 | 176 | 0 |
| Quadrant | Total seconds | Saturated seconds | Saturation percentage |
|---|---|---|---|
| A | 8529 | 1356 | 15.898699% |
| B | 8530 | 152 | 1.781946% |
| C | 8530 | 146 | 1.711606% |
| D | 8529 | 140 | 1.641459% |
Noise dominated data is calculated using 1-second bins in cleaned event files. If a bin has >2000 counts, and if more than 50% of those come from <1% of pixels, then it is considered to be noise-dominated and hence unusable.
| Quadrant | # 1 sec bins | Bins with >0 counts | Bins with >2000 counts | High rate bins dominated by noise | Noise dominated (total time) | Noise dominated (detector-on time) | Marked lightcurve |
|---|---|---|---|---|---|---|---|
| A | 9094 | 8531 | 1046 | 1046 | 11.50% | 12.26% | 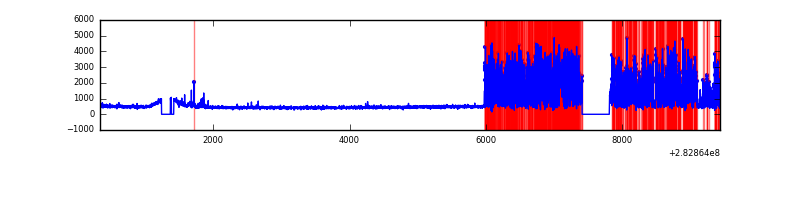 |
| B | 9095 | 8533 | 4 | 4 | 0.04% | 0.05% | 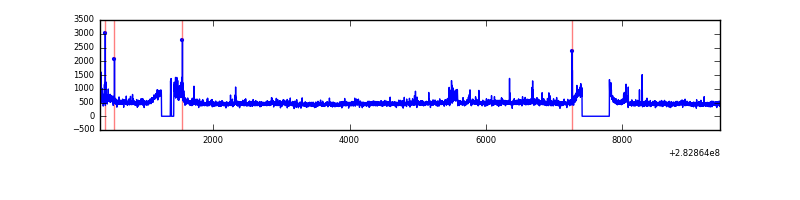 |
| C | 9095 | 8533 | 0 | 0 | 0.00% | 0.00% | 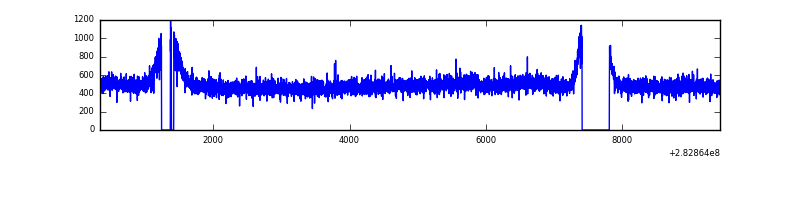 |
| D | 9094 | 8532 | 53 | 53 | 0.58% | 0.62% | 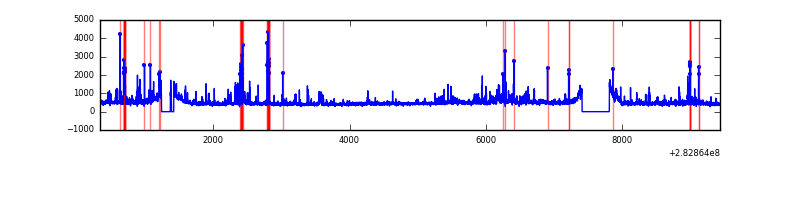 |
Top three noisy pixels from each quadrant. If the there are fewer than three noisy pixels in the level2.evt file, extra rows are filled as -1
| Pixel properties | Quadrant properties | ||||||
|---|---|---|---|---|---|---|---|
| Quadrant | DetID | PixID | Counts | Sigma | Mean | Median | Sigma |
| A | 10 | 253 | 3786961 | 19146.92 | 968 | 947 | 197.7 |
| A | 14 | 238 | 25673 | 125.05 | 968 | 947 | 197.7 |
| A | 14 | 237 | 14698 | 69.54 | 968 | 947 | 197.7 |
| B | 0 | 219 | 62331 | 304.27 | 1039 | 1014 | 201.5 |
| B | 0 | 230 | 45083 | 218.68 | 1039 | 1014 | 201.5 |
| B | 15 | 19 | 37659 | 181.84 | 1039 | 1014 | 201.5 |
| C | 14 | 238 | 149321 | 634.59 | 989 | 993 | 233.7 |
| C | 5 | 218 | 137615 | 584.51 | 989 | 993 | 233.7 |
| C | 3 | 233 | 21983 | 89.8 | 989 | 993 | 233.7 |
| D | 13 | 232 | 284395 | 1147.19 | 1003 | 970 | 247.1 |
| D | 13 | 189 | 113857 | 456.92 | 1003 | 970 | 247.1 |
| D | 7 | 238 | 95736 | 383.57 | 1003 | 970 | 247.1 |
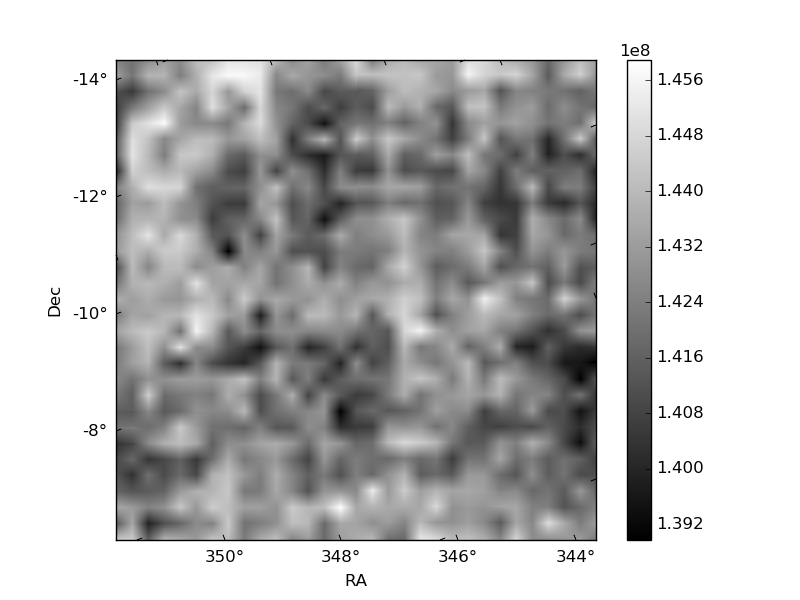
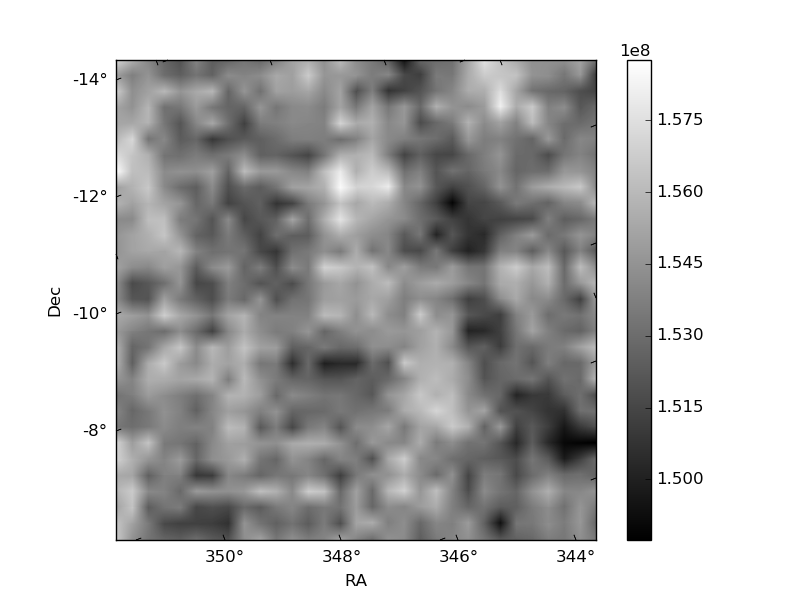
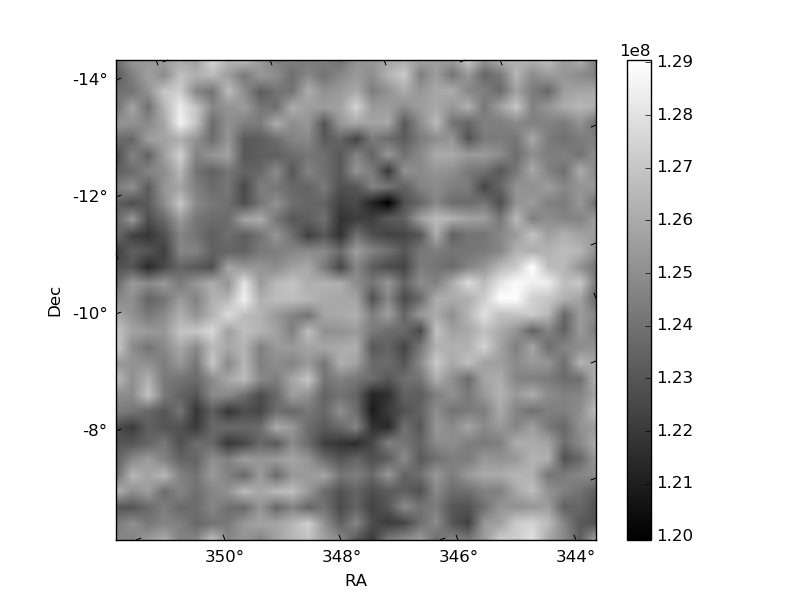
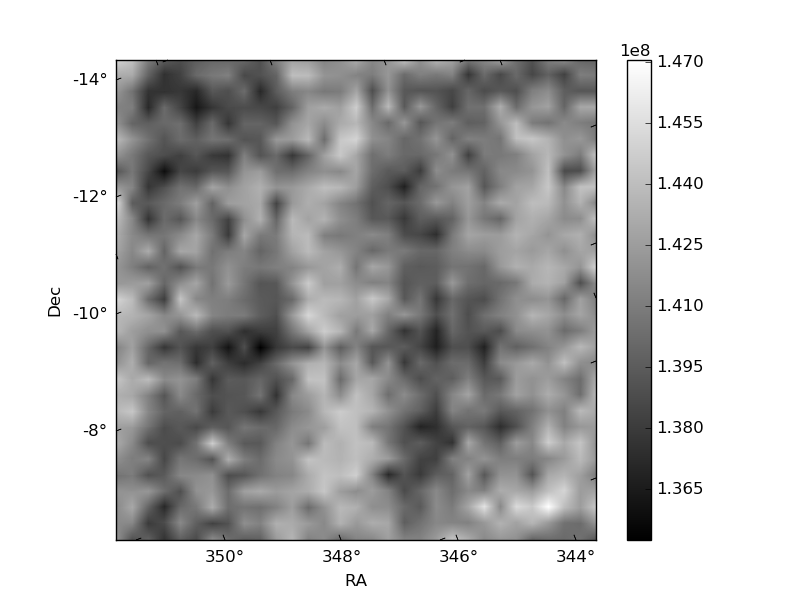
Histogram calculated using DETX and DETY for each event in the final _common_clean file
| Quadrant A | 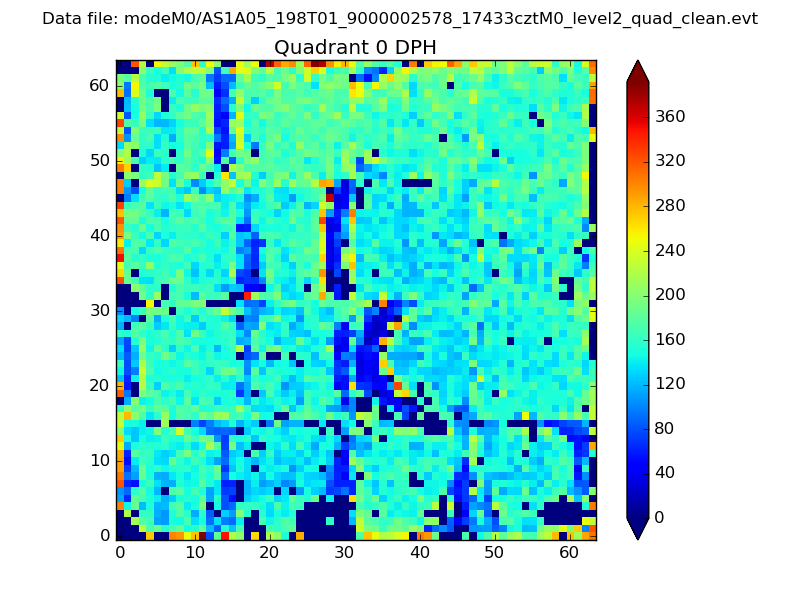 |
 |
Quadrant B |
|---|---|---|---|
| Quadrant D |  |
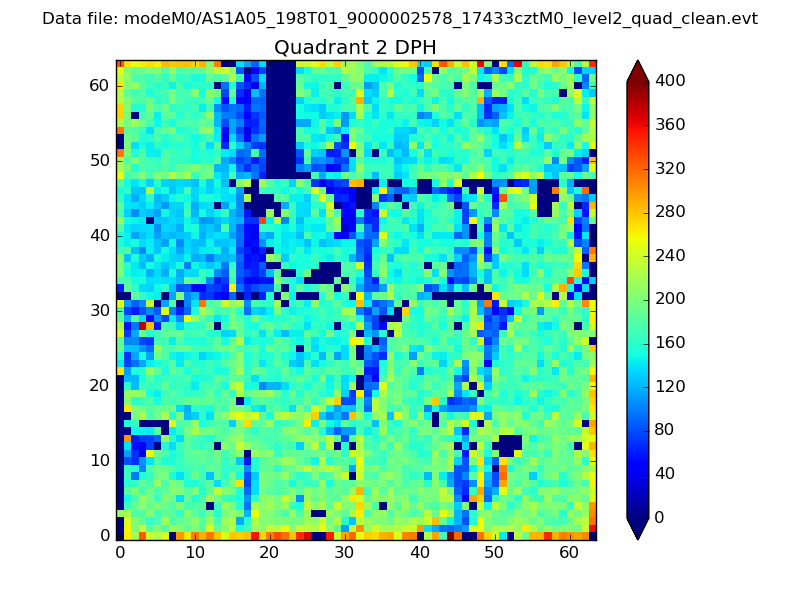 |
Quadrant C |
| Plot type | Count rate plots | Images |
|---|---|---|
| Comparison with Poisson distribution Blue bars denote a histogram of data divided into 1 sec bins. Red curve is a Poisson curve with rate = median count rate of data. |
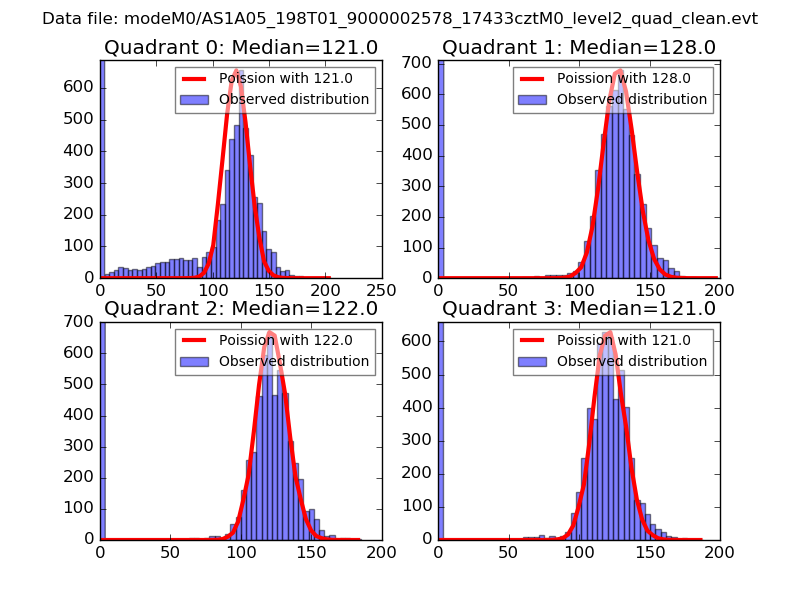 |
 |
| Quadrant-wise count rates Data is divided into 100 sec bins |
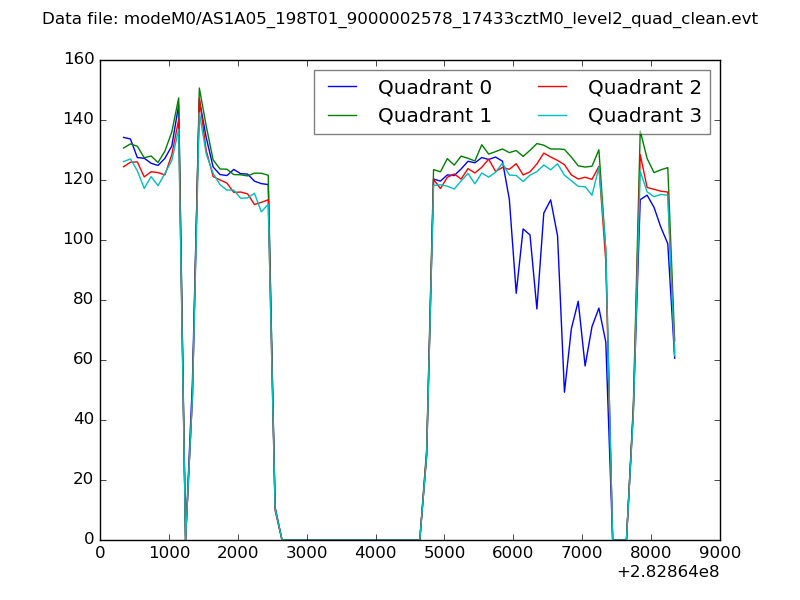 |
|
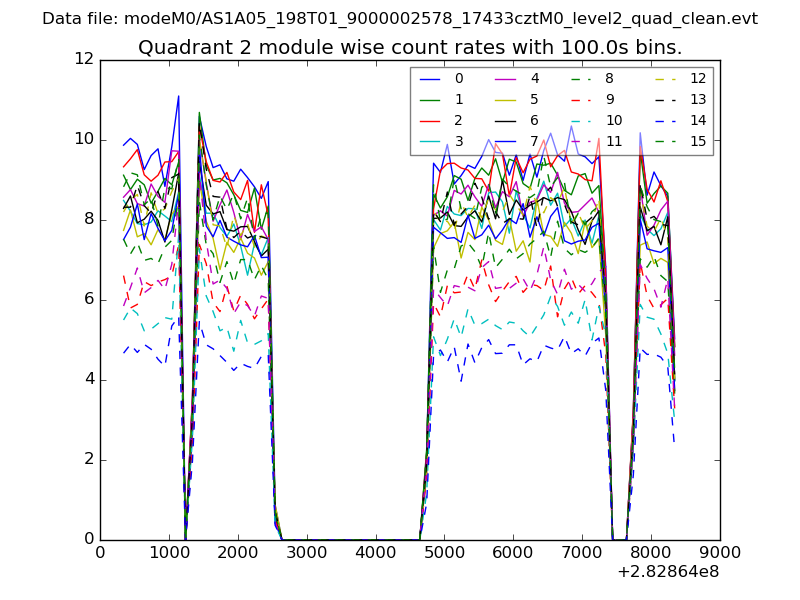
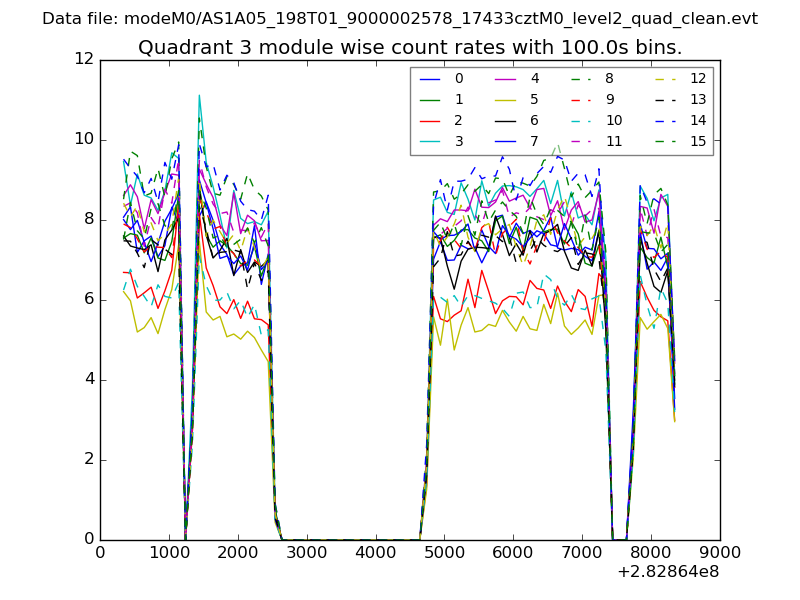
| Module-wise count rates for Quadrant A Data is divided into 100 sec bins |
 |
 |
| Module-wise count rates for Quadrant B Data is divided into 100 sec bins |
 |
 |
| Module-wise count rates for Quadrant C Data is divided into 100 sec bins |
 |
 |
| Module-wise count rates for Quadrant D Data is divided into 100 sec bins |
 |
 |
| Parameter | Plot |
|---|---|
| CZT HV Monitor | 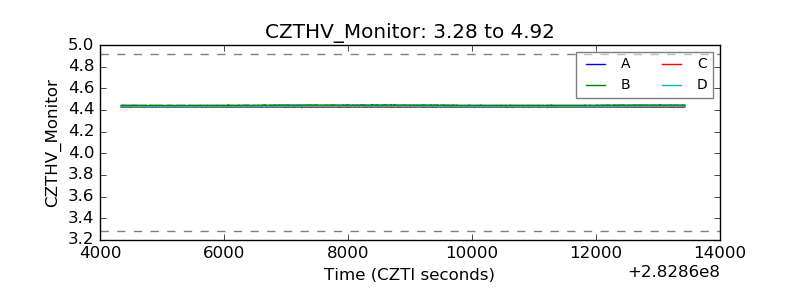 |
| D_VDD | 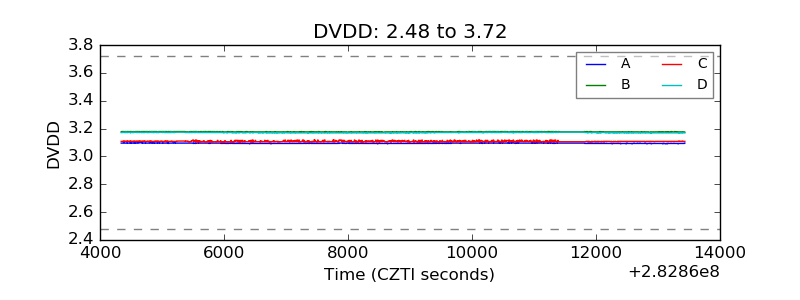 |
| Temperature 1 | 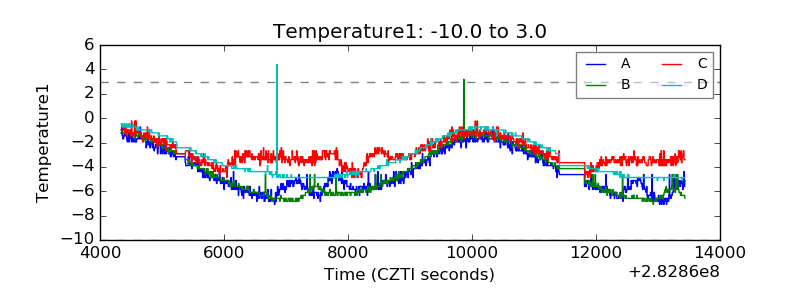 |
| Veto HV Monitor | 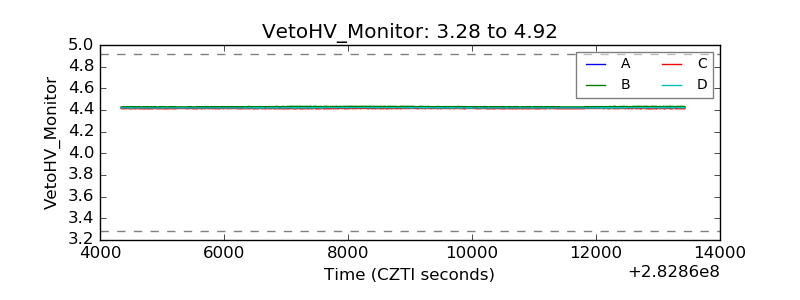 |
| Veto LLD | 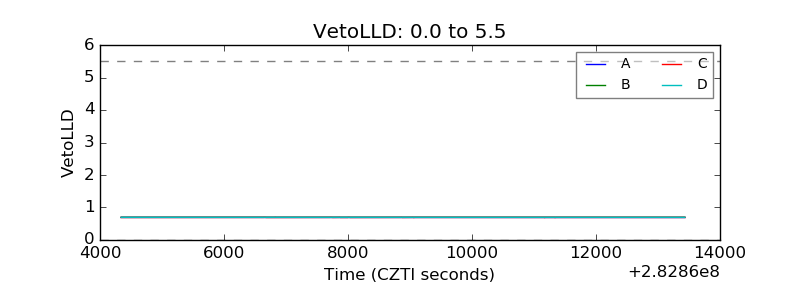 |
| Alpha Counter | 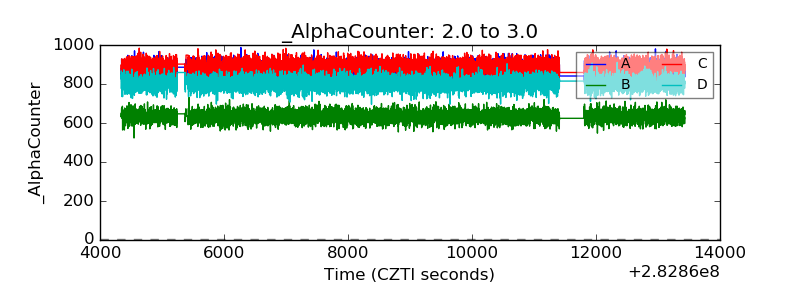 |
| _CPM_Rate | 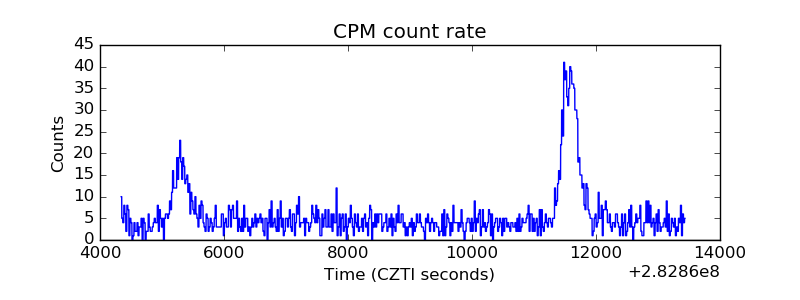 |
| CZT Counter | 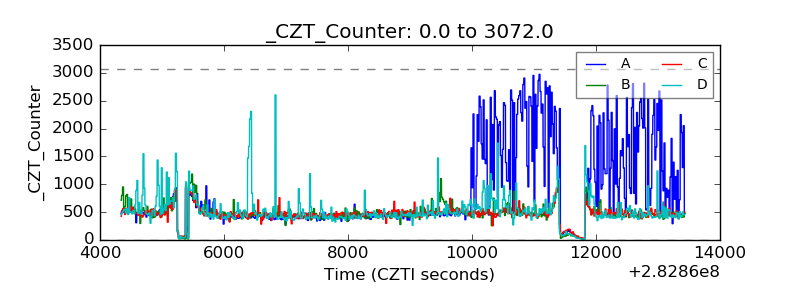 |
| +2.5 Volts monitor |  |
| +5 Volts monitor |  |
| _ROLL_ROT | 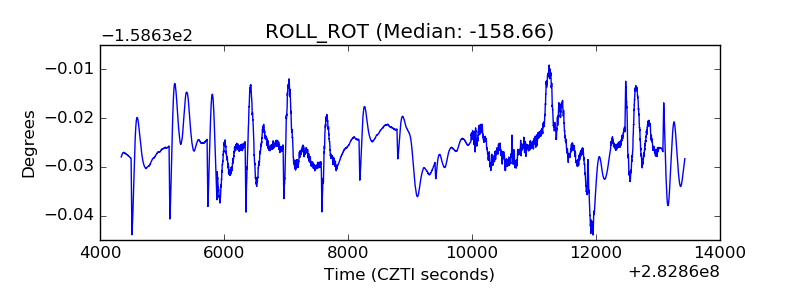 |
| _Roll_DEC | 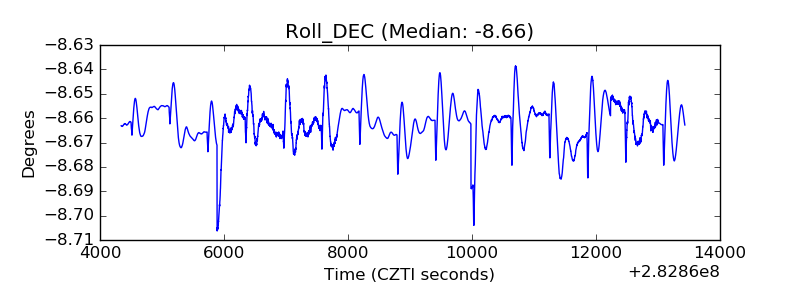 |
| _Roll_RA | 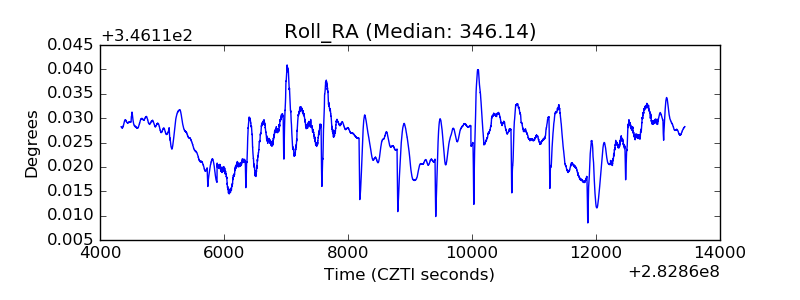 |
| Veto Counter | 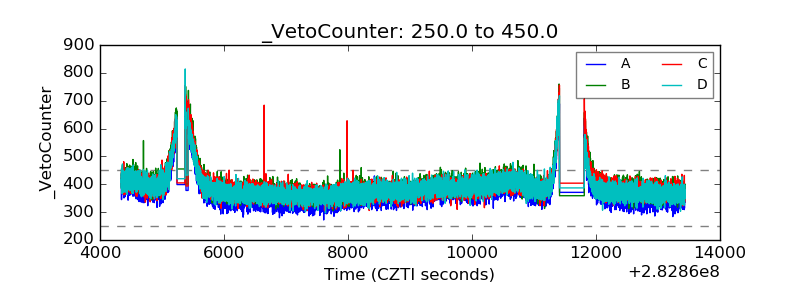 |