| Param | Original file | Final file |
|---|---|---|
| Filename | modeM0/AS1A05_198T01_9000002578_17435cztM0_level2.evt | modeM0/AS1A05_198T01_9000002578_17435cztM0_level2_quad_clean.evt |
| Size (bytes) | 1,016,294,400 | 140,849,280 |
| Size | 969.2 MB | 134.3 MB |
| Events in quadrant A | 9,184,566 | 836,270 |
| Events in quadrant B | 6,572,735 | 865,946 |
| Events in quadrant C | 6,385,523 | 836,840 |
| Events in quadrant D | 7,755,684 | 826,618 |
| Mode M9 | |||
|---|---|---|---|
| Quadrant | BADHDUFLAG | Total packets | Discarded packets |
| A | 0 | 18 | 0 |
| B | 0 | 18 | 0 |
| C | 0 | 18 | 0 |
| D | 0 | 18 | 0 |
| Mode M0 | |||
|---|---|---|---|
| Quadrant | BADHDUFLAG | Total packets | Discarded packets |
| A | 0 | 35816 | 3 |
| B | 0 | 27900 | 3 |
| C | 0 | 26796 | 3 |
| D | 0 | 32043 | 3 |
| Mode SS | |||
|---|---|---|---|
| Quadrant | BADHDUFLAG | Total packets | Discarded packets |
| A | 0 | 264 | 0 |
| B | 0 | 264 | 0 |
| C | 0 | 264 | 0 |
| D | 0 | 264 | 0 |
| Quadrant | Total seconds | Saturated seconds | Saturation percentage |
|---|---|---|---|
| A | 13024 | 820 | 6.296069% |
| B | 13025 | 251 | 1.927063% |
| C | 13025 | 217 | 1.666027% |
| D | 13025 | 501 | 3.846449% |
Noise dominated data is calculated using 1-second bins in cleaned event files. If a bin has >2000 counts, and if more than 50% of those come from <1% of pixels, then it is considered to be noise-dominated and hence unusable.
| Quadrant | # 1 sec bins | Bins with >0 counts | Bins with >2000 counts | High rate bins dominated by noise | Noise dominated (total time) | Noise dominated (detector-on time) | Marked lightcurve |
|---|---|---|---|---|---|---|---|
| A | 14694 | 13025 | 550 | 550 | 3.74% | 4.22% | 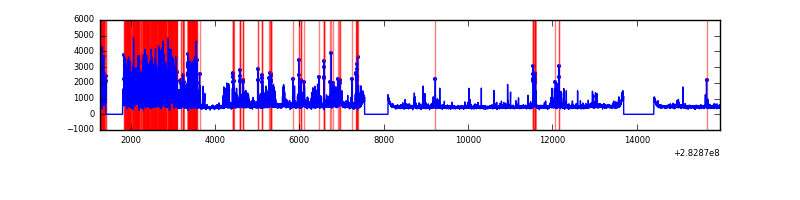 |
| B | 14695 | 13028 | 54 | 54 | 0.37% | 0.41% |  |
| C | 14695 | 13027 | 0 | 0 | 0.00% | 0.00% | 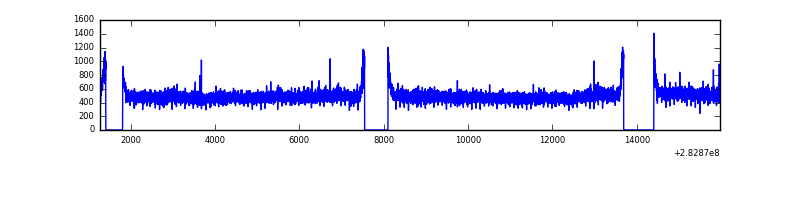 |
| D | 14695 | 13027 | 279 | 279 | 1.90% | 2.14% | 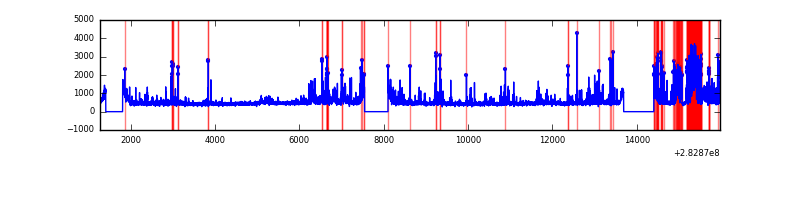 |
Top three noisy pixels from each quadrant. If the there are fewer than three noisy pixels in the level2.evt file, extra rows are filled as -1
| Pixel properties | Quadrant properties | ||||||
|---|---|---|---|---|---|---|---|
| Quadrant | DetID | PixID | Counts | Sigma | Mean | Median | Sigma |
| A | 10 | 253 | 3132435 | 10089.08 | 1539 | 1503 | 310.3 |
| A | 14 | 238 | 106656 | 338.84 | 1539 | 1503 | 310.3 |
| A | 14 | 237 | 15578 | 45.36 | 1539 | 1503 | 310.3 |
| B | 7 | 220 | 166439 | 541.87 | 1569 | 1527 | 304.3 |
| B | 0 | 189 | 83849 | 270.5 | 1569 | 1527 | 304.3 |
| B | 0 | 244 | 71843 | 231.05 | 1569 | 1527 | 304.3 |
| C | 5 | 218 | 229378 | 641.47 | 1503 | 1515 | 355.2 |
| C | 14 | 238 | 227813 | 637.06 | 1503 | 1515 | 355.2 |
| C | 5 | 219 | 35527 | 95.75 | 1503 | 1515 | 355.2 |
| D | 13 | 232 | 982732 | 2673.1 | 1508 | 1464 | 367.1 |
| D | 1 | 52 | 482946 | 1311.62 | 1508 | 1464 | 367.1 |
| D | 13 | 189 | 206869 | 559.55 | 1508 | 1464 | 367.1 |
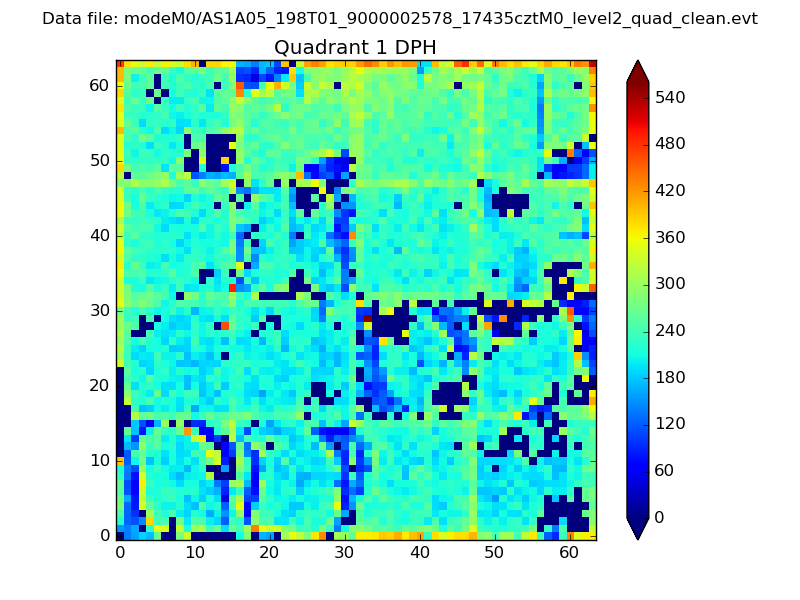
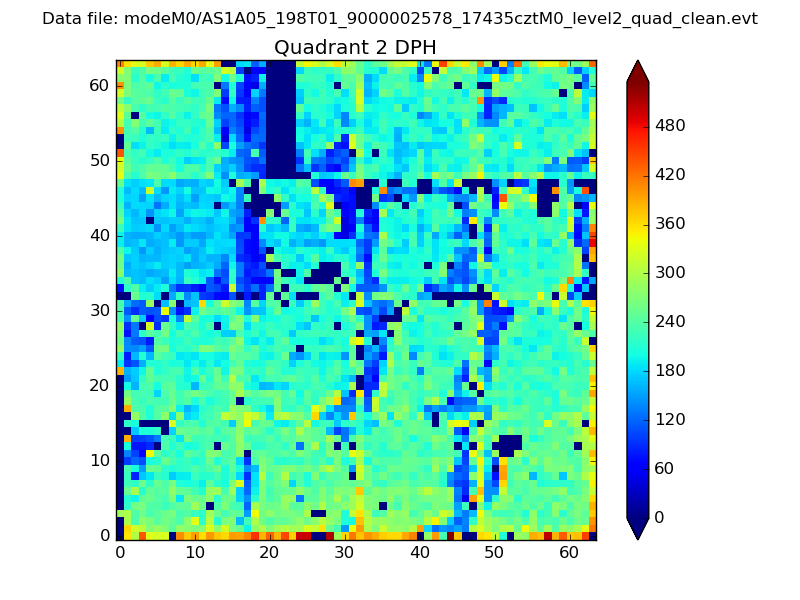
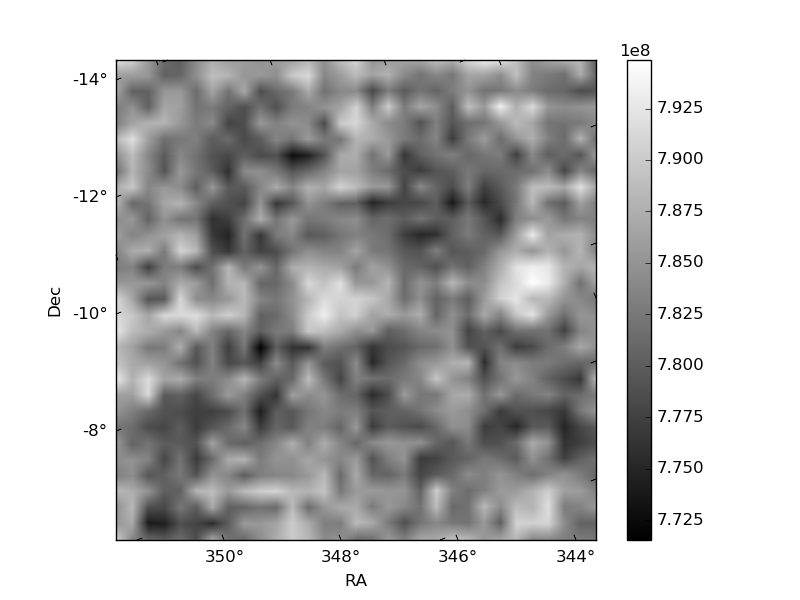
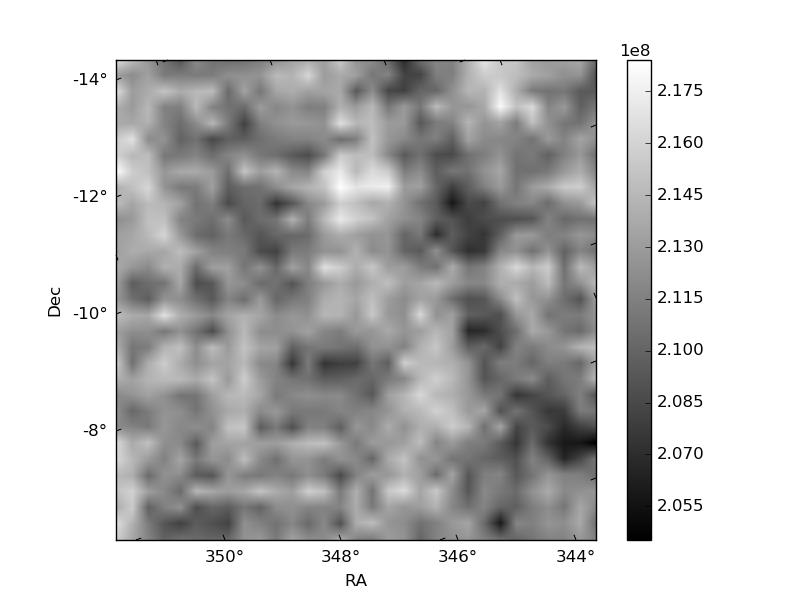
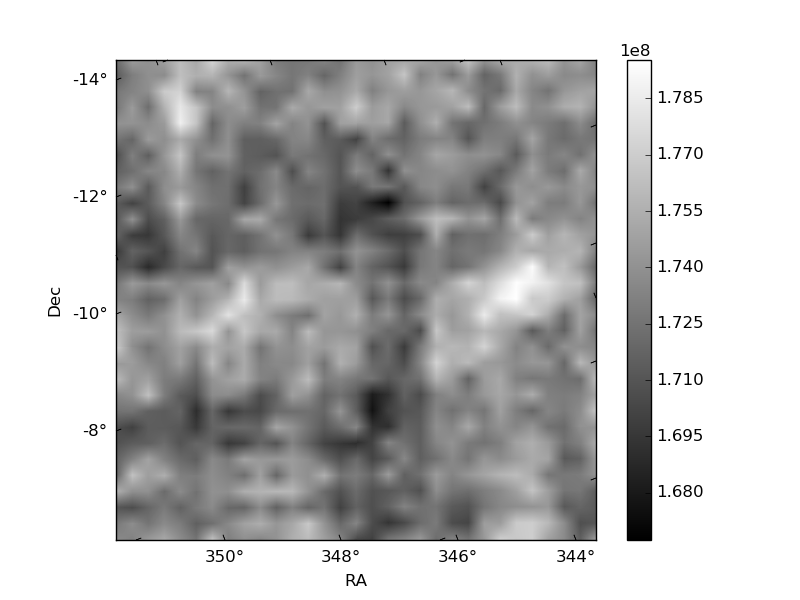
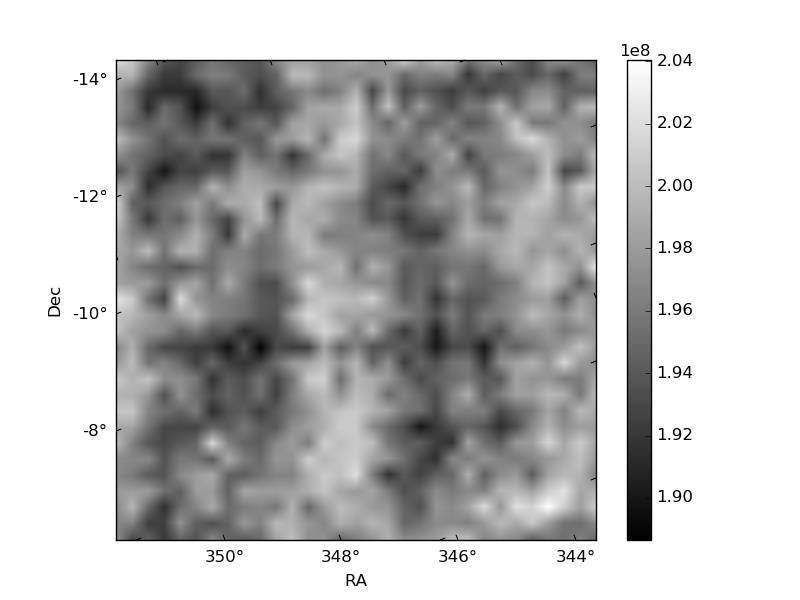
Histogram calculated using DETX and DETY for each event in the final _common_clean file
| Quadrant A | 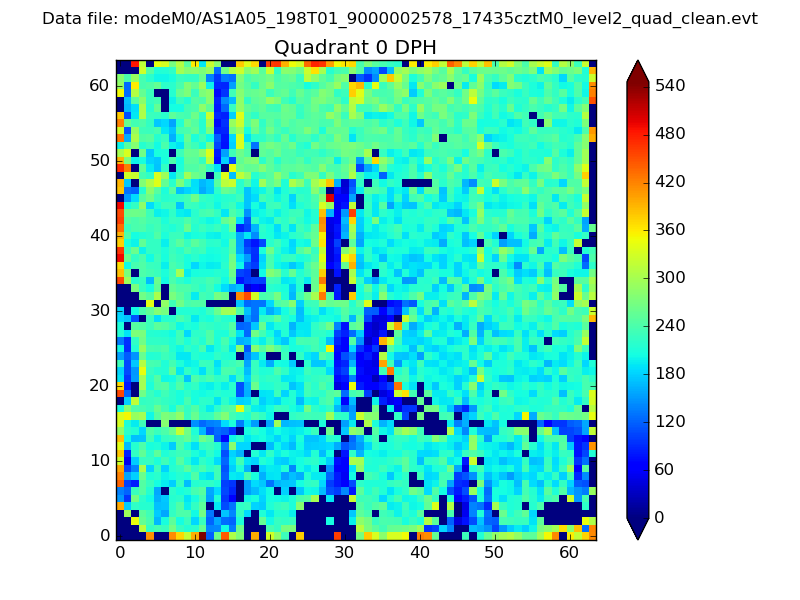 |
 |
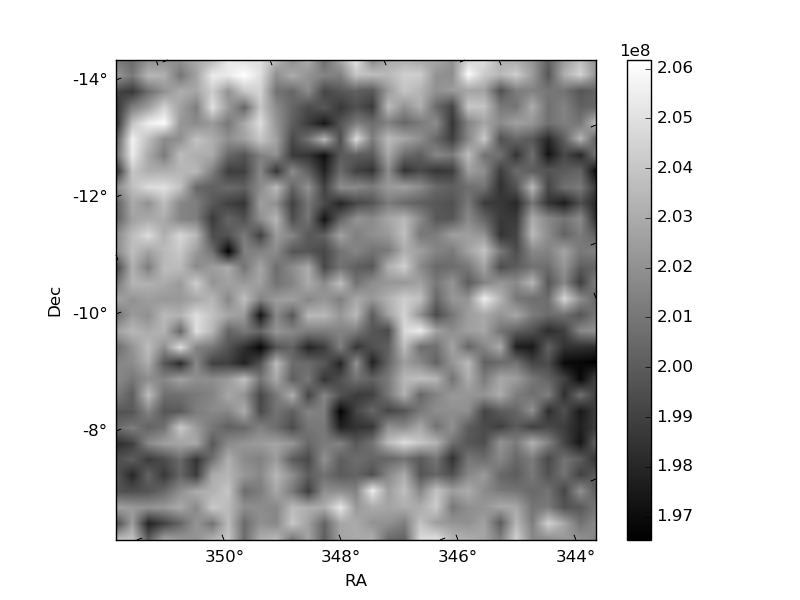
Quadrant B |
|---|---|---|---|
| Quadrant D | 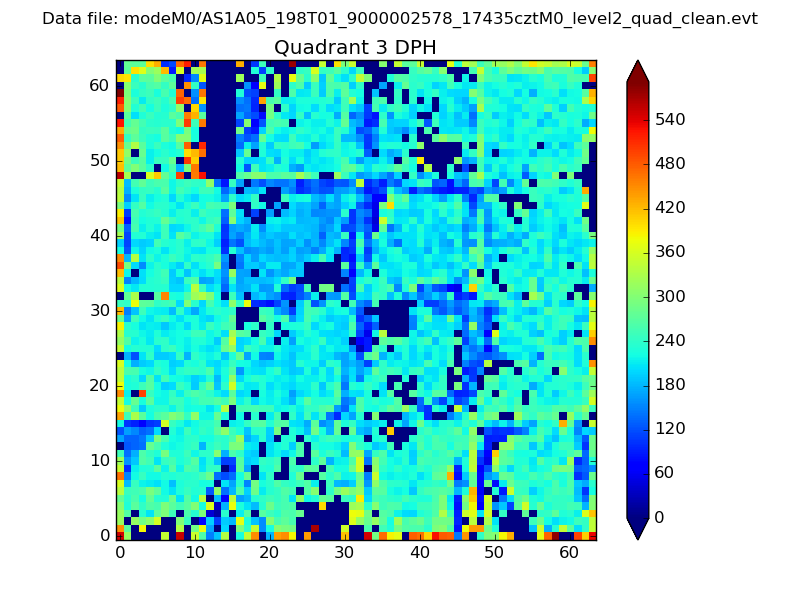 |
 |
Quadrant C |
| Plot type | Count rate plots | Images |
|---|---|---|
| Comparison with Poisson distribution Blue bars denote a histogram of data divided into 1 sec bins. Red curve is a Poisson curve with rate = median count rate of data. |
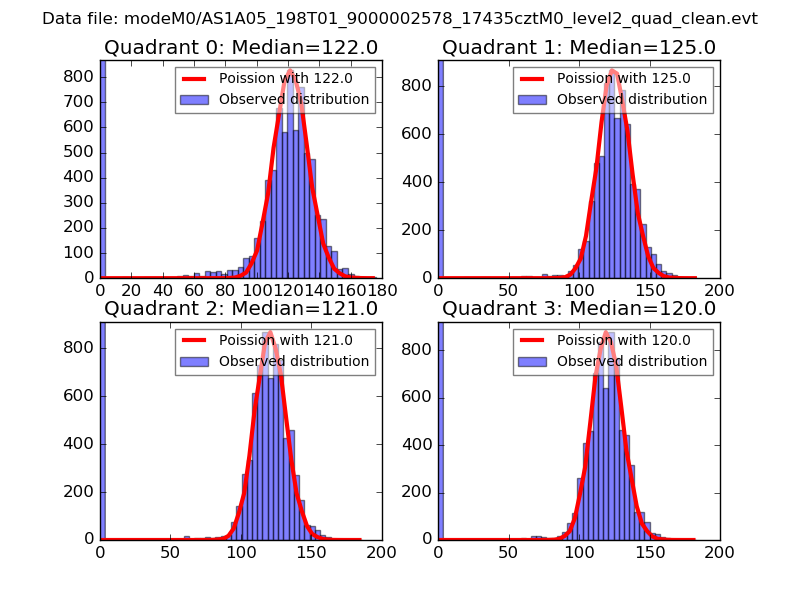 |
 |
| Quadrant-wise count rates Data is divided into 100 sec bins |
 |
|
| Module-wise count rates for Quadrant A Data is divided into 100 sec bins |
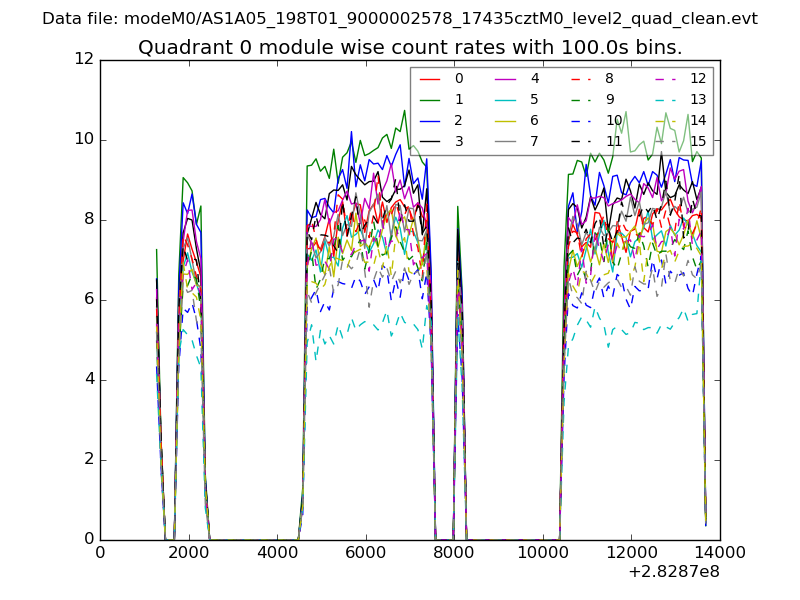 |
 |
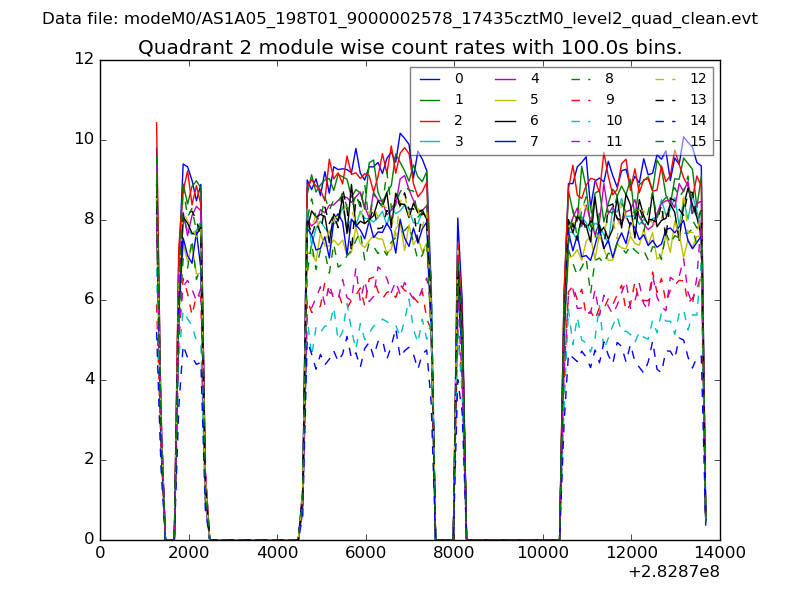
| Module-wise count rates for Quadrant B Data is divided into 100 sec bins |
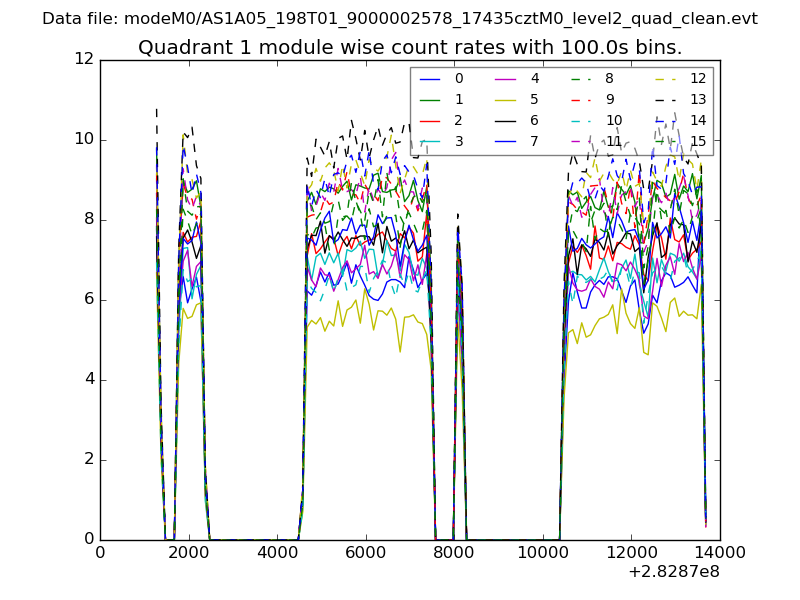 |
 |
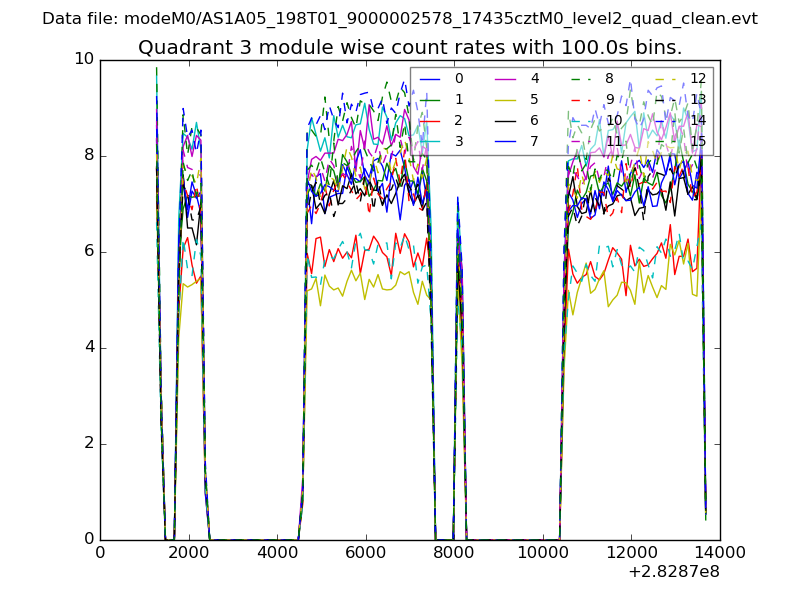
| Module-wise count rates for Quadrant C Data is divided into 100 sec bins |
 |
 |
| Module-wise count rates for Quadrant D Data is divided into 100 sec bins |
 |
 |
| Parameter | Plot |
|---|---|
| CZT HV Monitor | 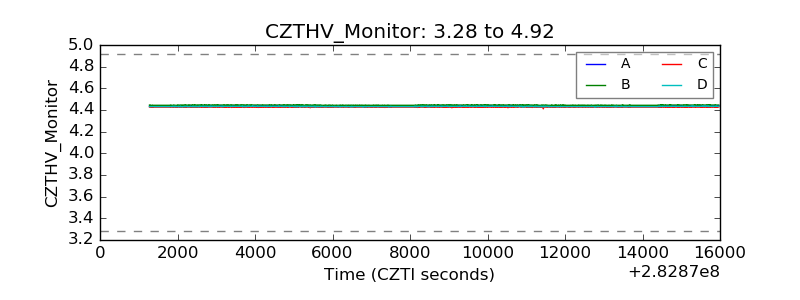 |
| D_VDD | 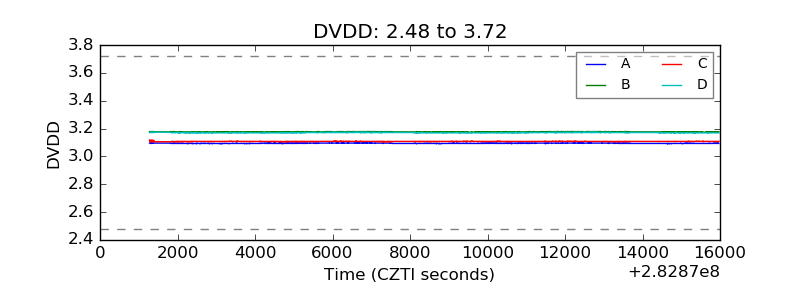 |
| Temperature 1 |  |
| Veto HV Monitor | 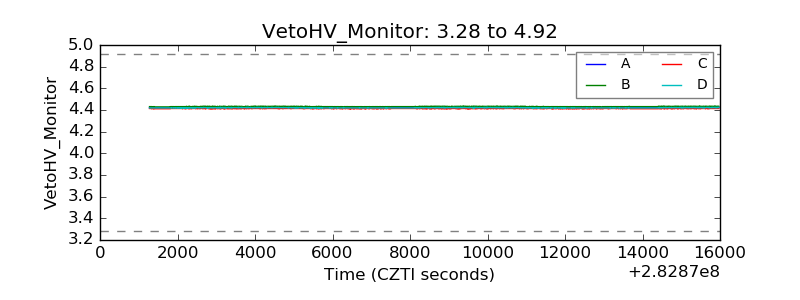 |
| Veto LLD | 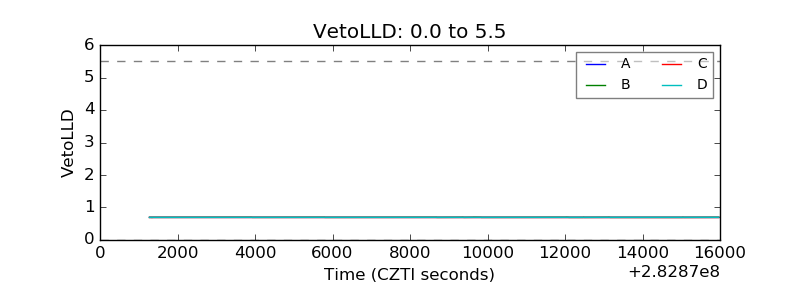 |
| Alpha Counter | 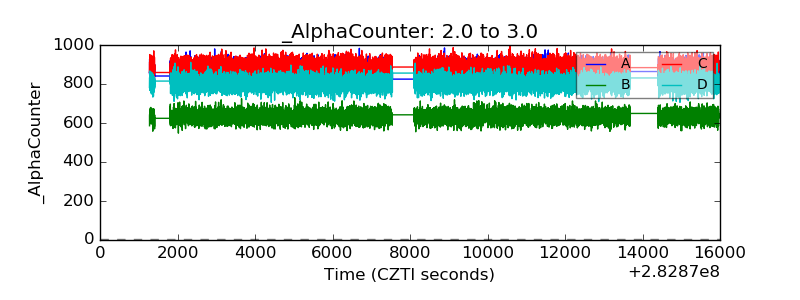 |
| _CPM_Rate | 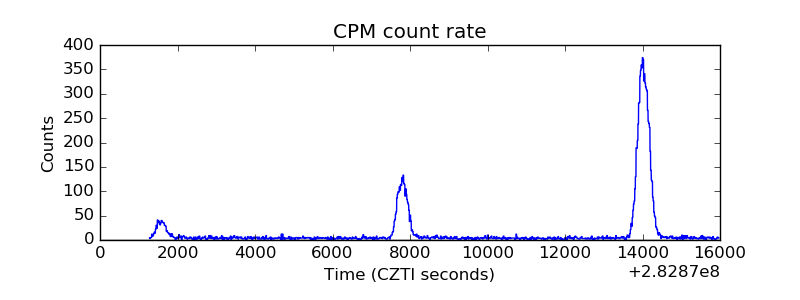 |
| CZT Counter | 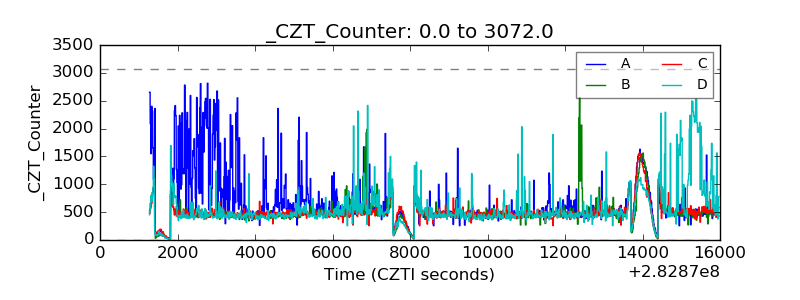 |
| +2.5 Volts monitor |  |
| +5 Volts monitor |  |
| _ROLL_ROT | 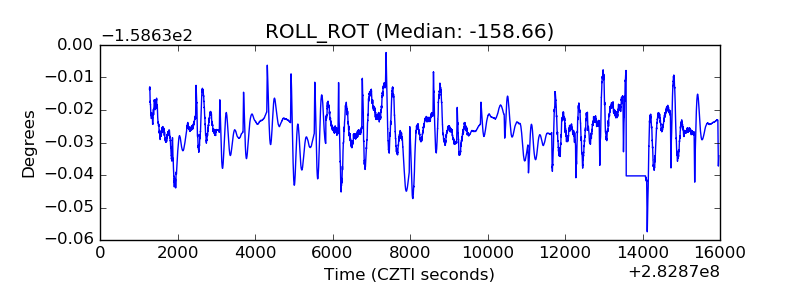 |
| _Roll_DEC | 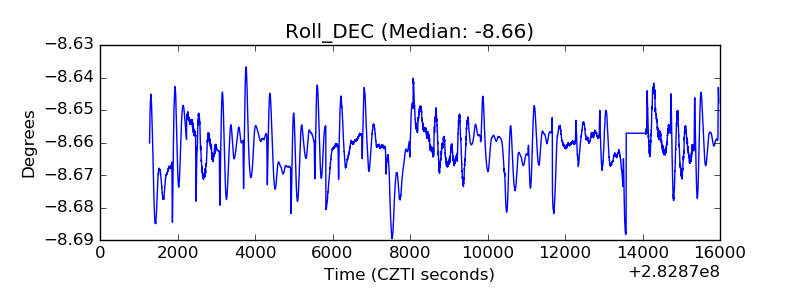 |
| _Roll_RA | 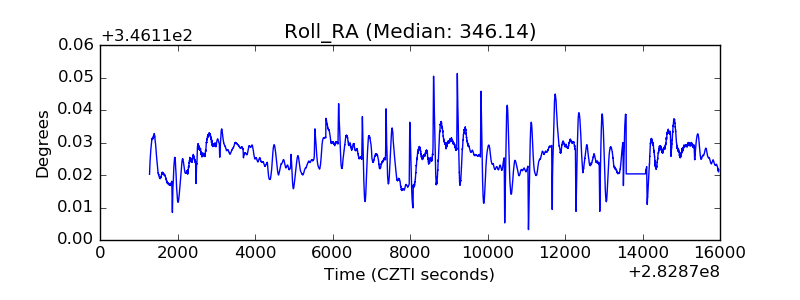 |
| Veto Counter | 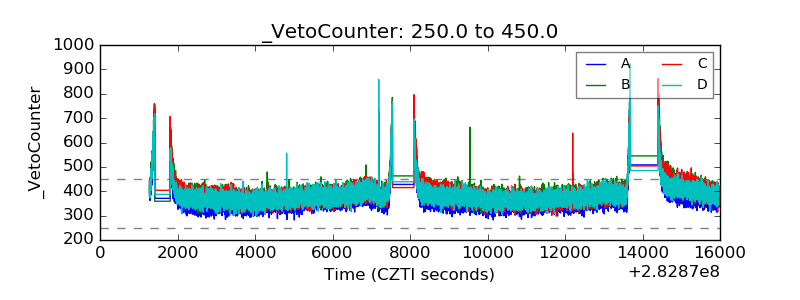 |