| Param | Original file | Final file |
|---|---|---|
| Filename | modeM0/AS1A05_198T01_9000002578_17436cztM0_level2.evt | modeM0/AS1A05_198T01_9000002578_17436cztM0_level2_quad_clean.evt |
| Size (bytes) | 525,911,040 | 71,052,480 |
| Size | 501.5 MB | 67.8 MB |
| Events in quadrant A | 3,391,786 | 424,243 |
| Events in quadrant B | 3,504,412 | 428,518 |
| Events in quadrant C | 3,541,679 | 412,610 |
| Events in quadrant D | 5,024,466 | 408,370 |
| Mode M9 | |||
|---|---|---|---|
| Quadrant | BADHDUFLAG | Total packets | Discarded packets |
| A | 0 | 9 | 0 |
| B | 0 | 10 | 0 |
| C | 0 | 10 | 0 |
| D | 0 | 10 | 0 |
| Mode M0 | |||
|---|---|---|---|
| Quadrant | BADHDUFLAG | Total packets | Discarded packets |
| A | 0 | 14416 | 2 |
| B | 0 | 14600 | 2 |
| C | 0 | 14441 | 2 |
| D | 0 | 19546 | 2 |
| Mode SS | |||
|---|---|---|---|
| Quadrant | BADHDUFLAG | Total packets | Discarded packets |
| A | 0 | 138 | 0 |
| B | 0 | 138 | 0 |
| C | 0 | 138 | 0 |
| D | 0 | 138 | 0 |
| Quadrant | Total seconds | Saturated seconds | Saturation percentage |
|---|---|---|---|
| A | 6856 | 81 | 1.181447% |
| B | 6856 | 100 | 1.458576% |
| C | 6856 | 113 | 1.648191% |
| D | 6856 | 463 | 6.753209% |
Noise dominated data is calculated using 1-second bins in cleaned event files. If a bin has >2000 counts, and if more than 50% of those come from <1% of pixels, then it is considered to be noise-dominated and hence unusable.
| Quadrant | # 1 sec bins | Bins with >0 counts | Bins with >2000 counts | High rate bins dominated by noise | Noise dominated (total time) | Noise dominated (detector-on time) | Marked lightcurve |
|---|---|---|---|---|---|---|---|
| A | 7766 | 6857 | 8 | 8 | 0.10% | 0.12% | 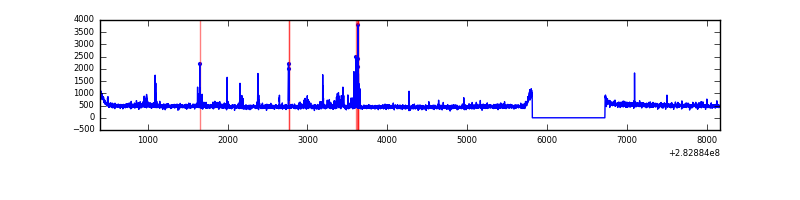 |
| B | 7766 | 6856 | 16 | 16 | 0.21% | 0.23% | 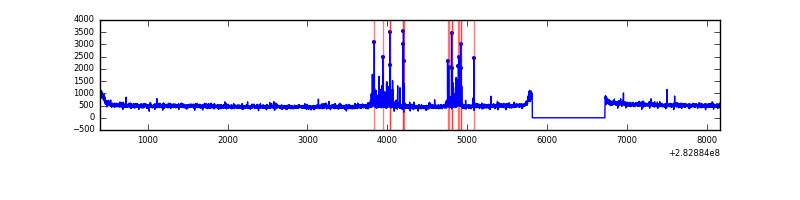 |
| C | 7766 | 6856 | 0 | 0 | 0.00% | 0.00% | 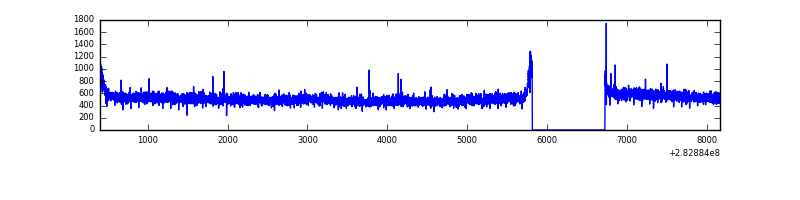 |
| D | 7766 | 6856 | 299 | 299 | 3.85% | 4.36% | 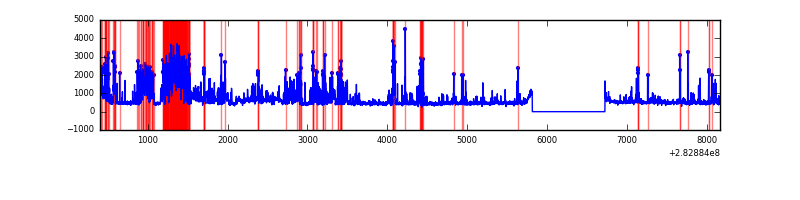 |
Top three noisy pixels from each quadrant. If the there are fewer than three noisy pixels in the level2.evt file, extra rows are filled as -1
| Pixel properties | Quadrant properties | ||||||
|---|---|---|---|---|---|---|---|
| Quadrant | DetID | PixID | Counts | Sigma | Mean | Median | Sigma |
| A | 10 | 253 | 130699 | 751.4 | 845 | 826 | 172.8 |
| A | 4 | 2 | 9561 | 50.54 | 845 | 826 | 172.8 |
| A | 0 | 226 | 7437 | 38.25 | 845 | 826 | 172.8 |
| B | 0 | 197 | 76304 | 467.32 | 845 | 823 | 161.5 |
| B | 7 | 220 | 75105 | 459.9 | 845 | 823 | 161.5 |
| B | 0 | 189 | 19877 | 117.97 | 845 | 823 | 161.5 |
| C | 5 | 218 | 155443 | 805.54 | 810 | 813 | 192.0 |
| C | 14 | 238 | 124502 | 644.35 | 810 | 813 | 192.0 |
| C | 3 | 233 | 46362 | 237.29 | 810 | 813 | 192.0 |
| D | 1 | 52 | 864553 | 4389.51 | 804 | 780 | 196.8 |
| D | 13 | 232 | 847026 | 4300.44 | 804 | 780 | 196.8 |
| D | 13 | 189 | 207649 | 1051.26 | 804 | 780 | 196.8 |
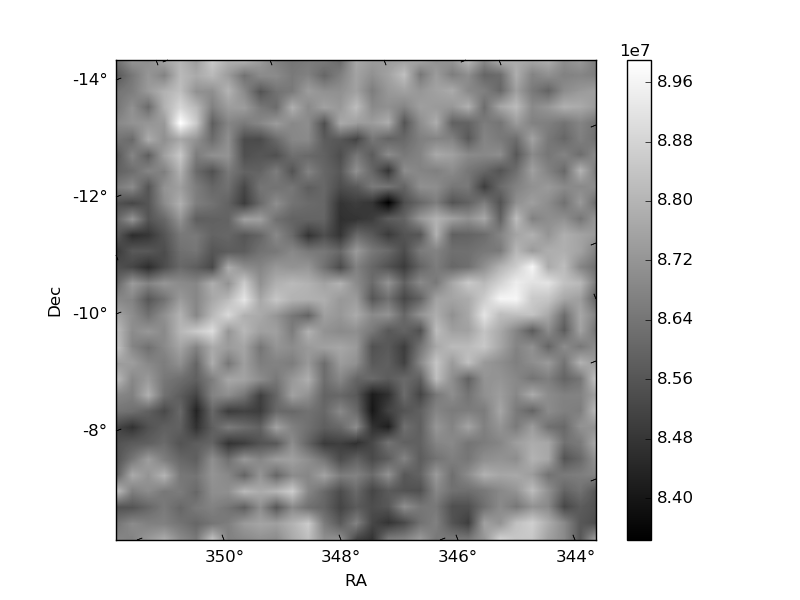
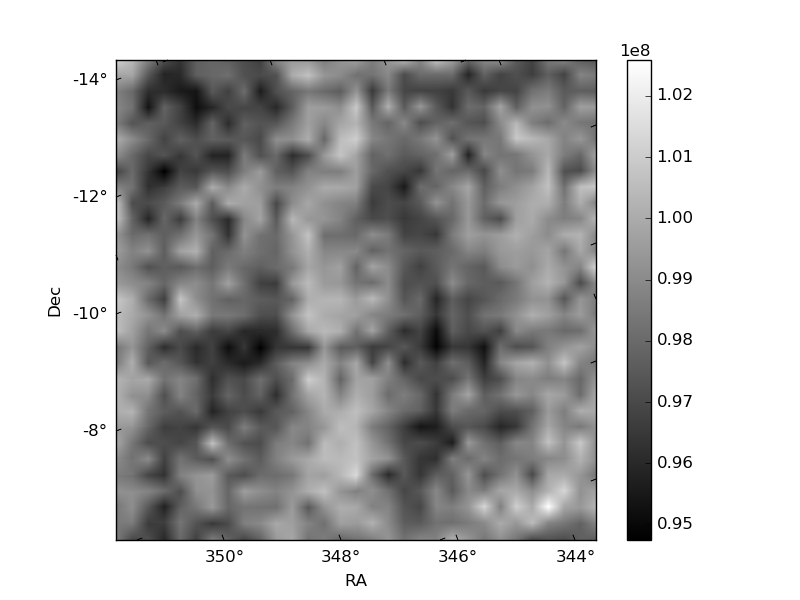
Histogram calculated using DETX and DETY for each event in the final _common_clean file
| Quadrant A |  |
 |
Quadrant B |
|---|---|---|---|
| Quadrant D |  |
 |
Quadrant C |
| Plot type | Count rate plots | Images |
|---|---|---|
| Comparison with Poisson distribution Blue bars denote a histogram of data divided into 1 sec bins. Red curve is a Poisson curve with rate = median count rate of data. |
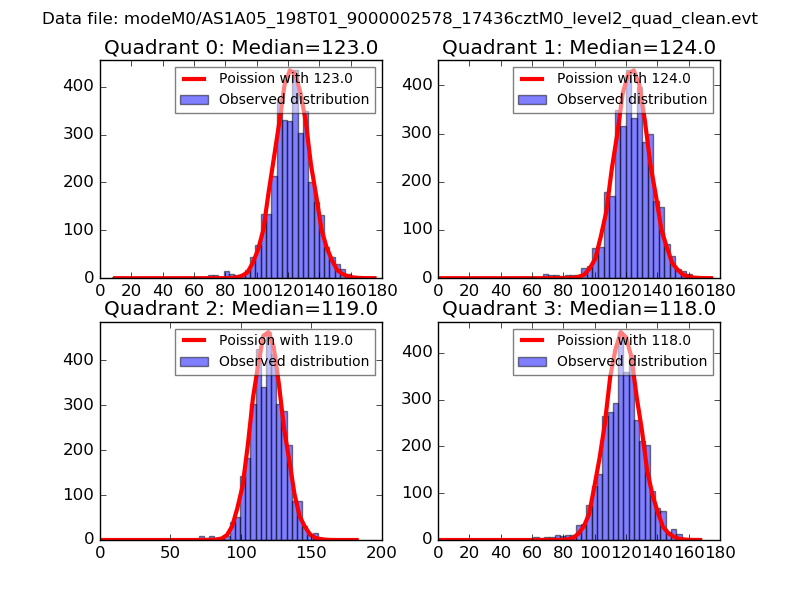 |
 |
| Quadrant-wise count rates Data is divided into 100 sec bins |
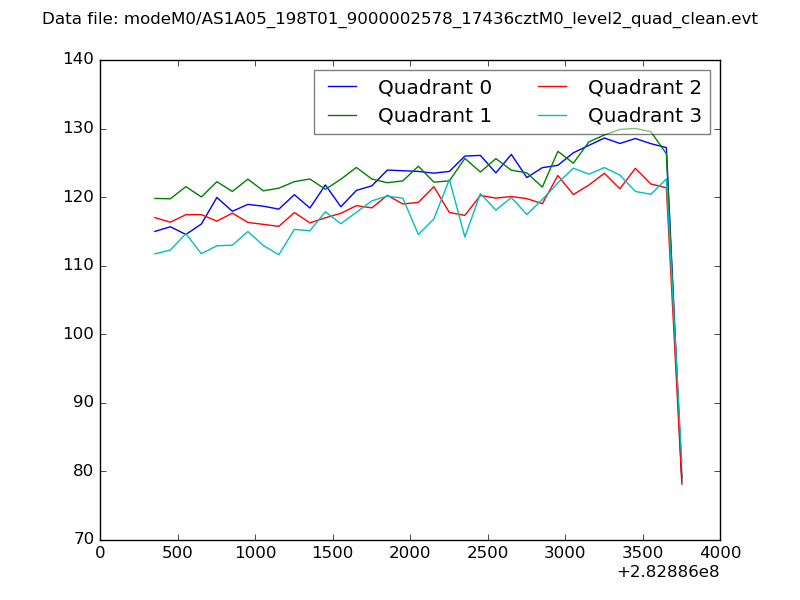 |
|
| Module-wise count rates for Quadrant A Data is divided into 100 sec bins |
 |
 |
| Module-wise count rates for Quadrant B Data is divided into 100 sec bins |
 |
 |
| Module-wise count rates for Quadrant C Data is divided into 100 sec bins |
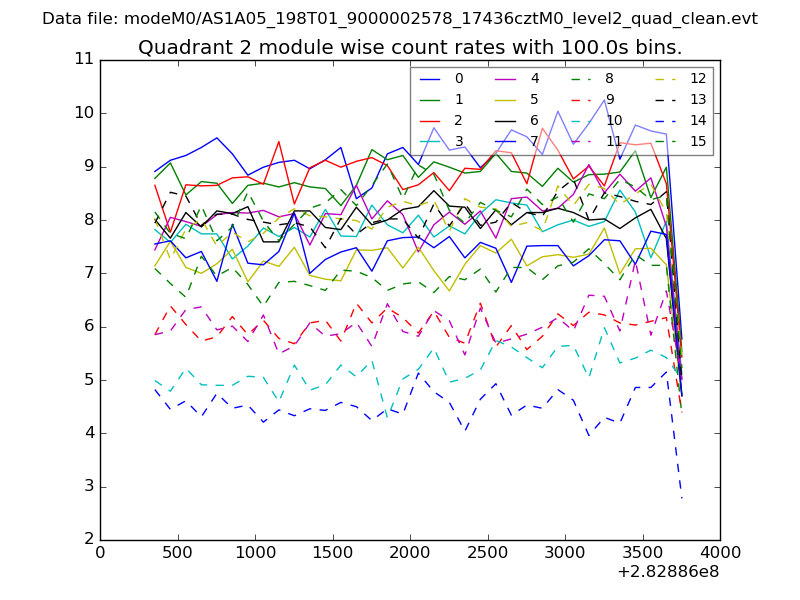 |
 |
| Module-wise count rates for Quadrant D Data is divided into 100 sec bins |
 |
 |
| Parameter | Plot |
|---|---|
| CZT HV Monitor | 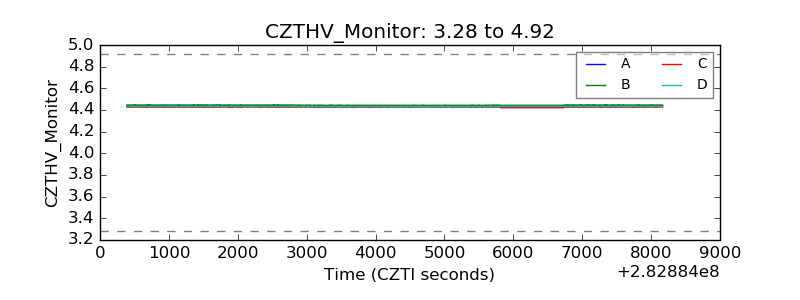 |
| D_VDD |  |
| Temperature 1 |  |
| Veto HV Monitor |  |
| Veto LLD |  |
| Alpha Counter | 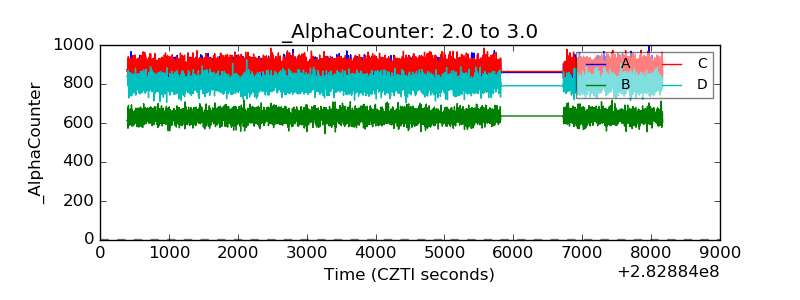 |
| _CPM_Rate | 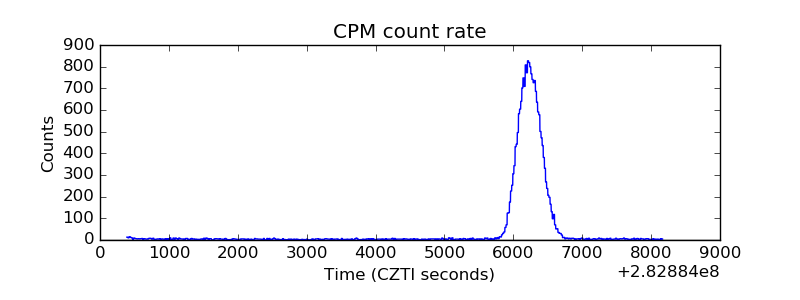 |
| CZT Counter |  |
| +2.5 Volts monitor |  |
| +5 Volts monitor |  |
| _ROLL_ROT |  |
| _Roll_DEC |  |
| _Roll_RA |  |
| Veto Counter |  |