| Param | Original file | Final file |
|---|---|---|
| Filename | modeM0/AS1A05_198T01_9000002578_17437cztM0_level2.evt | modeM0/AS1A05_198T01_9000002578_17437cztM0_level2_quad_clean.evt |
| Size (bytes) | 322,738,560 | 61,032,960 |
| Size | 307.8 MB | 58.2 MB |
| Events in quadrant A | 2,225,430 | 387,473 |
| Events in quadrant B | 2,318,077 | 392,668 |
| Events in quadrant C | 2,300,504 | 376,059 |
| Events in quadrant D | 2,616,759 | 368,690 |
| Mode M9 | |||
|---|---|---|---|
| Quadrant | BADHDUFLAG | Total packets | Discarded packets |
| A | 0 | 6 | 0 |
| B | 0 | 7 | 0 |
| C | 0 | 7 | 0 |
| D | 0 | 7 | 0 |
| Mode M0 | |||
|---|---|---|---|
| Quadrant | BADHDUFLAG | Total packets | Discarded packets |
| A | 0 | 9587 | 1 |
| B | 0 | 9737 | 1 |
| C | 0 | 9596 | 1 |
| D | 0 | 10785 | 1 |
| Mode SS | |||
|---|---|---|---|
| Quadrant | BADHDUFLAG | Total packets | Discarded packets |
| A | 0 | 92 | 0 |
| B | 0 | 92 | 0 |
| C | 0 | 92 | 0 |
| D | 0 | 92 | 0 |
| Quadrant | Total seconds | Saturated seconds | Saturation percentage |
|---|---|---|---|
| A | 4595 | 17 | 0.369967% |
| B | 4595 | 34 | 0.739935% |
| C | 4595 | 34 | 0.739935% |
| D | 4595 | 85 | 1.849837% |
Noise dominated data is calculated using 1-second bins in cleaned event files. If a bin has >2000 counts, and if more than 50% of those come from <1% of pixels, then it is considered to be noise-dominated and hence unusable.
| Quadrant | # 1 sec bins | Bins with >0 counts | Bins with >2000 counts | High rate bins dominated by noise | Noise dominated (total time) | Noise dominated (detector-on time) | Marked lightcurve |
|---|---|---|---|---|---|---|---|
| A | 4595 | 4595 | 4 | 4 | 0.09% | 0.09% | 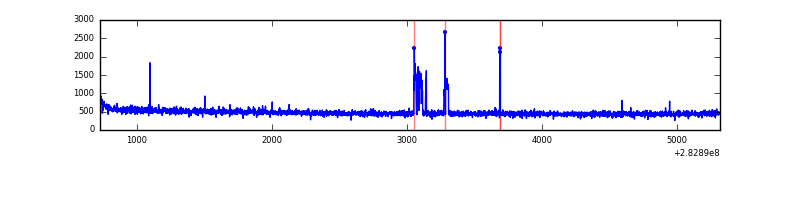 |
| B | 4595 | 4595 | 6 | 6 | 0.13% | 0.13% | 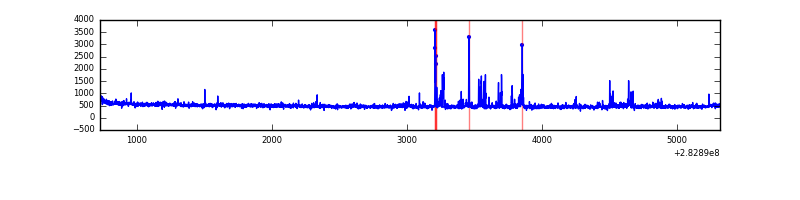 |
| C | 4595 | 4595 | 0 | 0 | 0.00% | 0.00% | 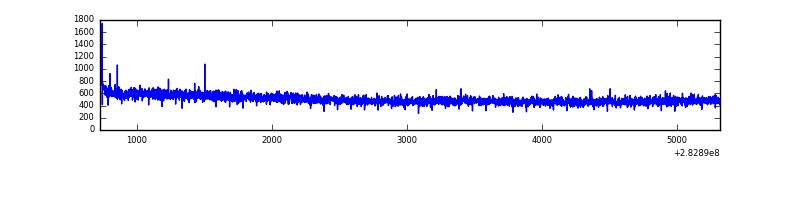 |
| D | 4595 | 4595 | 76 | 76 | 1.65% | 1.65% | 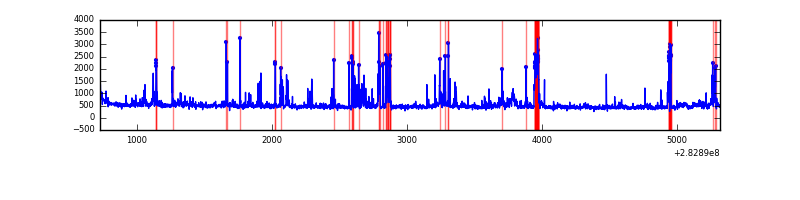 |
Top three noisy pixels from each quadrant. If the there are fewer than three noisy pixels in the level2.evt file, extra rows are filled as -1
| Pixel properties | Quadrant properties | ||||||
|---|---|---|---|---|---|---|---|
| Quadrant | DetID | PixID | Counts | Sigma | Mean | Median | Sigma |
| A | 14 | 4 | 82180 | 721.53 | 555 | 544 | 113.1 |
| A | 6 | 16 | 6495 | 52.6 | 555 | 544 | 113.1 |
| A | 0 | 226 | 4758 | 37.25 | 555 | 544 | 113.1 |
| B | 7 | 220 | 39122 | 358.33 | 555 | 542 | 107.7 |
| B | 4 | 142 | 29125 | 265.48 | 555 | 542 | 107.7 |
| B | 0 | 197 | 24890 | 226.15 | 555 | 542 | 107.7 |
| C | 5 | 218 | 96003 | 770.58 | 527 | 530 | 123.9 |
| C | 14 | 238 | 82852 | 664.43 | 527 | 530 | 123.9 |
| C | 5 | 219 | 32635 | 259.12 | 527 | 530 | 123.9 |
| D | 13 | 232 | 243395 | 1869.06 | 533 | 519 | 129.9 |
| D | 13 | 189 | 183400 | 1407.37 | 533 | 519 | 129.9 |
| D | 11 | 176 | 69913 | 534.02 | 533 | 519 | 129.9 |
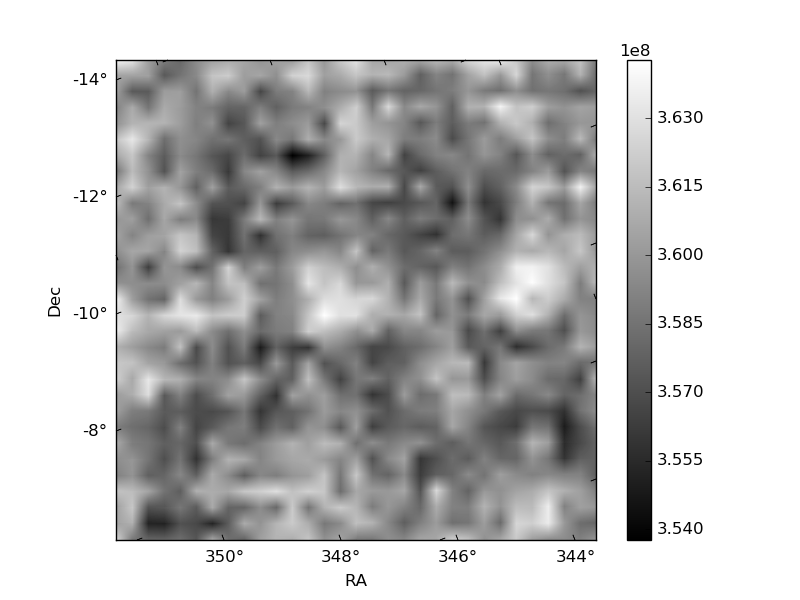
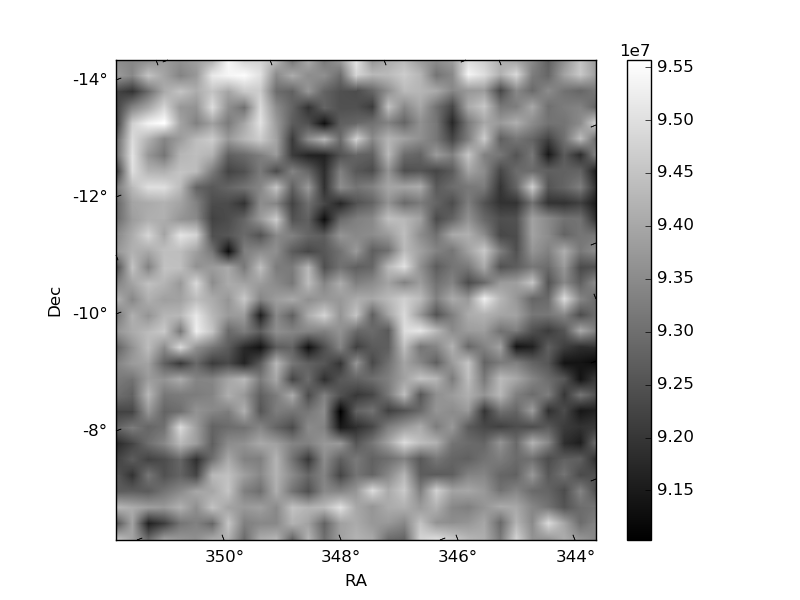
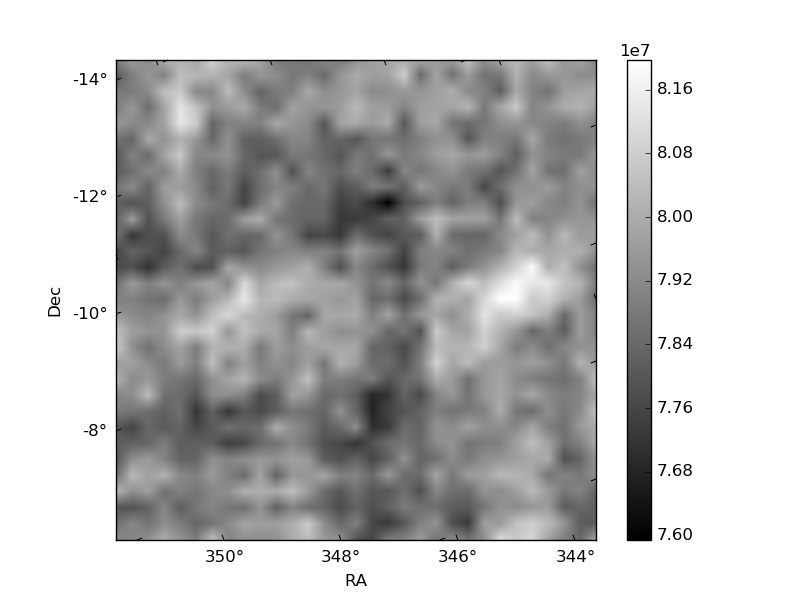
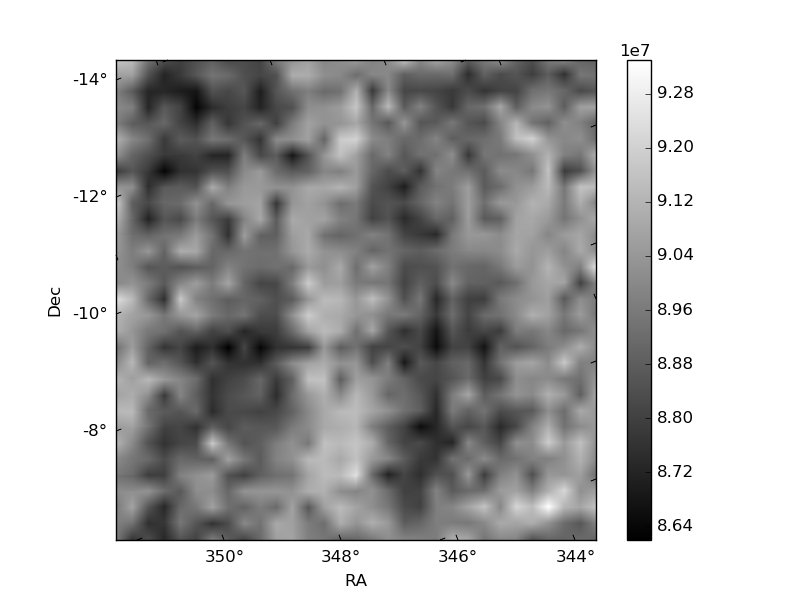
Histogram calculated using DETX and DETY for each event in the final _common_clean file
| Quadrant A | 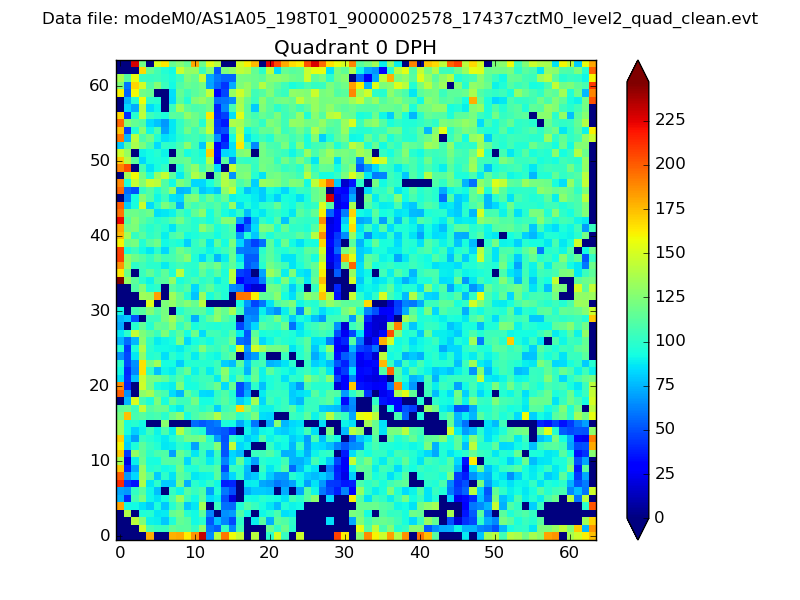 |
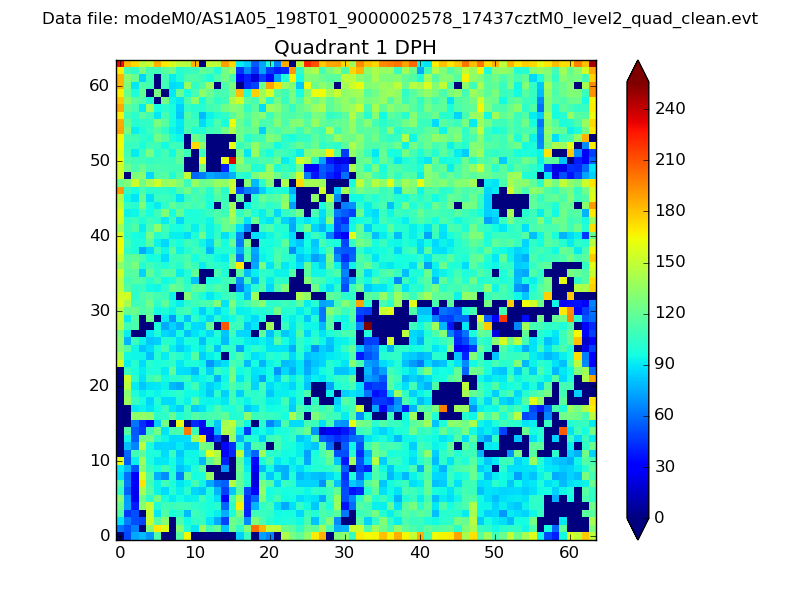 |
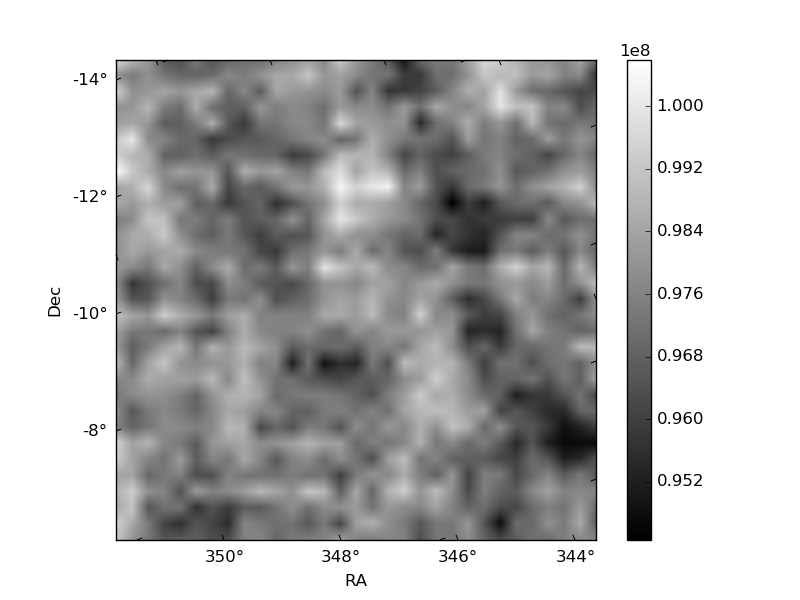
Quadrant B |
|---|---|---|---|
| Quadrant D | 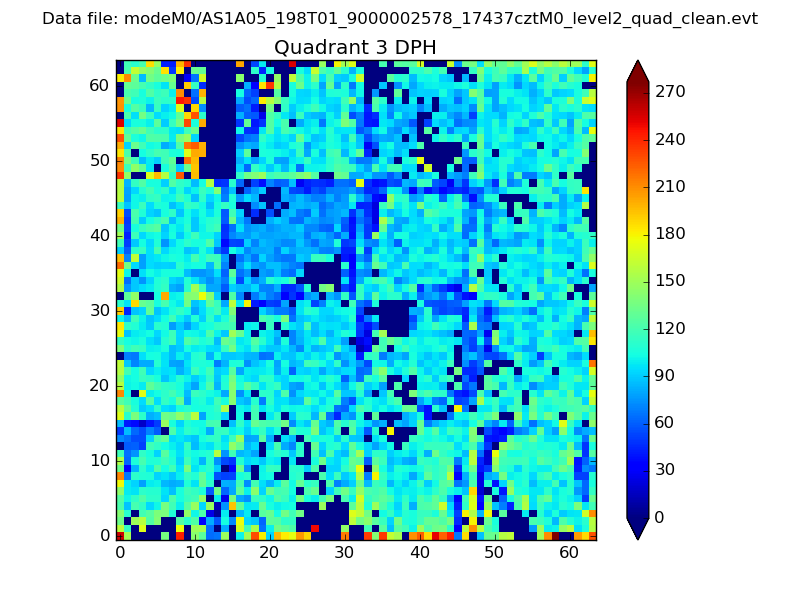 |
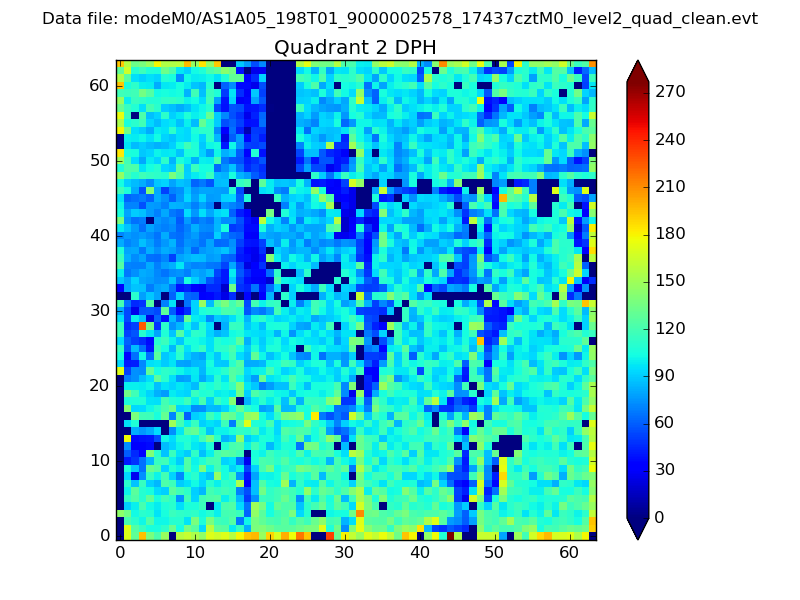 |
Quadrant C |
| Plot type | Count rate plots | Images |
|---|---|---|
| Comparison with Poisson distribution Blue bars denote a histogram of data divided into 1 sec bins. Red curve is a Poisson curve with rate = median count rate of data. |
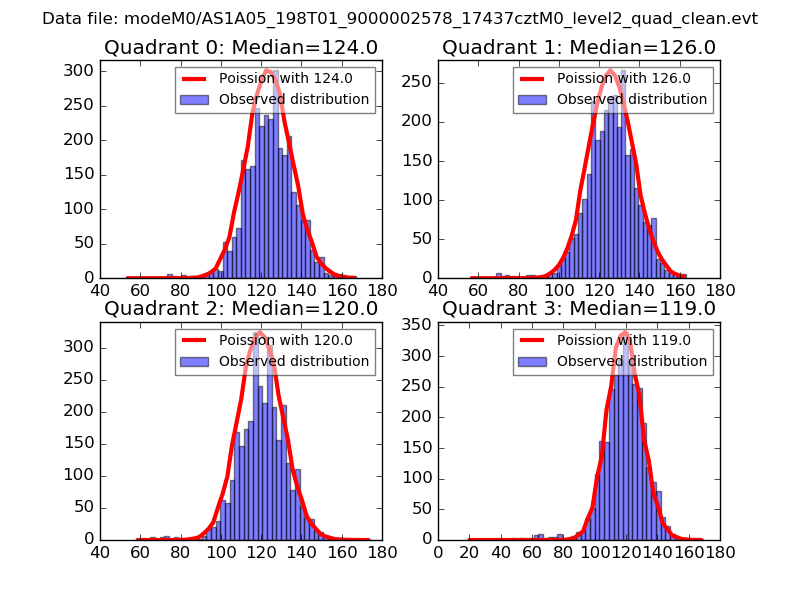 |
 |
| Quadrant-wise count rates Data is divided into 100 sec bins |
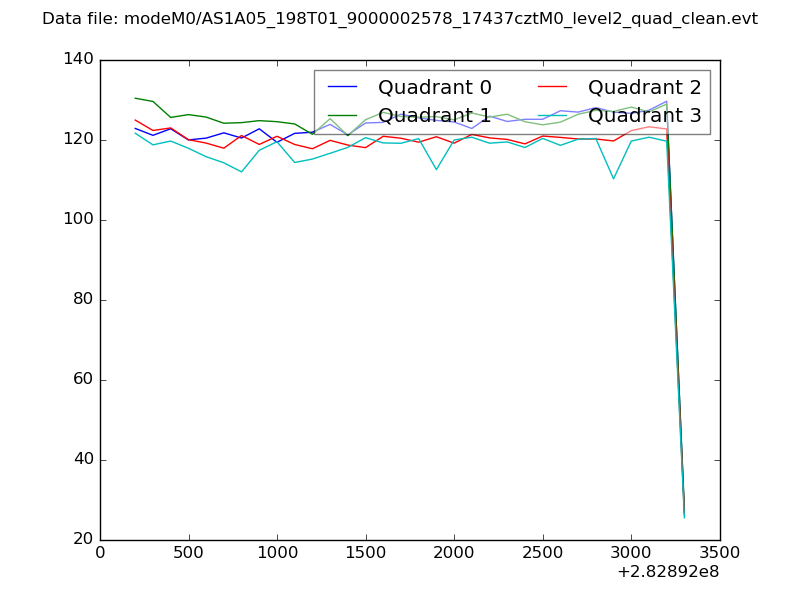 |
|
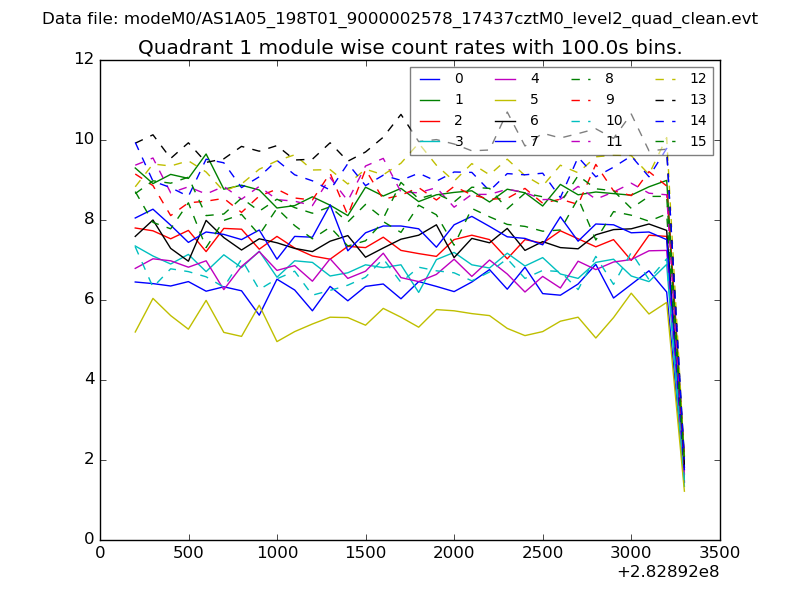
| Module-wise count rates for Quadrant A Data is divided into 100 sec bins |
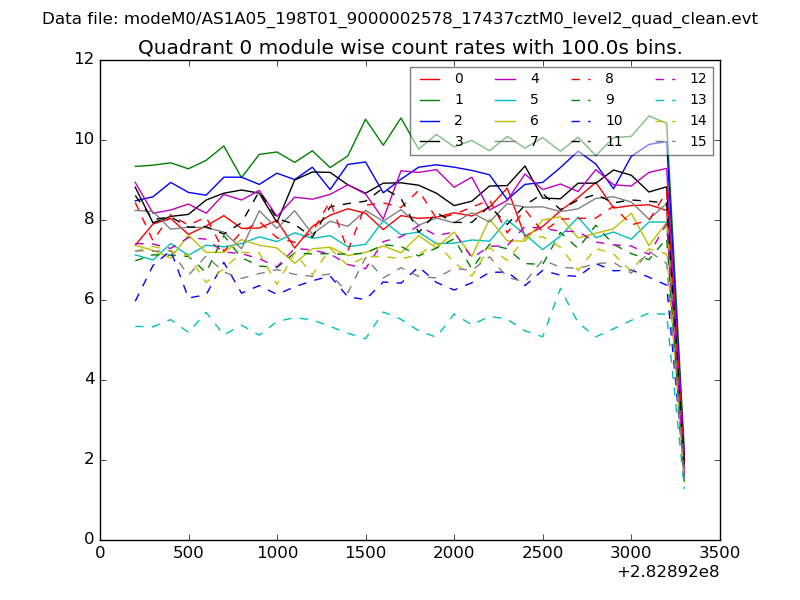 |
 |
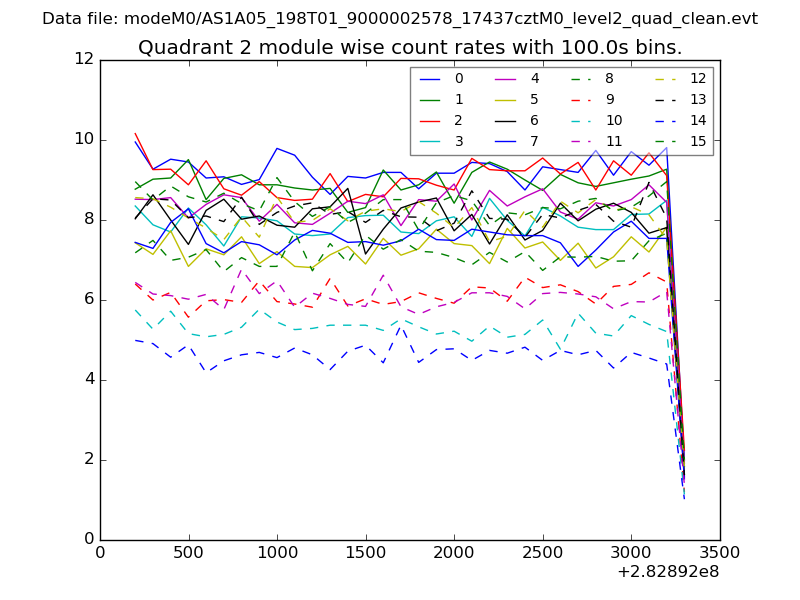
| Module-wise count rates for Quadrant B Data is divided into 100 sec bins |
 |
 |
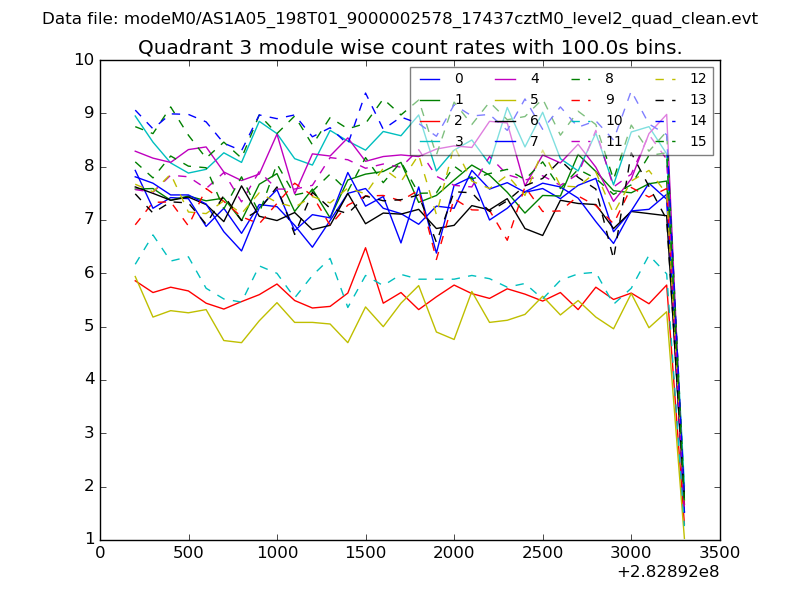
| Module-wise count rates for Quadrant C Data is divided into 100 sec bins |
 |
 |
| Module-wise count rates for Quadrant D Data is divided into 100 sec bins |
 |
 |
| Parameter | Plot |
|---|---|
| CZT HV Monitor | 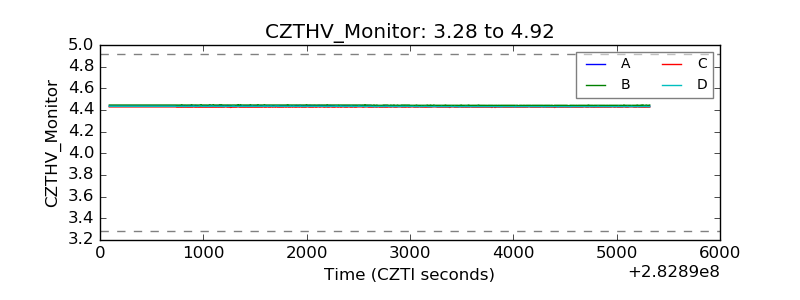 |
| D_VDD | 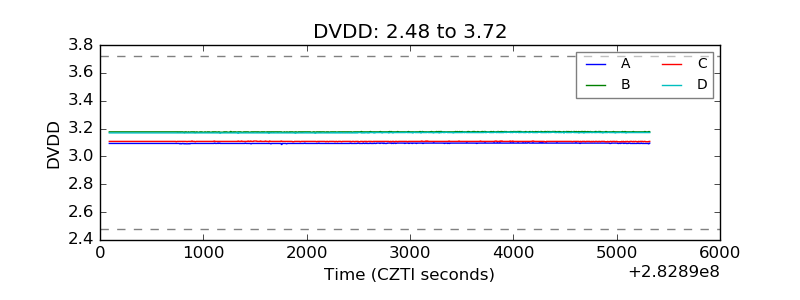 |
| Temperature 1 | 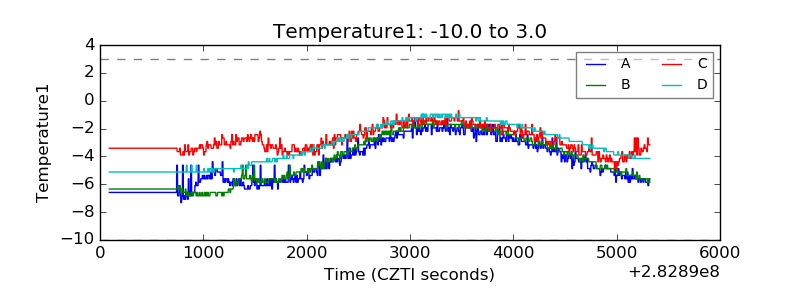 |
| Veto HV Monitor | 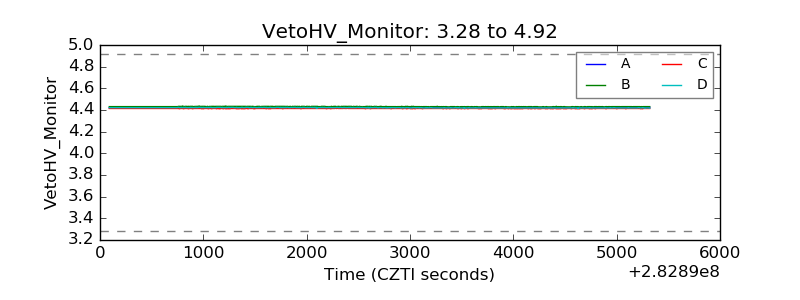 |
| Veto LLD | 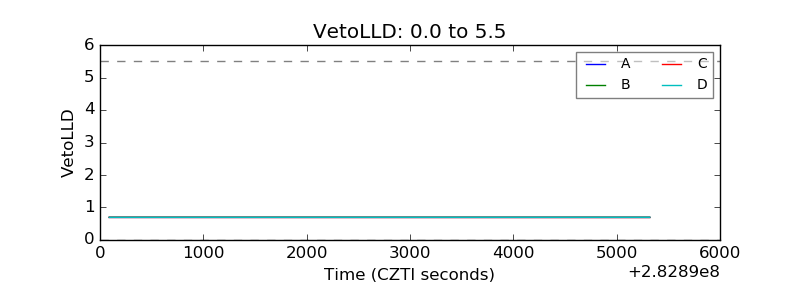 |
| Alpha Counter | 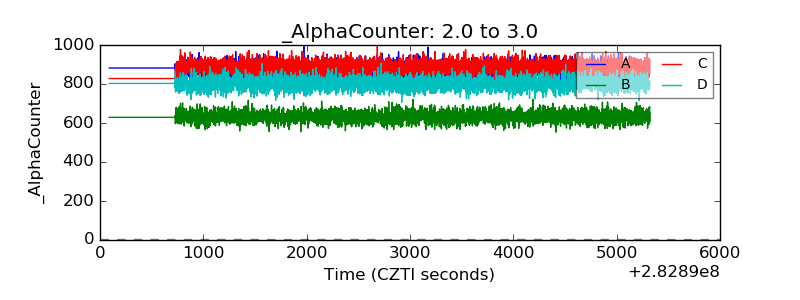 |
| _CPM_Rate | 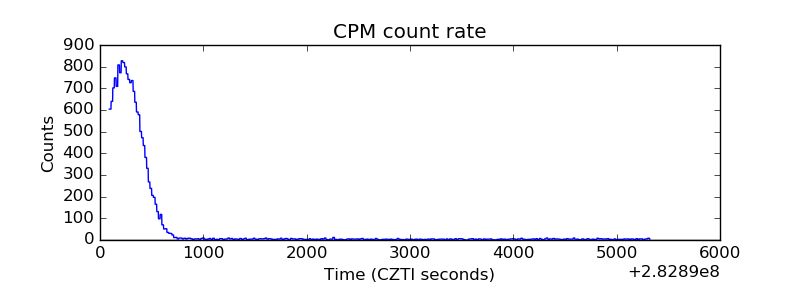 |
| CZT Counter |  |
| +2.5 Volts monitor |  |
| +5 Volts monitor | 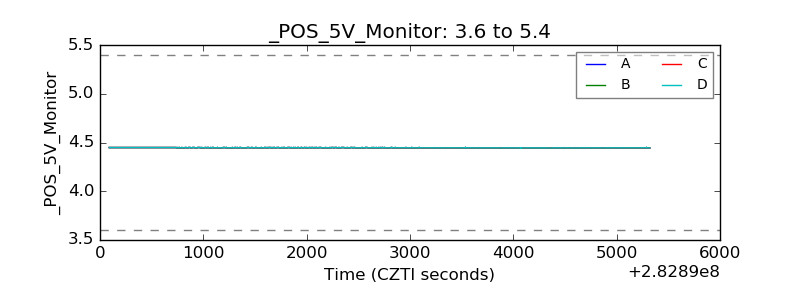 |
| _ROLL_ROT | 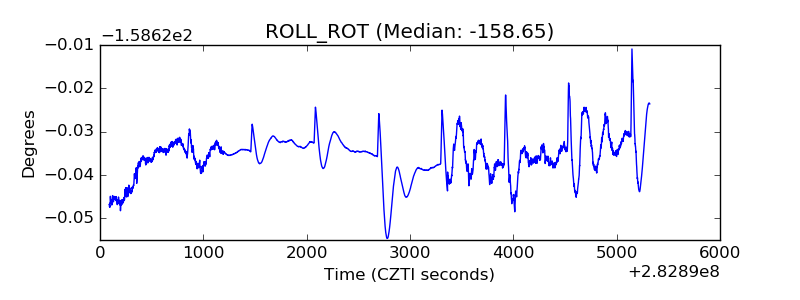 |
| _Roll_DEC | 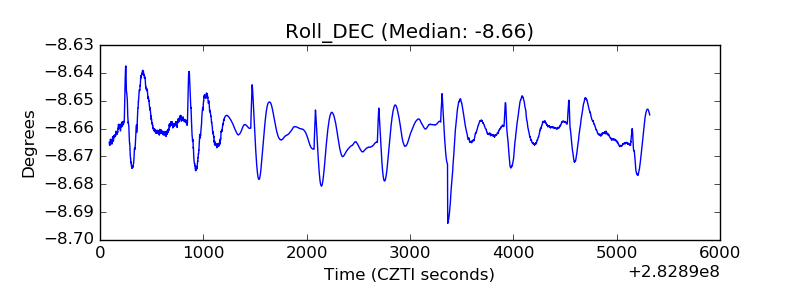 |
| _Roll_RA |  |
| Veto Counter | 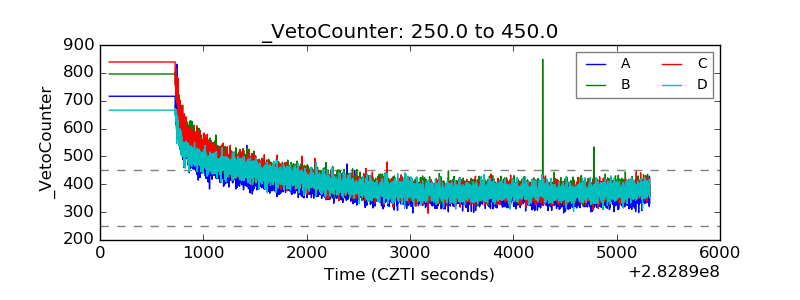 |