| Param | Original file | Final file |
|---|---|---|
| Filename | modeM0/AS1A05_068T01_9000002580cztM0_level2.fits | modeM0/AS1A05_068T01_9000002580cztM0_level2_quad_clean.evt |
| Size (bytes) | 459,264,960 | 405,190,080 |
| Size | 438.0 MB | 386.4 MB |
| Events in quadrant A | 2,876,336 | 2,439,520 |
| Events in quadrant B | 2,739,782 | 2,393,143 |
| Events in quadrant C | 2,806,756 | 2,276,254 |
| Events in quadrant D | 2,468,694 | 2,143,933 |
| Mode M0 | |||
|---|---|---|---|
| Quadrant | BADHDUFLAG | Total packets | Discarded packets |
| A | 0 | 93436 | 0 |
| B | 0 | 94931 | 0 |
| C | 0 | 97567 | 0 |
| D | 0 | 107118 | 0 |
| Mode SS | |||
|---|---|---|---|
| Quadrant | BADHDUFLAG | Total packets | Discarded packets |
| A | 0 | 894 | 0 |
| B | 0 | 894 | 0 |
| C | 0 | 894 | 0 |
| D | 0 | 894 | 0 |
| Mode M9 | |||
|---|---|---|---|
| Quadrant | BADHDUFLAG | Total packets | Discarded packets |
| A | 0 | 82 | 0 |
| B | 0 | 82 | 0 |
| C | 0 | 82 | 0 |
| D | 0 | 82 | 0 |
| Quadrant | Total seconds | Saturated seconds | Saturation percentage |
|---|---|---|---|
| A | 43965 | 509 | 1.157739% |
| B | 43965 | 675 | 1.535312% |
| C | 43965 | 798 | 1.815080% |
| D | 43965 | 885 | 2.012965% |
Noise dominated data is calculated using 1-second bins in cleaned event files. If a bin has >2000 counts, and if more than 50% of those come from <1% of pixels, then it is considered to be noise-dominated and hence unusable.
| Quadrant | # 1 sec bins | Bins with >0 counts | Bins with >2000 counts | High rate bins dominated by noise | Noise dominated (total time) | Noise dominated (detector-on time) | Marked lightcurve |
|---|---|---|---|---|---|---|---|
| A | 51924 | 43962 | 0 | 0 | 0.00% | 0.00% | 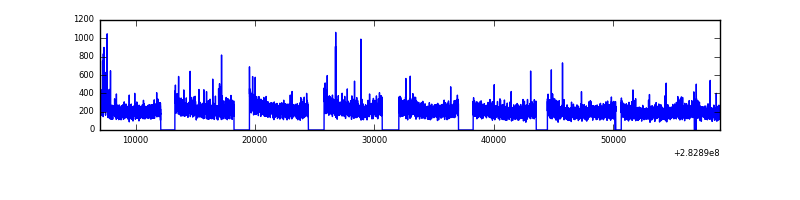 |
| B | 51924 | 43961 | 0 | 0 | 0.00% | 0.00% |  |
| C | 51924 | 43964 | 0 | 0 | 0.00% | 0.00% | 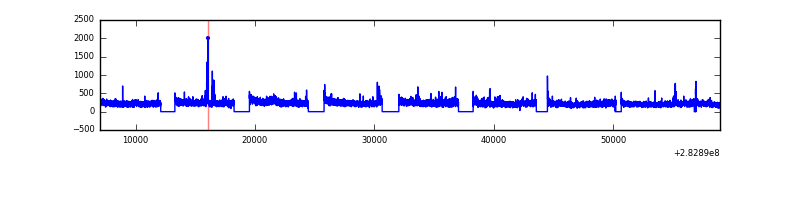 |
| D | 51924 | 43963 | 0 | 0 | 0.00% | 0.00% | 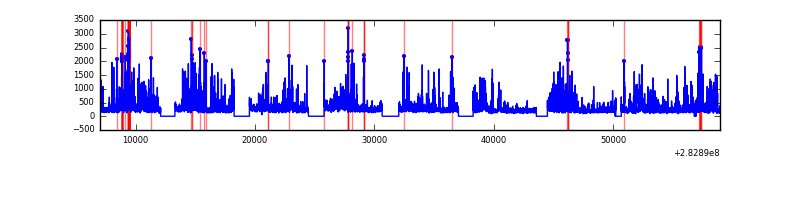 |
Top three noisy pixels from each quadrant. If the there are fewer than three noisy pixels in the level2.evt file, extra rows are filled as -1
| Pixel properties | Quadrant properties | ||||||
|---|---|---|---|---|---|---|---|
| Quadrant | DetID | PixID | Counts | Sigma | Mean | Median | Sigma |
| A | 0 | 29 | 2801 | 11.44 | 749 | 706 | 183.2 |
| A | 7 | 110 | 2300 | 8.7 | 749 | 706 | 183.2 |
| A | 0 | 30 | 2189 | 8.1 | 749 | 706 | 183.2 |
| B | 2 | 9 | 2136 | 10.0 | 725 | 694 | 144.1 |
| B | 2 | 8 | 1878 | 8.21 | 725 | 694 | 144.1 |
| B | 5 | 128 | 1776 | 7.51 | 725 | 694 | 144.1 |
| C | 1 | 81 | 2121 | 7.48 | 742 | 699 | 190.0 |
| C | 1 | 80 | 2114 | 7.45 | 742 | 699 | 190.0 |
| C | 3 | 126 | 1945 | 6.56 | 742 | 699 | 190.0 |
| D | 6 | 231 | 1766 | 6.04 | 705 | 647 | 185.3 |
| D | 15 | 46 | 1714 | 5.76 | 705 | 647 | 185.3 |
| D | 10 | 189 | 1712 | 5.75 | 705 | 647 | 185.3 |
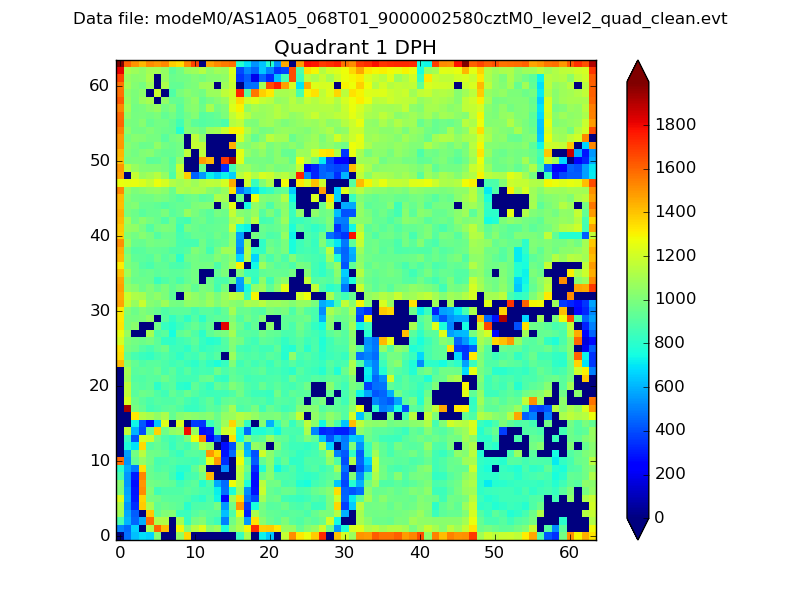
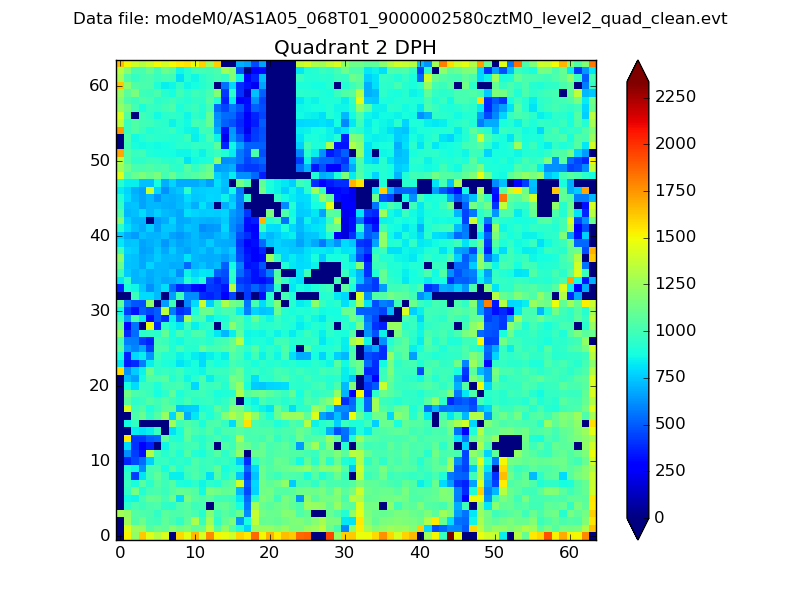
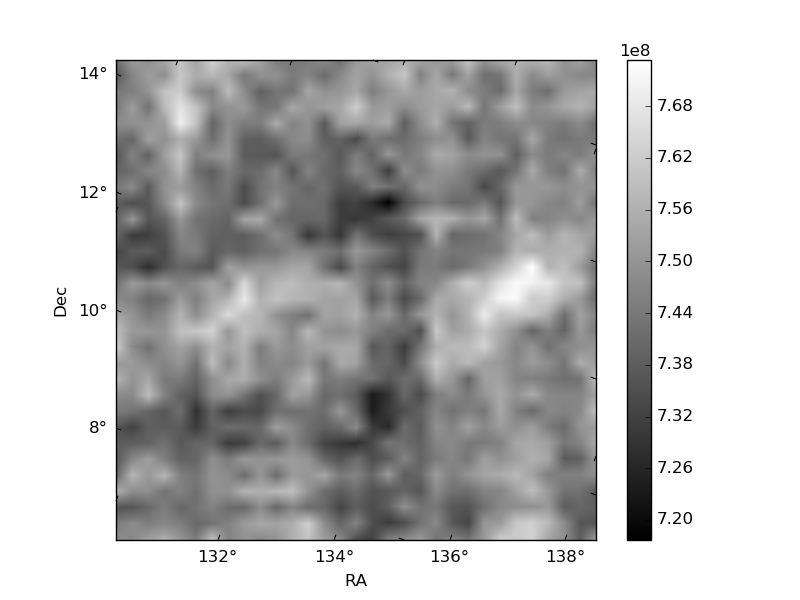
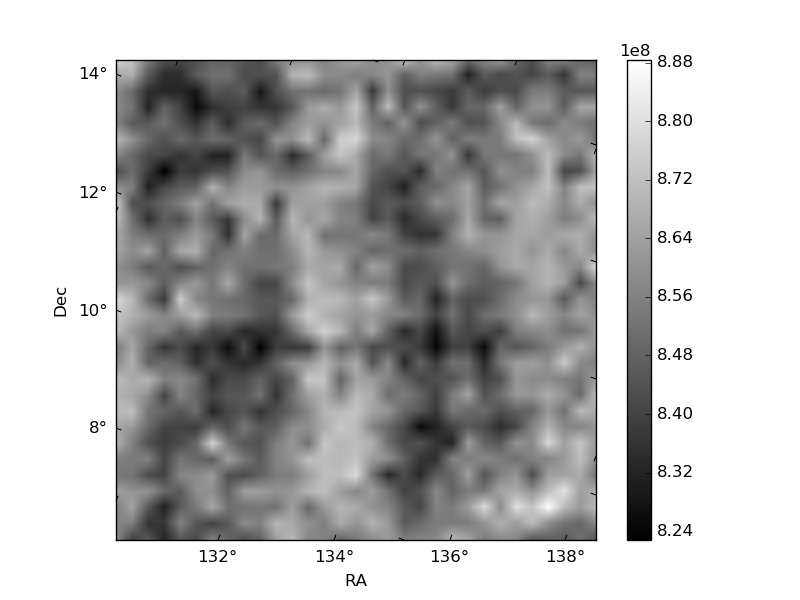
Histogram calculated using DETX and DETY for each event in the final _common_clean file
| Quadrant A | 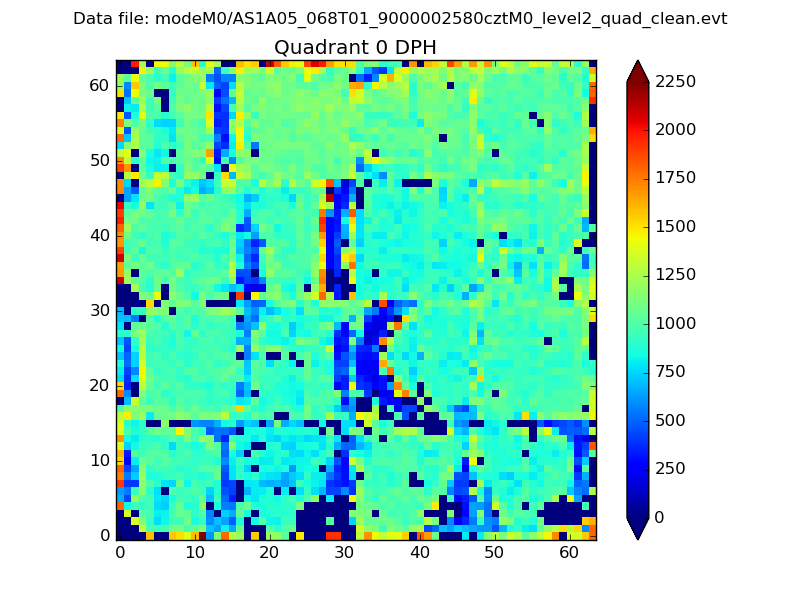 |
 |
Quadrant B |
|---|---|---|---|
| Quadrant D |  |
 |
Quadrant C |
| Plot type | Count rate plots | Images |
|---|---|---|
| Comparison with Poisson distribution Blue bars denote a histogram of data divided into 1 sec bins. Red curve is a Poisson curve with rate = median count rate of data. |
 |
 |
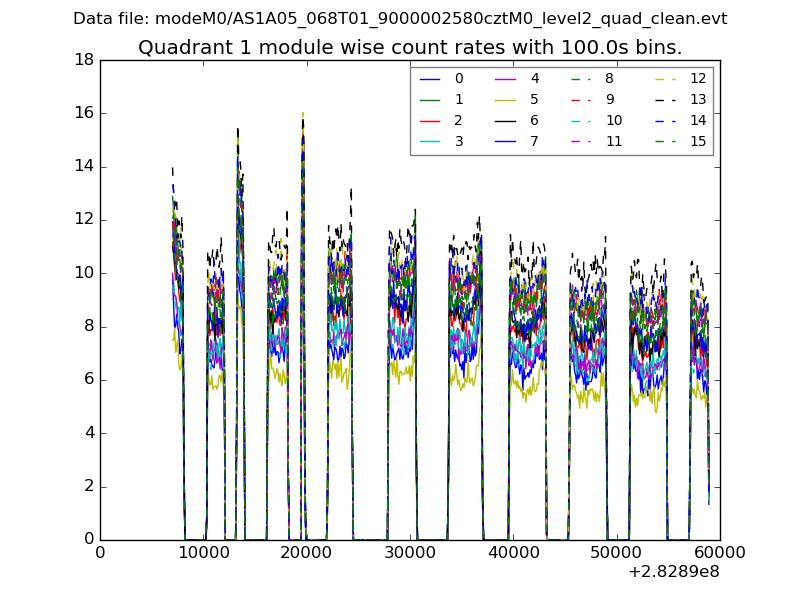
| Quadrant-wise count rates Data is divided into 100 sec bins |
 |
|
| Module-wise count rates for Quadrant A Data is divided into 100 sec bins |
 |
 |
| Module-wise count rates for Quadrant B Data is divided into 100 sec bins |
 |
 |
| Module-wise count rates for Quadrant C Data is divided into 100 sec bins |
 |
 |
| Module-wise count rates for Quadrant D Data is divided into 100 sec bins |
 |
 |
| Parameter | Plot |
|---|---|
| CZT HV Monitor |  |
| D_VDD |  |
| Temperature 1 |  |
| Veto HV Monitor |  |
| Veto LLD |  |
| Alpha Counter |  |
| _CPM_Rate |  |
| CZT Counter |  |
| +2.5 Volts monitor |  |
| +5 Volts monitor |  |
| _ROLL_ROT | 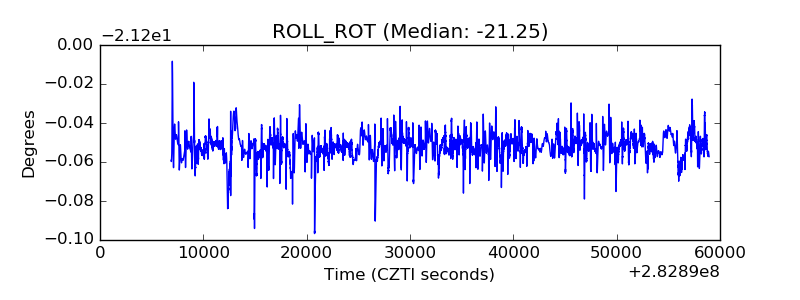 |
| _Roll_DEC |  |
| _Roll_RA |  |
| Veto Counter | 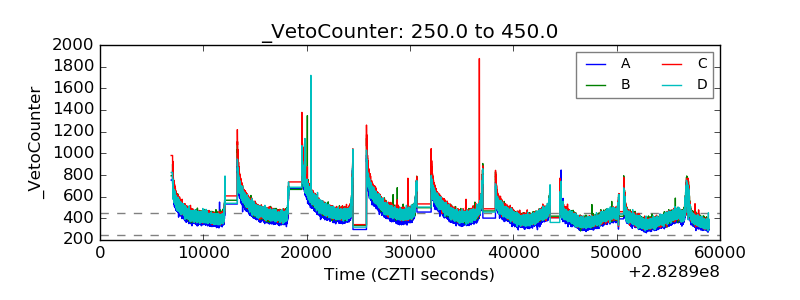 |