| Param | Original file | Final file |
|---|---|---|
| Filename | modeM0/AS1A05_068T01_9000002580_17444cztM0_level2.evt | modeM0/AS1A05_068T01_9000002580_17444cztM0_level2_quad_clean.evt |
| Size (bytes) | 487,368,000 | 85,400,640 |
| Size | 464.8 MB | 81.4 MB |
| Events in quadrant A | 3,336,900 | 541,559 |
| Events in quadrant B | 3,446,426 | 538,834 |
| Events in quadrant C | 3,599,715 | 519,195 |
| Events in quadrant D | 3,919,370 | 516,787 |
| Mode M0 | |||
|---|---|---|---|
| Quadrant | BADHDUFLAG | Total packets | Discarded packets |
| A | 0 | 14148 | 2 |
| B | 0 | 14426 | 2 |
| C | 0 | 14827 | 2 |
| D | 0 | 16235 | 2 |
| Mode SS | |||
|---|---|---|---|
| Quadrant | BADHDUFLAG | Total packets | Discarded packets |
| A | 0 | 138 | 0 |
| B | 0 | 138 | 0 |
| C | 0 | 138 | 0 |
| D | 0 | 138 | 0 |
| Mode M9 | |||
|---|---|---|---|
| Quadrant | BADHDUFLAG | Total packets | Discarded packets |
| A | 0 | 22 | 0 |
| B | 0 | 22 | 0 |
| C | 0 | 22 | 0 |
| D | 0 | 22 | 0 |
| Quadrant | Total seconds | Saturated seconds | Saturation percentage |
|---|---|---|---|
| A | 6741 | 77 | 1.142264% |
| B | 6741 | 94 | 1.394452% |
| C | 6740 | 151 | 2.240356% |
| D | 6740 | 139 | 2.062315% |
Noise dominated data is calculated using 1-second bins in cleaned event files. If a bin has >2000 counts, and if more than 50% of those come from <1% of pixels, then it is considered to be noise-dominated and hence unusable.
| Quadrant | # 1 sec bins | Bins with >0 counts | Bins with >2000 counts | High rate bins dominated by noise | Noise dominated (total time) | Noise dominated (detector-on time) | Marked lightcurve |
|---|---|---|---|---|---|---|---|
| A | 8906 | 6743 | 0 | 0 | 0.00% | 0.00% | 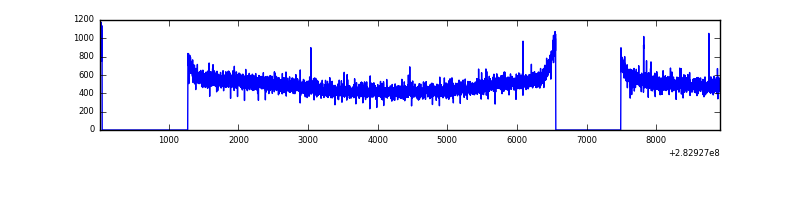 |
| B | 8906 | 6742 | 2 | 2 | 0.02% | 0.03% | 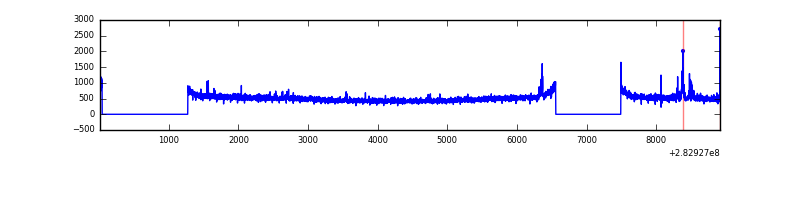 |
| C | 8905 | 6742 | 0 | 0 | 0.00% | 0.00% | 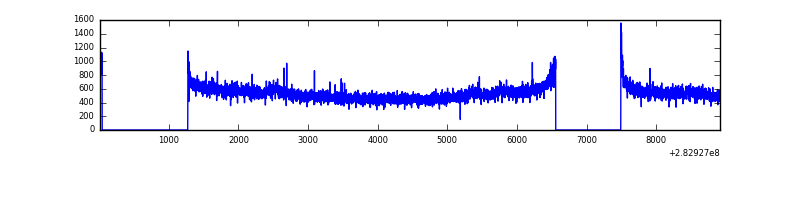 |
| D | 8905 | 6742 | 44 | 44 | 0.49% | 0.65% | 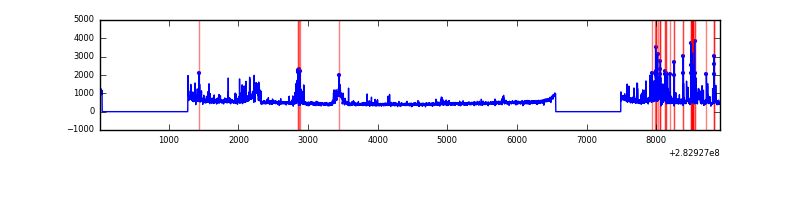 |
Top three noisy pixels from each quadrant. If the there are fewer than three noisy pixels in the level2.evt file, extra rows are filled as -1
| Pixel properties | Quadrant properties | ||||||
|---|---|---|---|---|---|---|---|
| Quadrant | DetID | PixID | Counts | Sigma | Mean | Median | Sigma |
| A | 0 | 226 | 7523 | 38.05 | 865 | 847 | 175.4 |
| A | 12 | 194 | 6435 | 31.85 | 865 | 847 | 175.4 |
| A | 3 | 137 | 6292 | 31.04 | 865 | 847 | 175.4 |
| B | 0 | 197 | 24712 | 145.47 | 860 | 839 | 164.1 |
| B | 12 | 111 | 19116 | 111.37 | 860 | 839 | 164.1 |
| B | 11 | 111 | 16208 | 93.65 | 860 | 839 | 164.1 |
| C | 3 | 233 | 163335 | 832.45 | 829 | 837 | 195.2 |
| C | 14 | 238 | 130227 | 662.84 | 829 | 837 | 195.2 |
| C | 5 | 218 | 65294 | 330.2 | 829 | 837 | 195.2 |
| D | 13 | 232 | 321120 | 1557.02 | 842 | 818 | 205.7 |
| D | 11 | 176 | 110206 | 531.74 | 842 | 818 | 205.7 |
| D | 10 | 70 | 88398 | 425.73 | 842 | 818 | 205.7 |
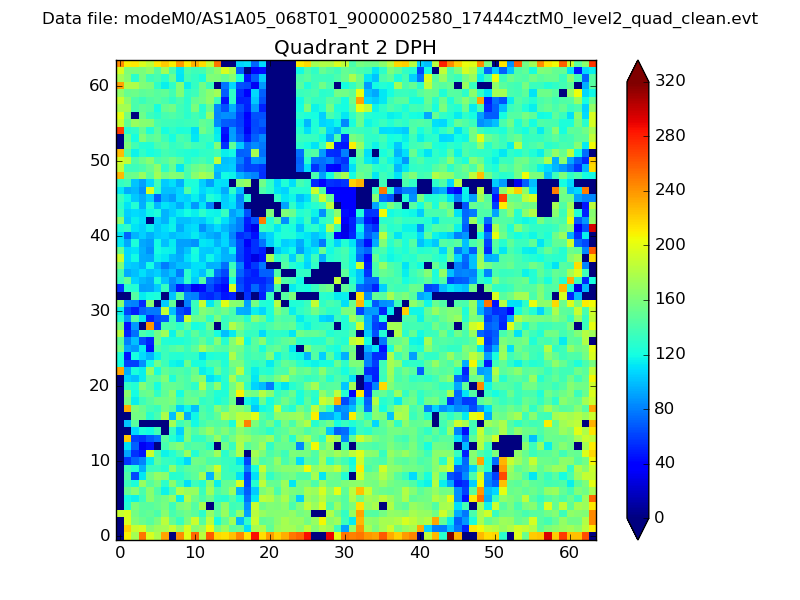
Histogram calculated using DETX and DETY for each event in the final _common_clean file
| Quadrant A | 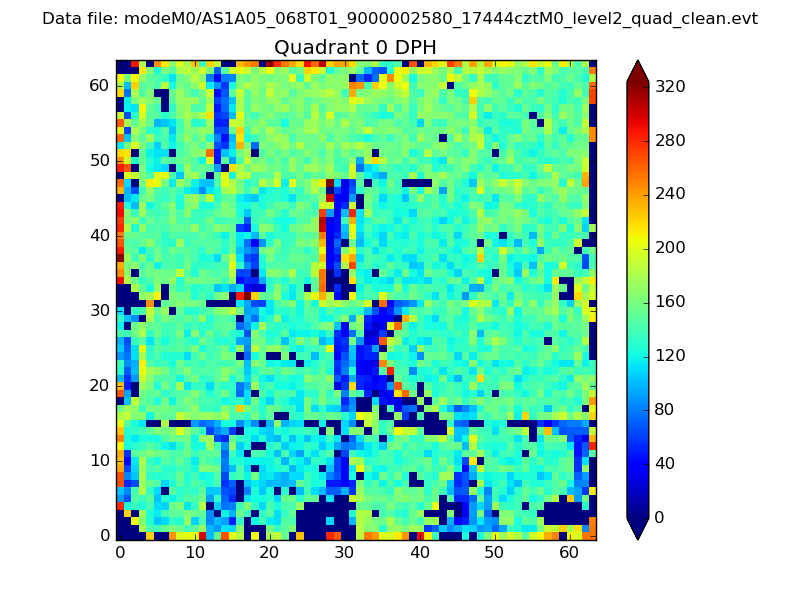 |
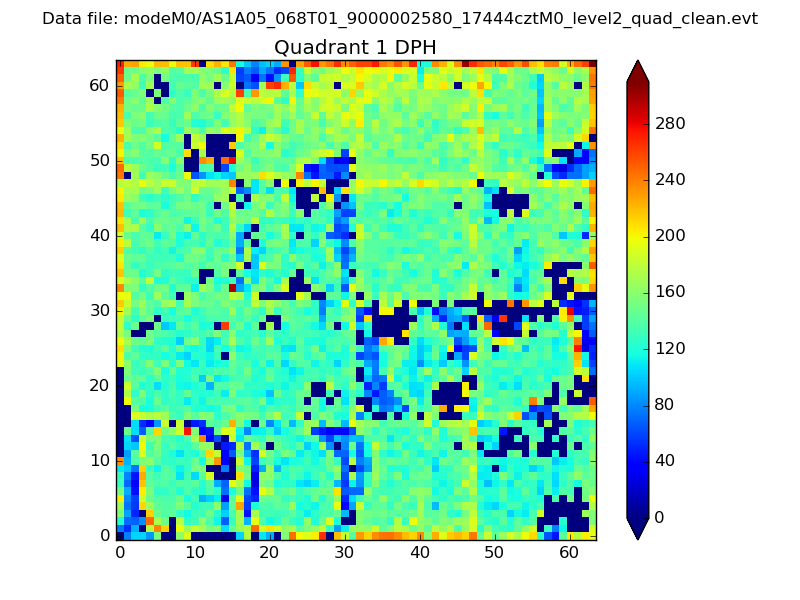 |
Quadrant B |
|---|---|---|---|
| Quadrant D | 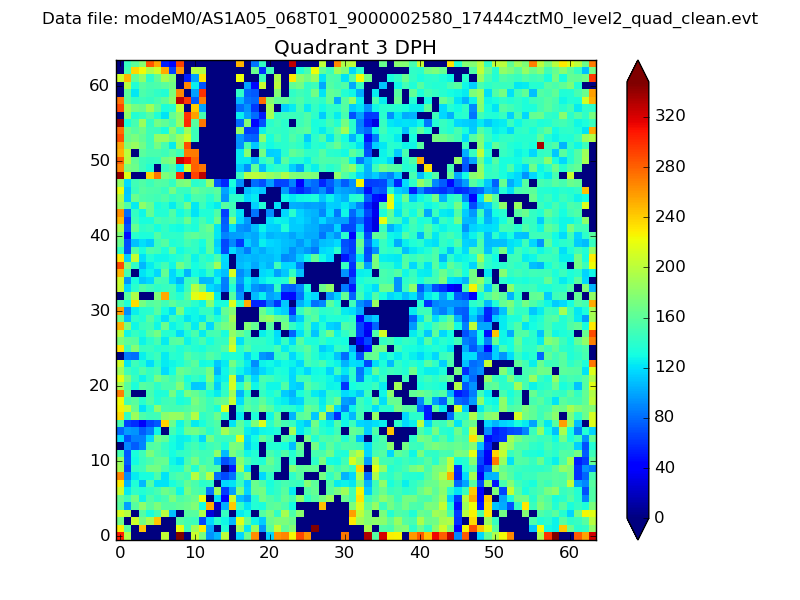 |
 |
Quadrant C |
| Plot type | Count rate plots | Images |
|---|---|---|
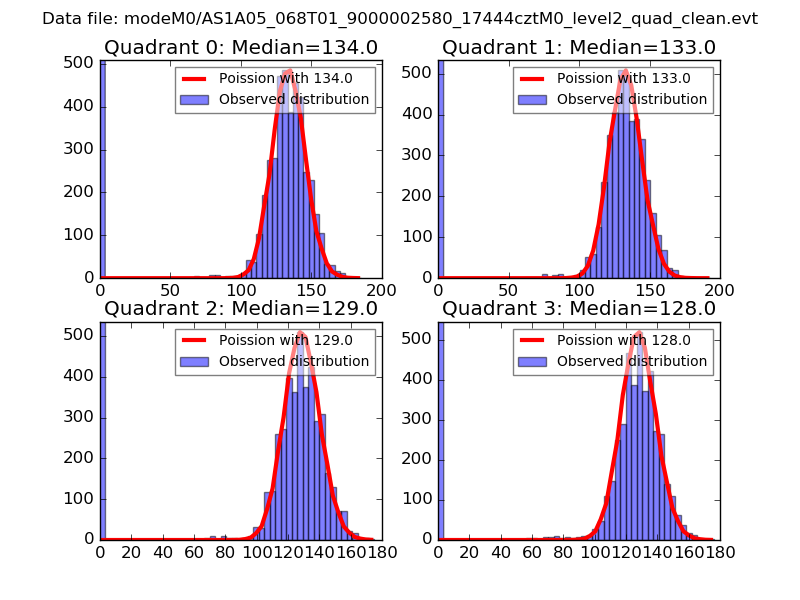
| Comparison with Poisson distribution Blue bars denote a histogram of data divided into 1 sec bins. Red curve is a Poisson curve with rate = median count rate of data. |
 |
 |
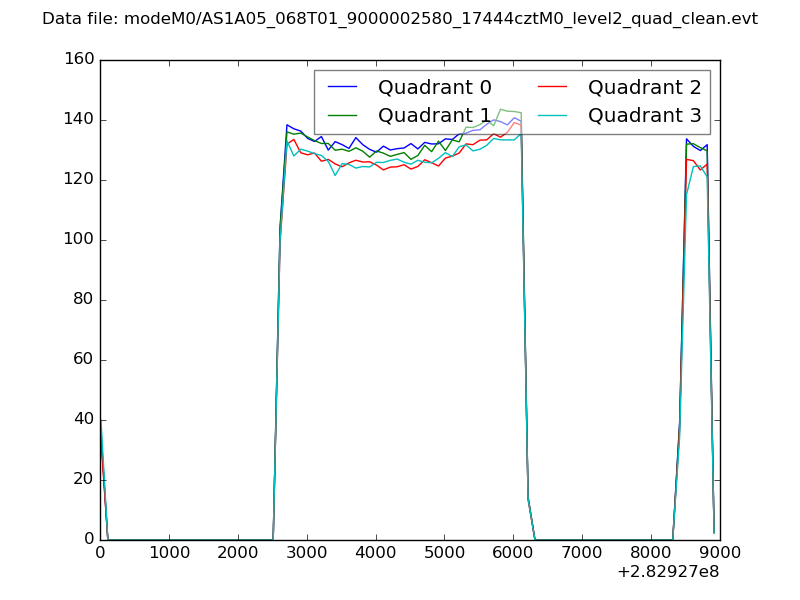
| Quadrant-wise count rates Data is divided into 100 sec bins |
 |
|
| Module-wise count rates for Quadrant A Data is divided into 100 sec bins |
 |
 |
| Module-wise count rates for Quadrant B Data is divided into 100 sec bins |
 |
 |
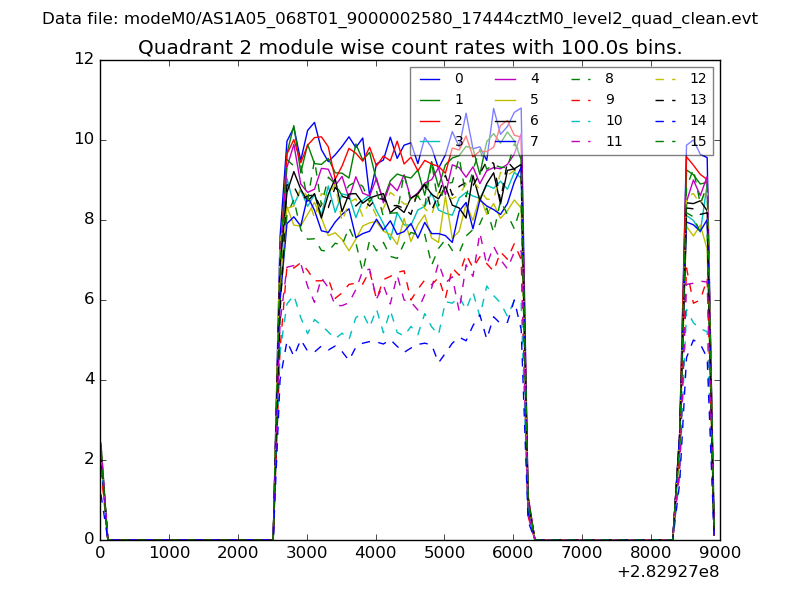
| Module-wise count rates for Quadrant C Data is divided into 100 sec bins |
 |
 |
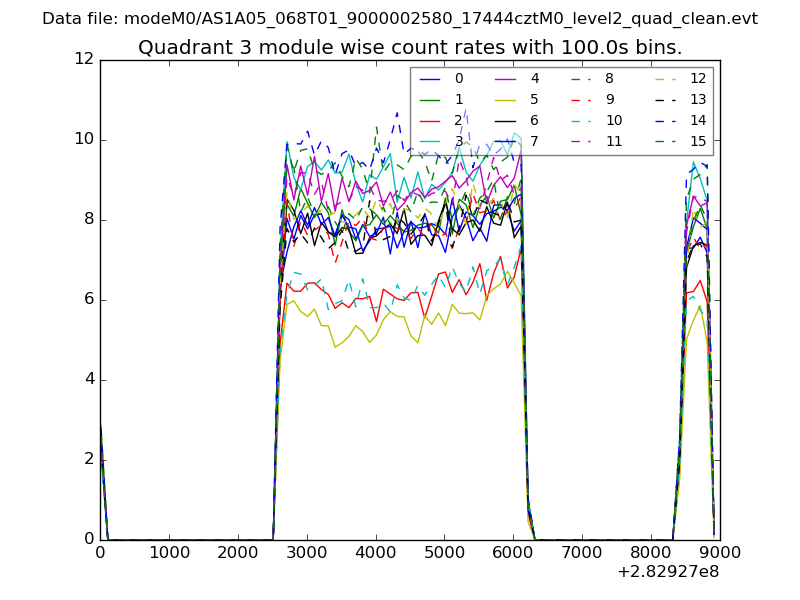
| Module-wise count rates for Quadrant D Data is divided into 100 sec bins |
 |
 |
| Parameter | Plot |
|---|---|
| CZT HV Monitor | 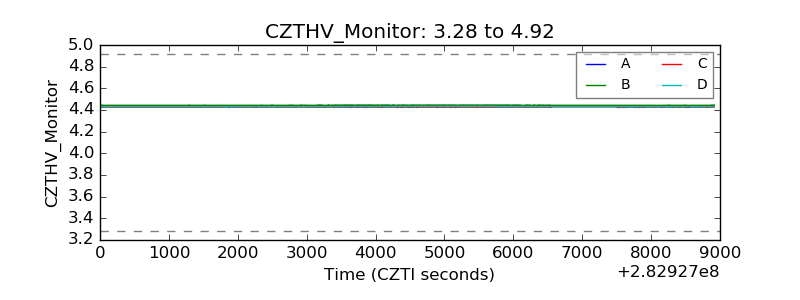 |
| D_VDD | 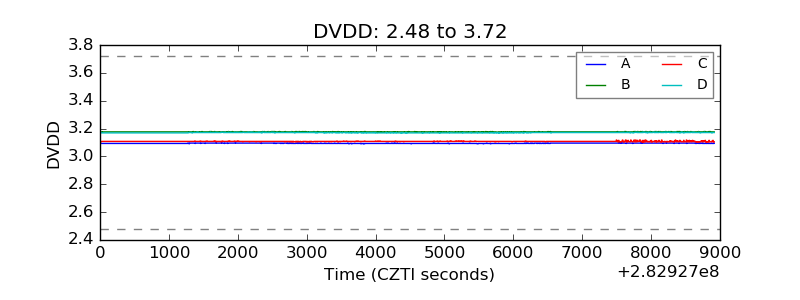 |
| Temperature 1 | 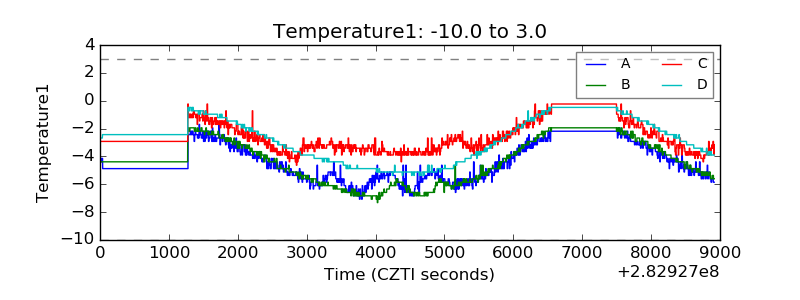 |
| Veto HV Monitor | 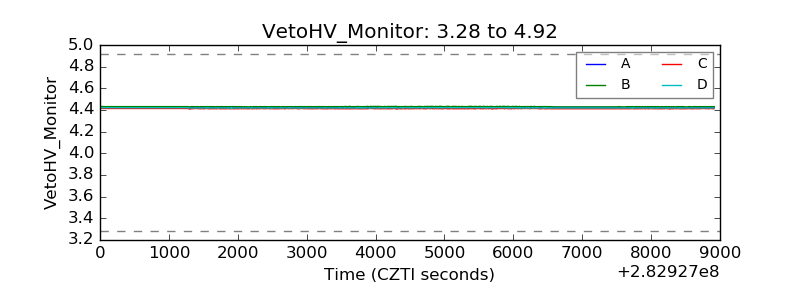 |
| Veto LLD | 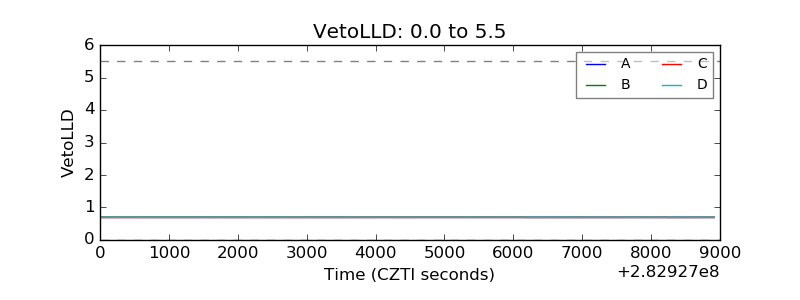 |
| Alpha Counter | 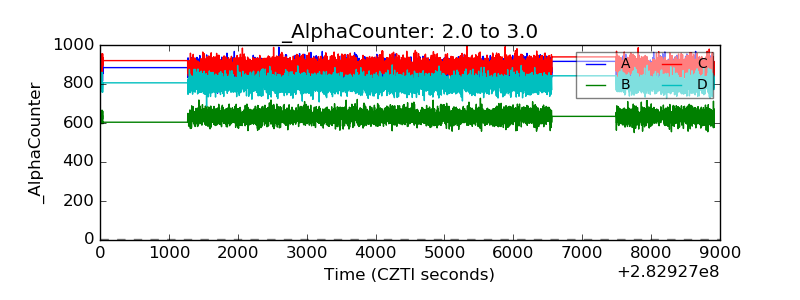 |
| _CPM_Rate | 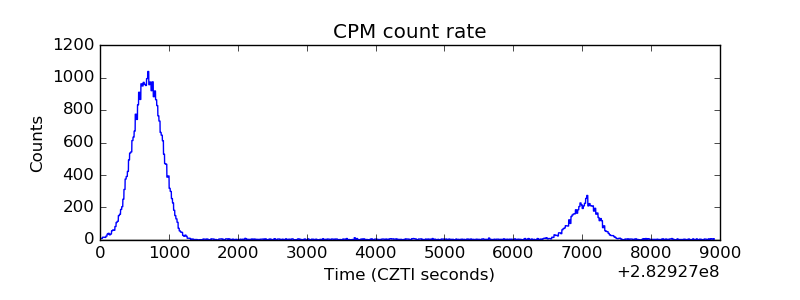 |
| CZT Counter | 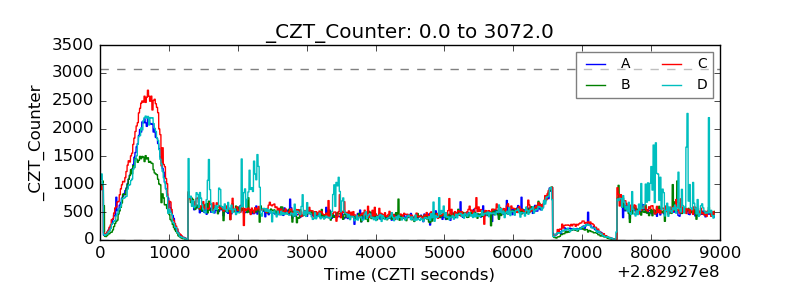 |
| +2.5 Volts monitor |  |
| +5 Volts monitor | 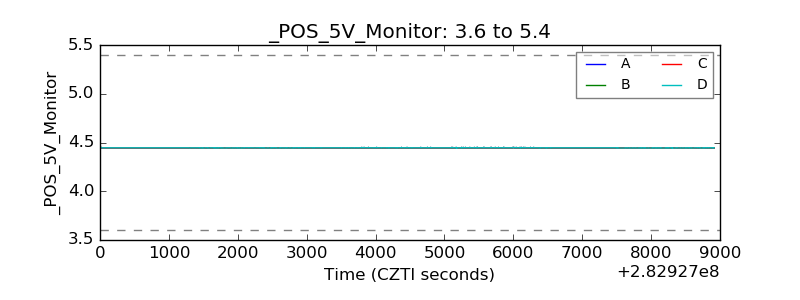 |
| _ROLL_ROT |  |
| _Roll_DEC | 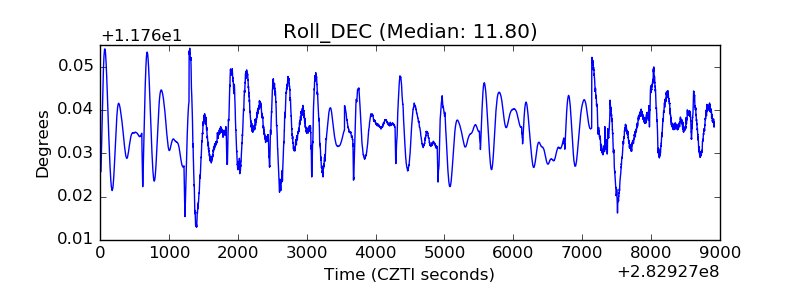 |
| _Roll_RA | 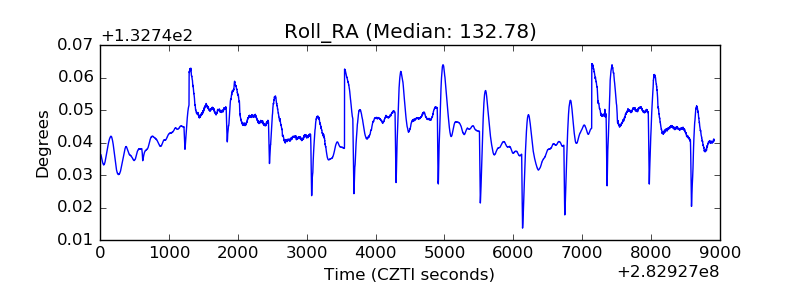 |
| Veto Counter |  |