| Param | Original file | Final file |
|---|---|---|
| Filename | modeM0/AS1A05_068T01_9000002580_17445cztM0_level2.evt | modeM0/AS1A05_068T01_9000002580_17445cztM0_level2_quad_clean.evt |
| Size (bytes) | 502,248,960 | 88,404,480 |
| Size | 479.0 MB | 84.3 MB |
| Events in quadrant A | 3,421,842 | 557,269 |
| Events in quadrant B | 3,561,986 | 556,908 |
| Events in quadrant C | 3,625,858 | 533,812 |
| Events in quadrant D | 4,115,838 | 531,807 |
| Mode M0 | |||
|---|---|---|---|
| Quadrant | BADHDUFLAG | Total packets | Discarded packets |
| A | 0 | 14790 | 3 |
| B | 0 | 15133 | 3 |
| C | 0 | 15149 | 3 |
| D | 0 | 17048 | 3 |
| Mode SS | |||
|---|---|---|---|
| Quadrant | BADHDUFLAG | Total packets | Discarded packets |
| A | 0 | 146 | 0 |
| B | 0 | 146 | 0 |
| C | 0 | 146 | 0 |
| D | 0 | 146 | 0 |
| Mode M9 | |||
|---|---|---|---|
| Quadrant | BADHDUFLAG | Total packets | Discarded packets |
| A | 0 | 8 | 0 |
| B | 0 | 9 | 0 |
| C | 0 | 9 | 0 |
| D | 0 | 9 | 0 |
| Quadrant | Total seconds | Saturated seconds | Saturation percentage |
|---|---|---|---|
| A | 7137 | 43 | 0.602494% |
| B | 7137 | 117 | 1.639344% |
| C | 7137 | 121 | 1.695390% |
| D | 7137 | 121 | 1.695390% |
Noise dominated data is calculated using 1-second bins in cleaned event files. If a bin has >2000 counts, and if more than 50% of those come from <1% of pixels, then it is considered to be noise-dominated and hence unusable.
| Quadrant | # 1 sec bins | Bins with >0 counts | Bins with >2000 counts | High rate bins dominated by noise | Noise dominated (total time) | Noise dominated (detector-on time) | Marked lightcurve |
|---|---|---|---|---|---|---|---|
| A | 7617 | 7139 | 0 | 0 | 0.00% | 0.00% | 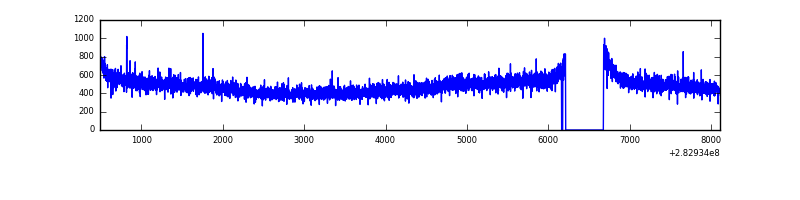 |
| B | 7617 | 7139 | 3 | 3 | 0.04% | 0.04% | 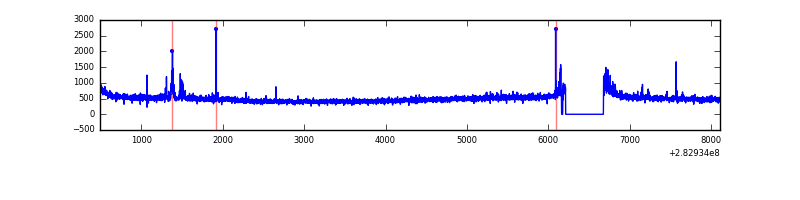 |
| C | 7617 | 7139 | 0 | 0 | 0.00% | 0.00% | 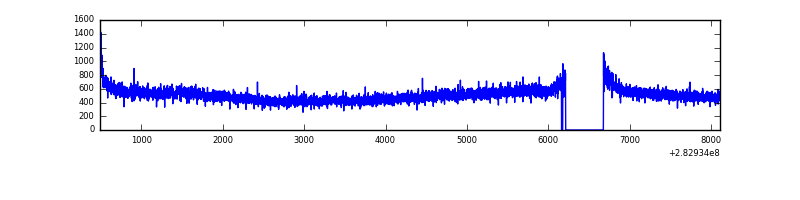 |
| D | 7617 | 7139 | 60 | 60 | 0.79% | 0.84% | 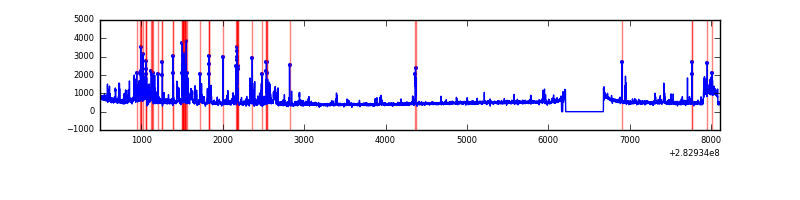 |
Top three noisy pixels from each quadrant. If the there are fewer than three noisy pixels in the level2.evt file, extra rows are filled as -1
| Pixel properties | Quadrant properties | ||||||
|---|---|---|---|---|---|---|---|
| Quadrant | DetID | PixID | Counts | Sigma | Mean | Median | Sigma |
| A | 0 | 226 | 7766 | 38.08 | 888 | 871 | 181.1 |
| A | 12 | 194 | 6579 | 31.53 | 888 | 871 | 181.1 |
| A | 3 | 137 | 6473 | 30.94 | 888 | 871 | 181.1 |
| B | 7 | 220 | 26861 | 153.47 | 882 | 861 | 169.4 |
| B | 0 | 197 | 26251 | 149.87 | 882 | 861 | 169.4 |
| B | 12 | 111 | 20001 | 112.98 | 882 | 861 | 169.4 |
| C | 14 | 238 | 131050 | 655.95 | 847 | 854 | 198.5 |
| C | 5 | 218 | 87910 | 438.61 | 847 | 854 | 198.5 |
| C | 3 | 233 | 77856 | 387.95 | 847 | 854 | 198.5 |
| D | 13 | 232 | 371452 | 1766.78 | 860 | 835 | 209.8 |
| D | 13 | 189 | 327948 | 1559.39 | 860 | 835 | 209.8 |
| D | 2 | 234 | 31049 | 144.03 | 860 | 835 | 209.8 |
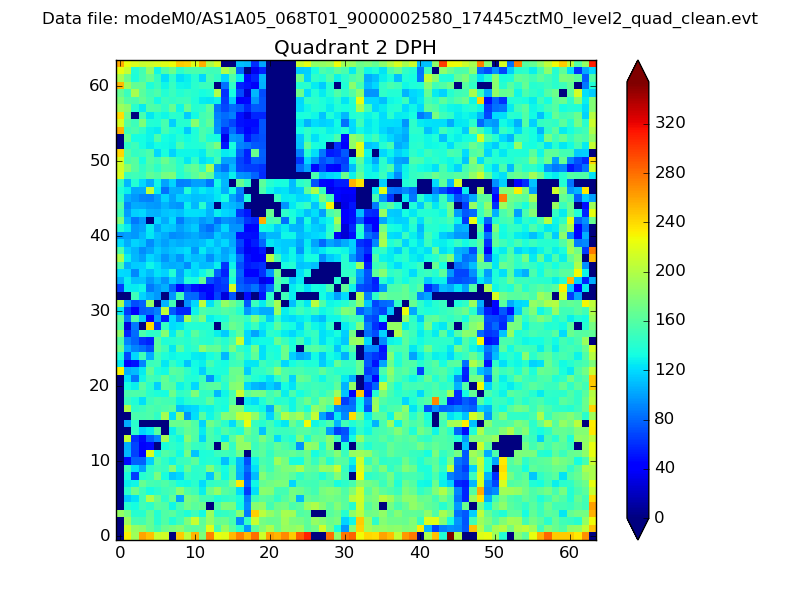
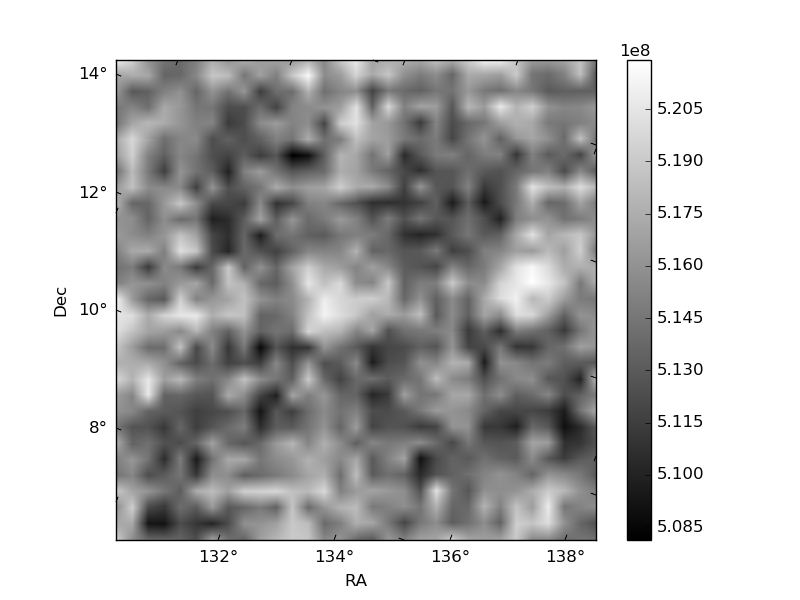
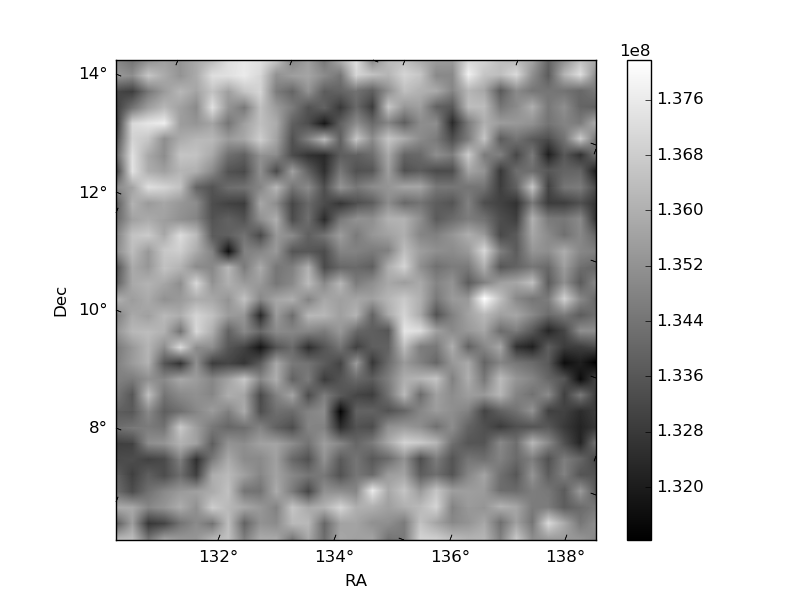
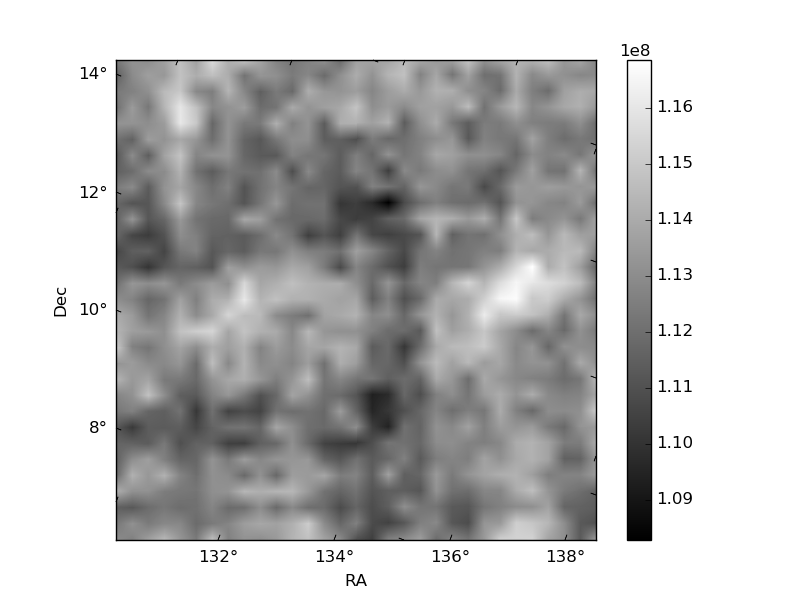
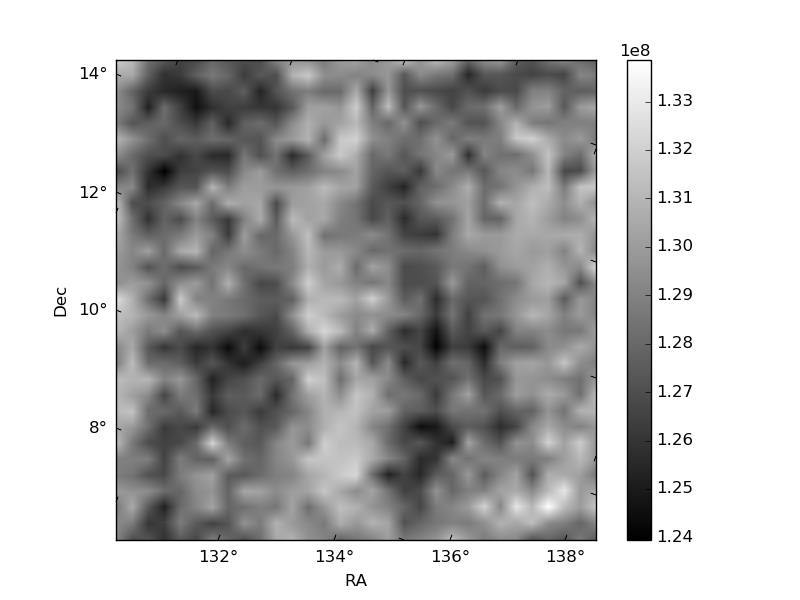
Histogram calculated using DETX and DETY for each event in the final _common_clean file
| Quadrant A | 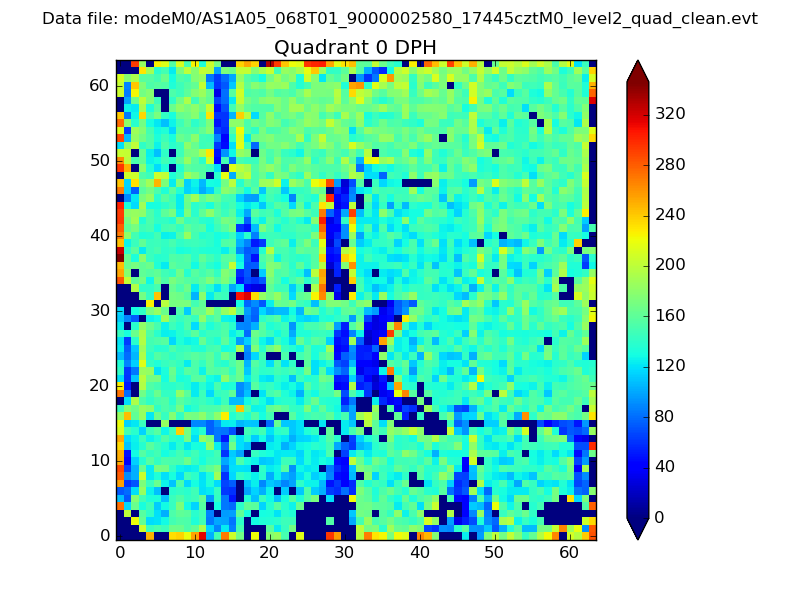 |
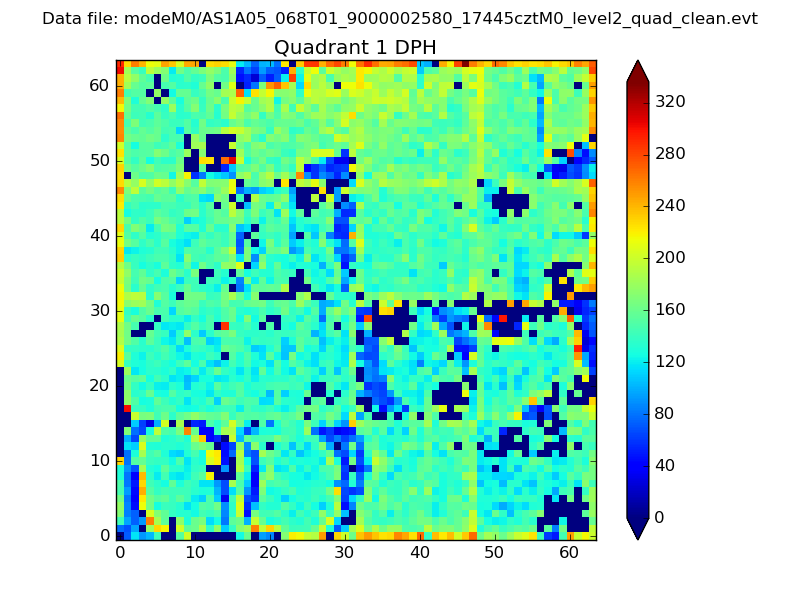 |
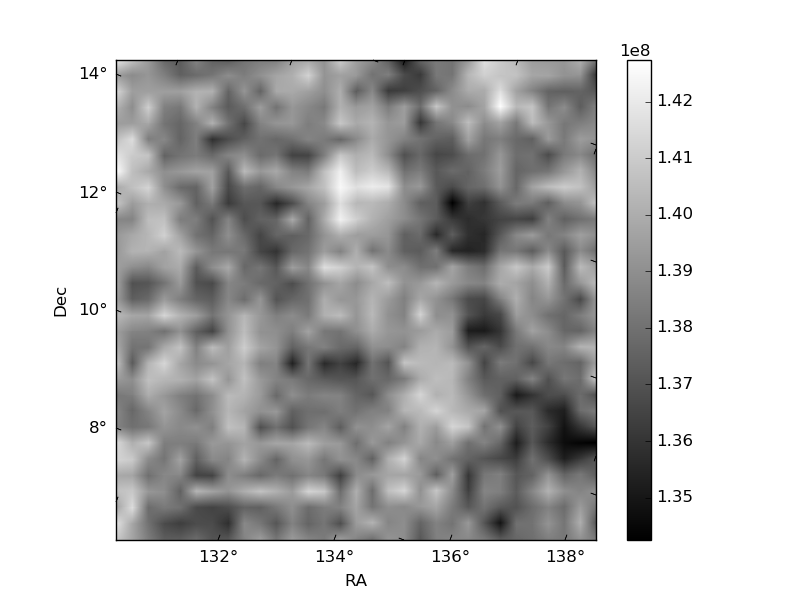
Quadrant B |
|---|---|---|---|
| Quadrant D | 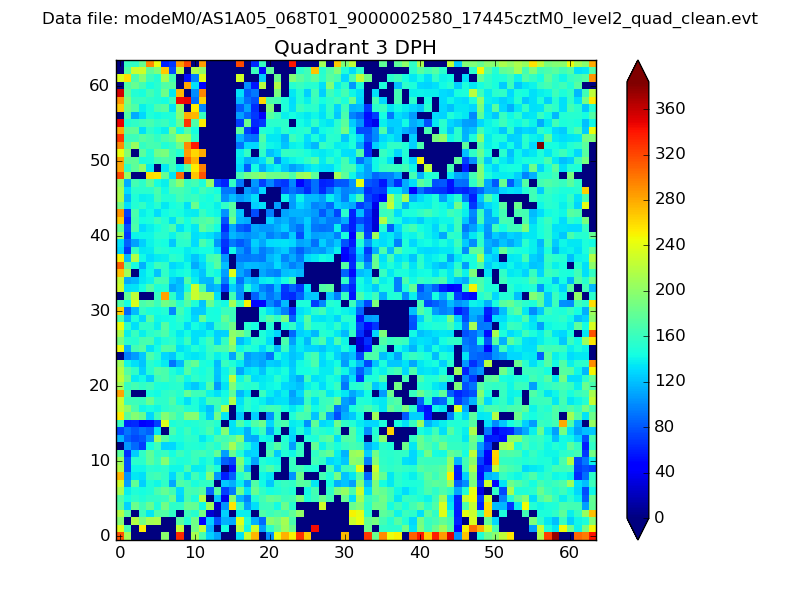 |
 |
Quadrant C |
| Plot type | Count rate plots | Images |
|---|---|---|
| Comparison with Poisson distribution Blue bars denote a histogram of data divided into 1 sec bins. Red curve is a Poisson curve with rate = median count rate of data. |
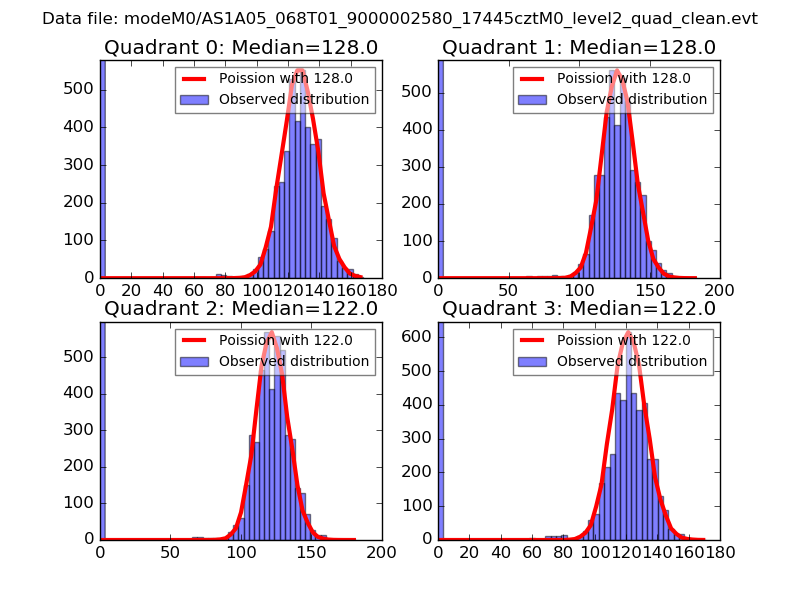 |
 |
| Quadrant-wise count rates Data is divided into 100 sec bins |
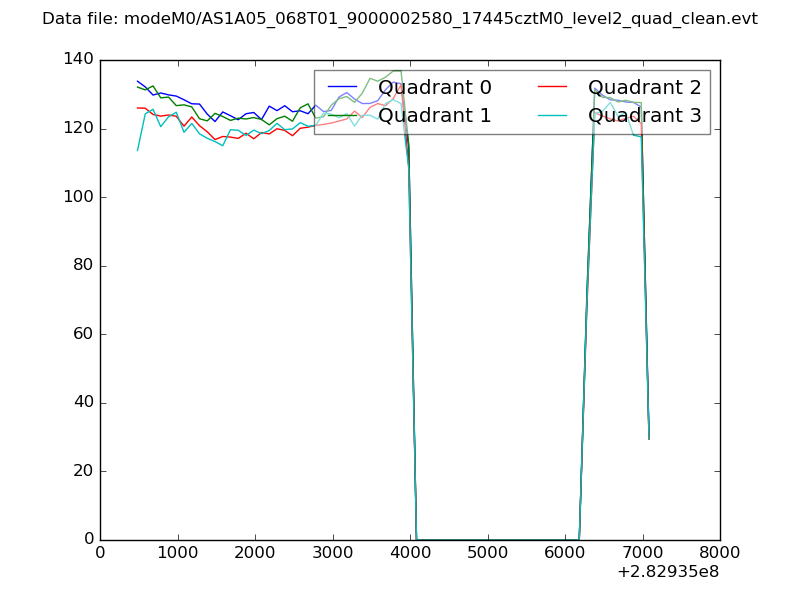 |
|
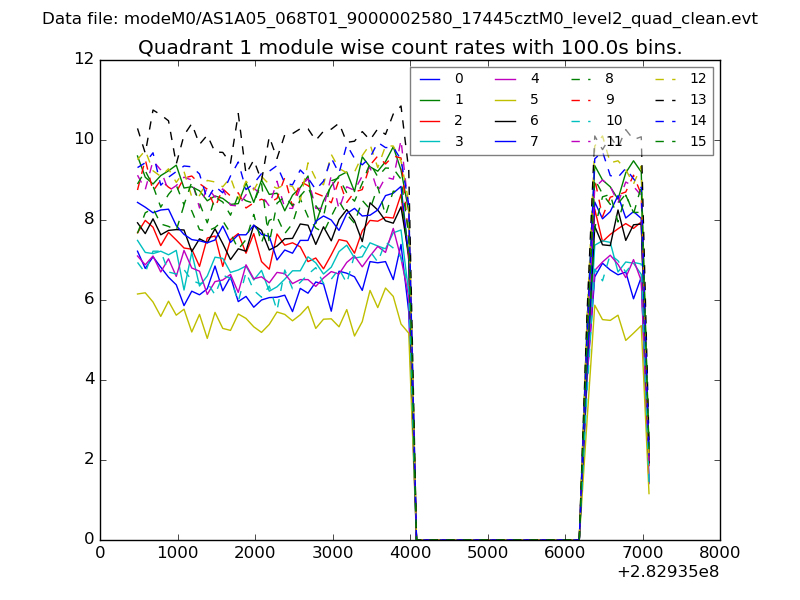
| Module-wise count rates for Quadrant A Data is divided into 100 sec bins |
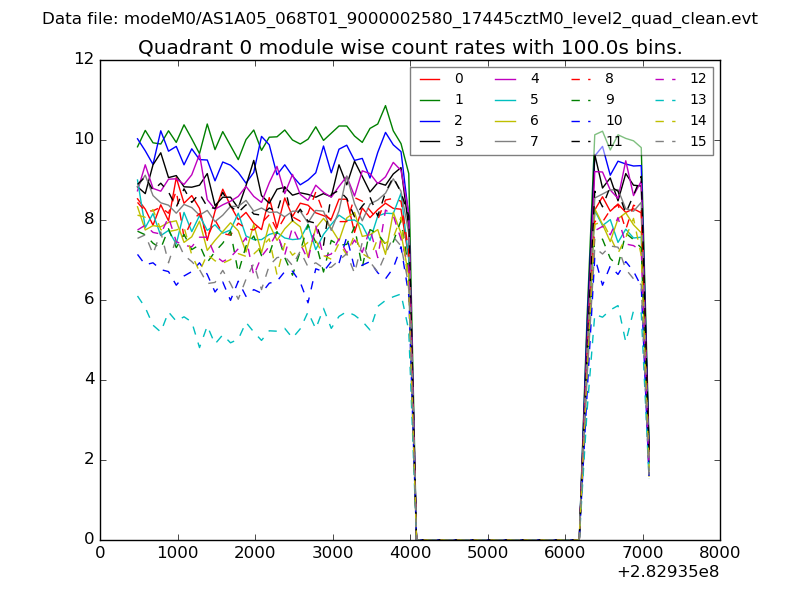 |
 |
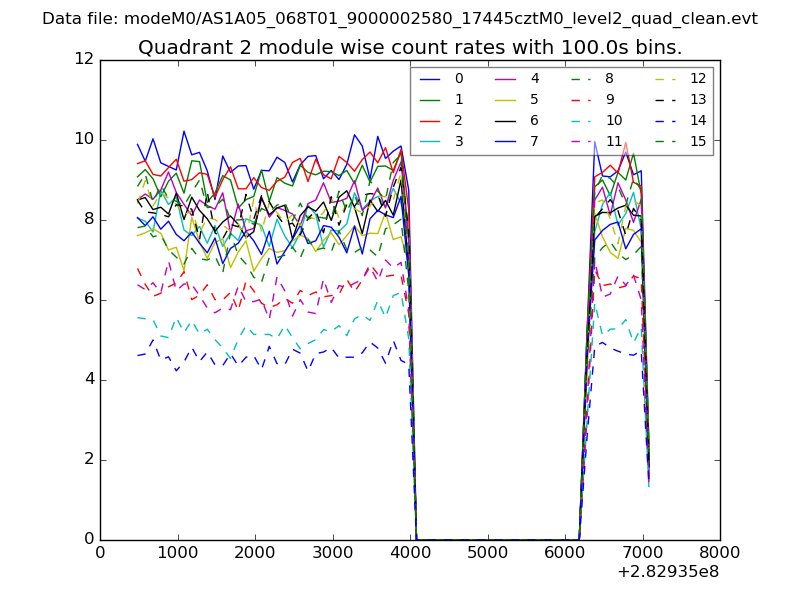
| Module-wise count rates for Quadrant B Data is divided into 100 sec bins |
 |
 |
| Module-wise count rates for Quadrant C Data is divided into 100 sec bins |
 |
 |
| Module-wise count rates for Quadrant D Data is divided into 100 sec bins |
 |
 |
| Parameter | Plot |
|---|---|
| CZT HV Monitor | 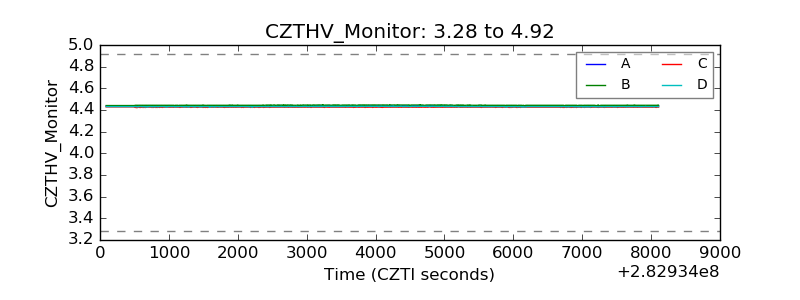 |
| D_VDD | 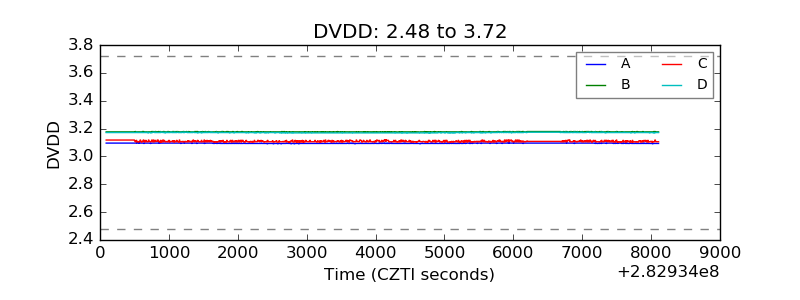 |
| Temperature 1 | 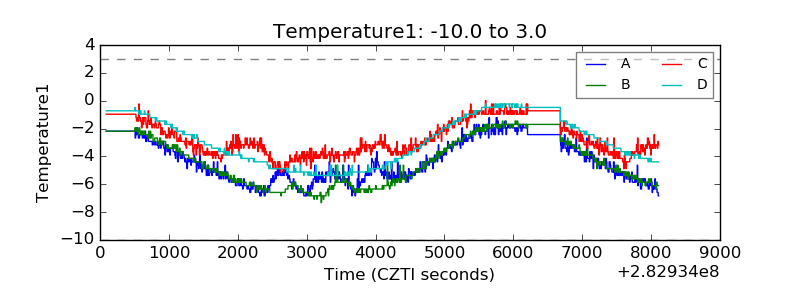 |
| Veto HV Monitor |  |
| Veto LLD | 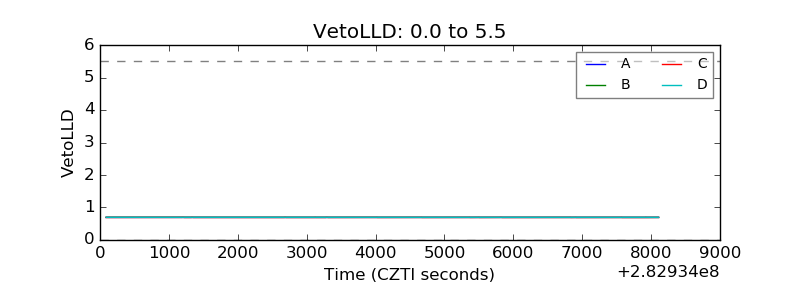 |
| Alpha Counter | 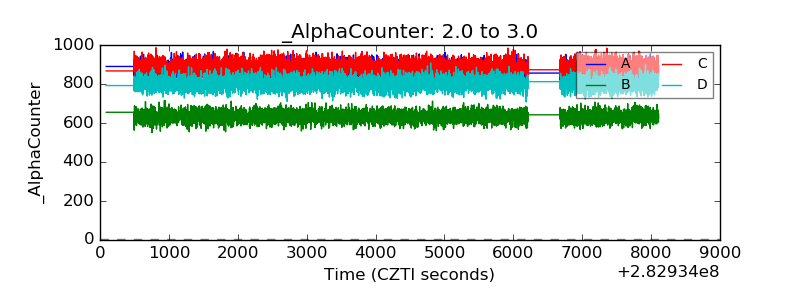 |
| _CPM_Rate | 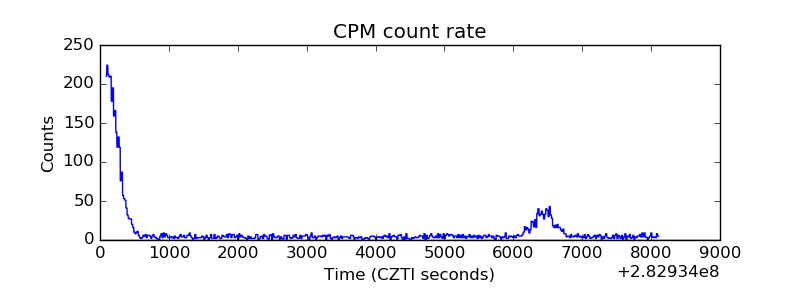 |
| CZT Counter | 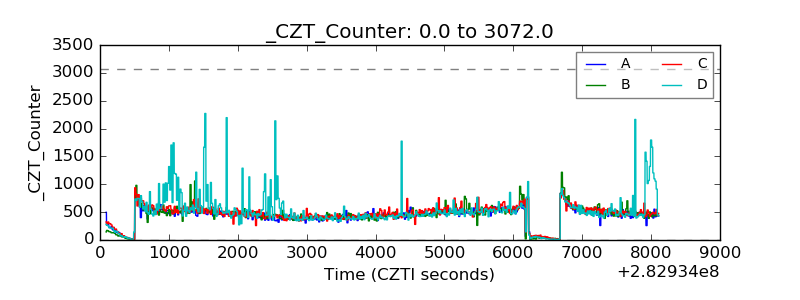 |
| +2.5 Volts monitor |  |
| +5 Volts monitor |  |
| _ROLL_ROT | 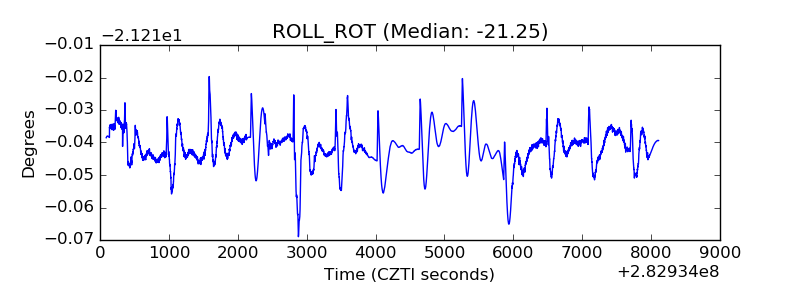 |
| _Roll_DEC | 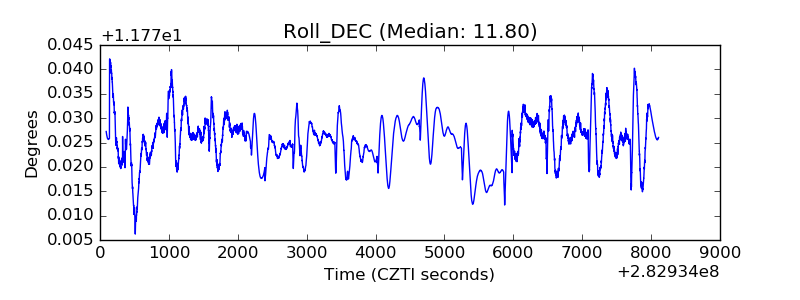 |
| _Roll_RA | 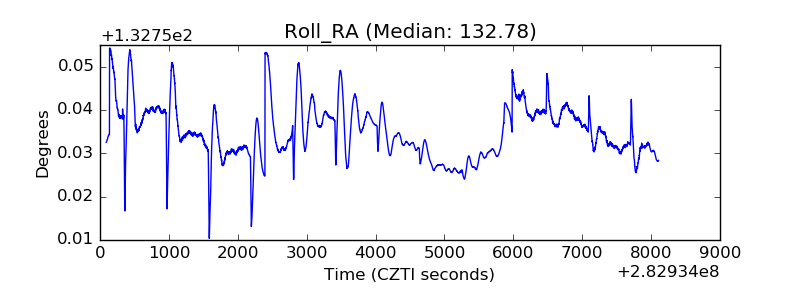 |
| Veto Counter | 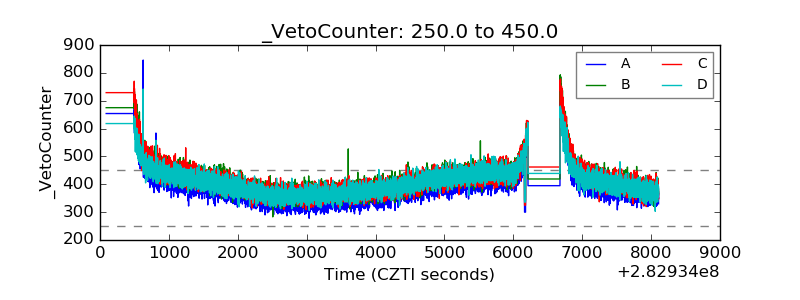 |