| Param | Original file | Final file |
|---|---|---|
| Filename | modeM0/AS1A05_068T01_9000002580_17446cztM0_level2.evt | modeM0/AS1A05_068T01_9000002580_17446cztM0_level2_quad_clean.evt |
| Size (bytes) | 526,705,920 | 96,459,840 |
| Size | 502.3 MB | 92.0 MB |
| Events in quadrant A | 3,565,380 | 614,642 |
| Events in quadrant B | 3,659,348 | 612,654 |
| Events in quadrant C | 3,829,351 | 588,692 |
| Events in quadrant D | 4,389,784 | 585,217 |
| Mode M0 | |||
|---|---|---|---|
| Quadrant | BADHDUFLAG | Total packets | Discarded packets |
| A | 0 | 15525 | 1 |
| B | 0 | 15721 | 1 |
| C | 0 | 15925 | 1 |
| D | 0 | 18027 | 1 |
| Mode SS | |||
|---|---|---|---|
| Quadrant | BADHDUFLAG | Total packets | Discarded packets |
| A | 0 | 150 | 0 |
| B | 0 | 150 | 0 |
| C | 0 | 150 | 0 |
| D | 0 | 150 | 0 |
| Mode M9 | |||
|---|---|---|---|
| Quadrant | BADHDUFLAG | Total packets | Discarded packets |
| A | 0 | 2 | 0 |
| B | 0 | 2 | 0 |
| C | 0 | 2 | 0 |
| D | 0 | 2 | 0 |
| Quadrant | Total seconds | Saturated seconds | Saturation percentage |
|---|---|---|---|
| A | 7478 | 94 | 1.257021% |
| B | 7479 | 135 | 1.805054% |
| C | 7479 | 161 | 2.152694% |
| D | 7478 | 121 | 1.618080% |
Noise dominated data is calculated using 1-second bins in cleaned event files. If a bin has >2000 counts, and if more than 50% of those come from <1% of pixels, then it is considered to be noise-dominated and hence unusable.
| Quadrant | # 1 sec bins | Bins with >0 counts | Bins with >2000 counts | High rate bins dominated by noise | Noise dominated (total time) | Noise dominated (detector-on time) | Marked lightcurve |
|---|---|---|---|---|---|---|---|
| A | 7603 | 7480 | 0 | 0 | 0.00% | 0.00% | 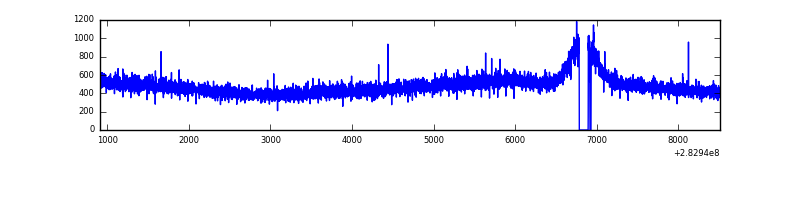 |
| B | 7604 | 7481 | 0 | 0 | 0.00% | 0.00% | 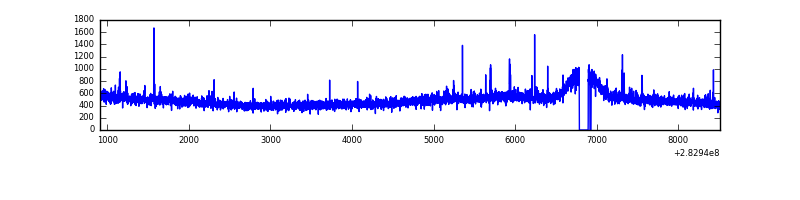 |
| C | 7604 | 7481 | 0 | 0 | 0.00% | 0.00% | 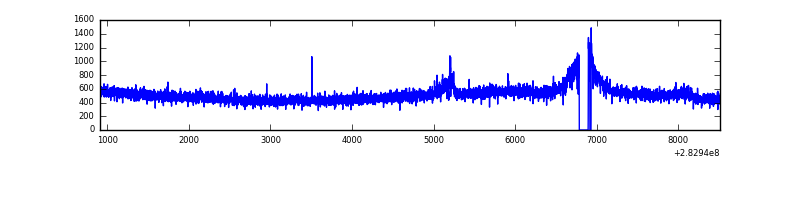 |
| D | 7603 | 7480 | 68 | 68 | 0.89% | 0.91% | 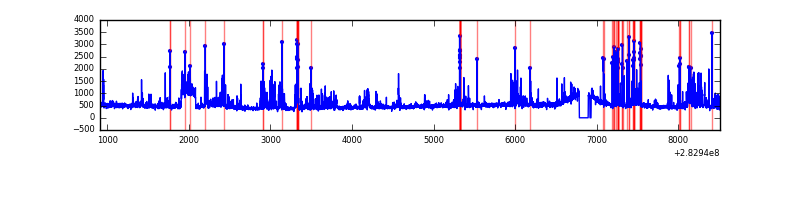 |
Top three noisy pixels from each quadrant. If the there are fewer than three noisy pixels in the level2.evt file, extra rows are filled as -1
| Pixel properties | Quadrant properties | ||||||
|---|---|---|---|---|---|---|---|
| Quadrant | DetID | PixID | Counts | Sigma | Mean | Median | Sigma |
| A | 0 | 226 | 8086 | 37.99 | 926 | 907 | 189.0 |
| A | 3 | 137 | 6941 | 31.93 | 926 | 907 | 189.0 |
| A | 12 | 194 | 6701 | 30.66 | 926 | 907 | 189.0 |
| B | 12 | 111 | 21325 | 114.86 | 920 | 896 | 177.9 |
| B | 11 | 111 | 18392 | 98.37 | 920 | 896 | 177.9 |
| B | 14 | 111 | 15272 | 80.83 | 920 | 896 | 177.9 |
| C | 5 | 218 | 135229 | 648.29 | 882 | 887 | 207.2 |
| C | 14 | 238 | 133131 | 638.16 | 882 | 887 | 207.2 |
| C | 3 | 233 | 94132 | 449.97 | 882 | 887 | 207.2 |
| D | 13 | 189 | 400407 | 1812.07 | 894 | 867 | 220.5 |
| D | 13 | 232 | 383933 | 1737.36 | 894 | 867 | 220.5 |
| D | 11 | 176 | 56192 | 250.92 | 894 | 867 | 220.5 |
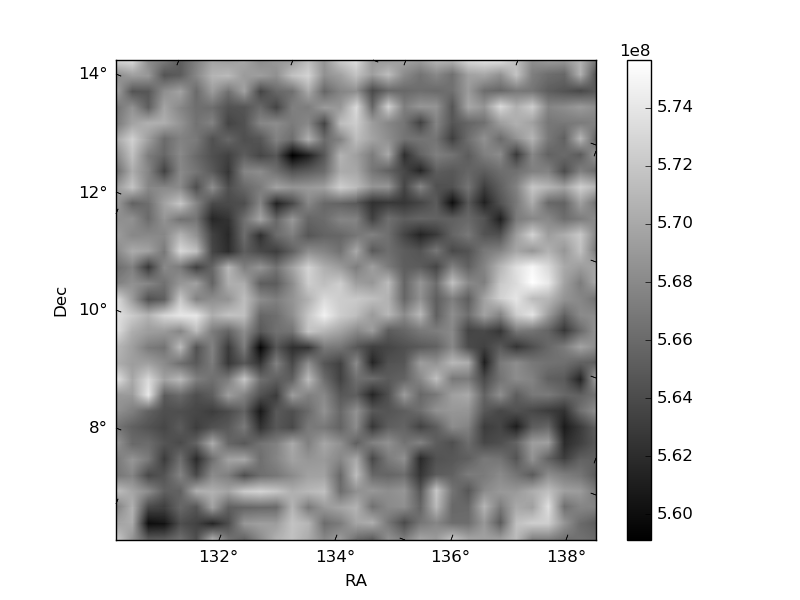
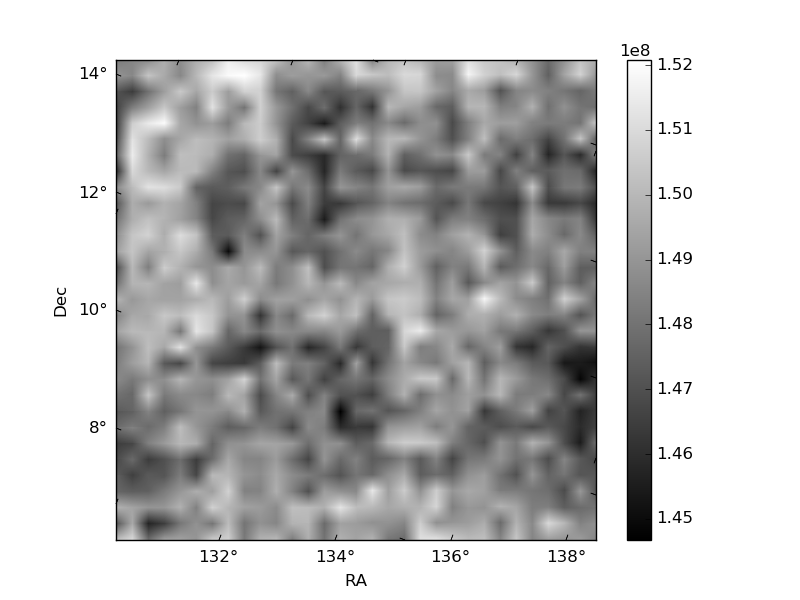
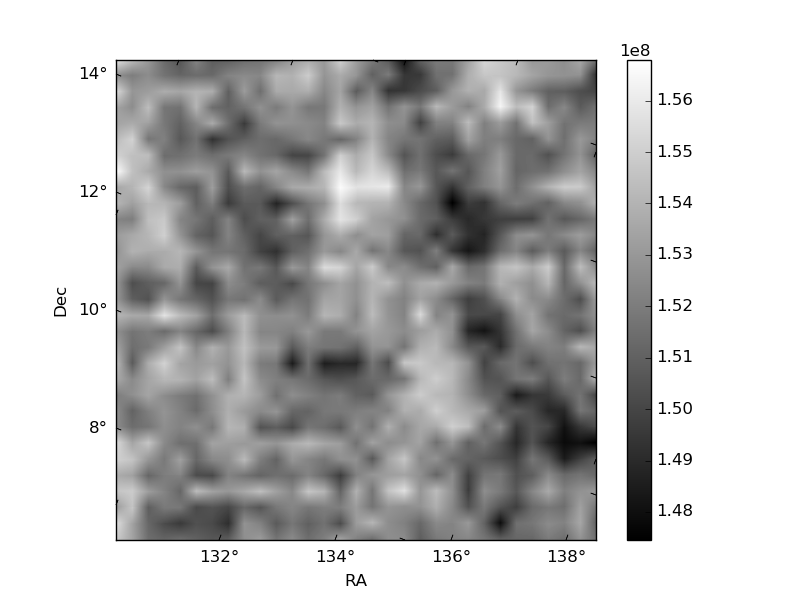
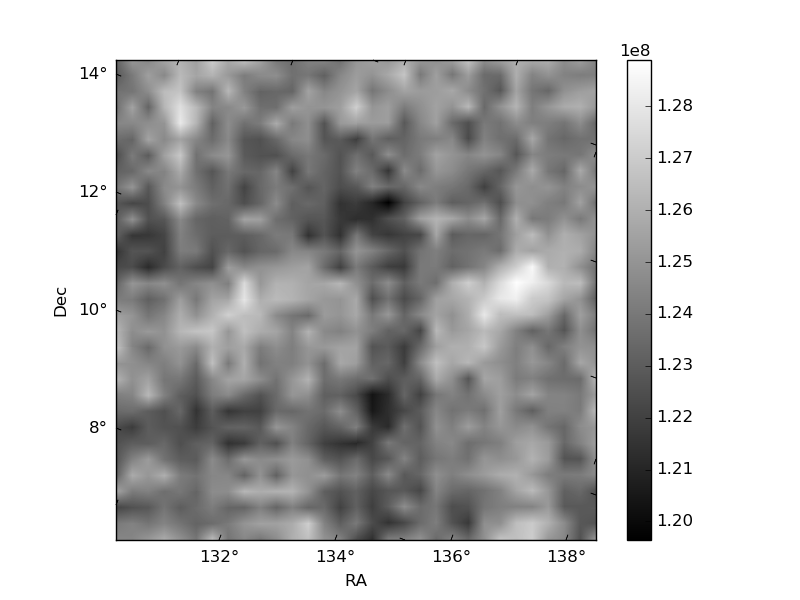
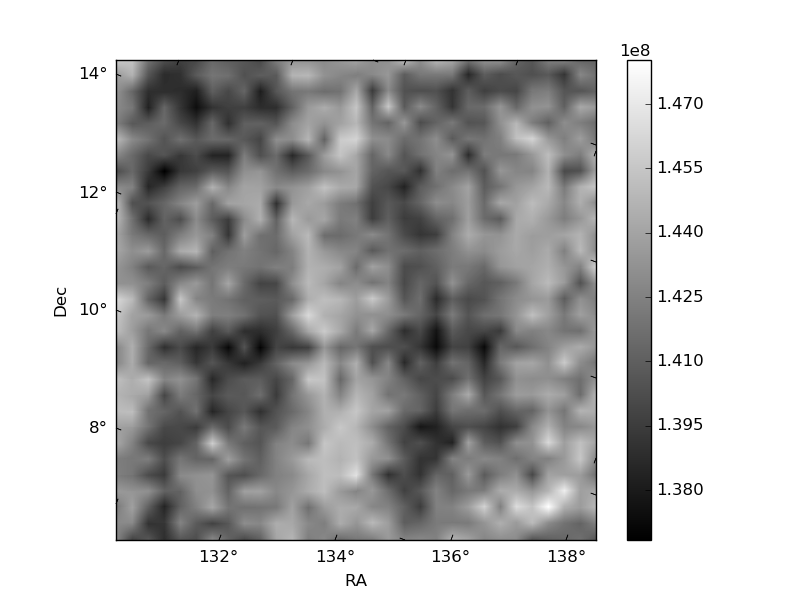
Histogram calculated using DETX and DETY for each event in the final _common_clean file
| Quadrant A | 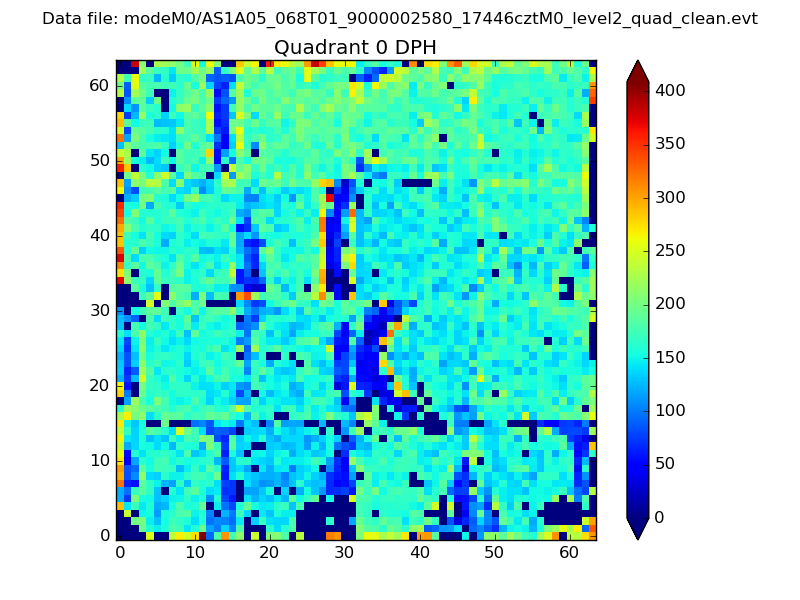 |
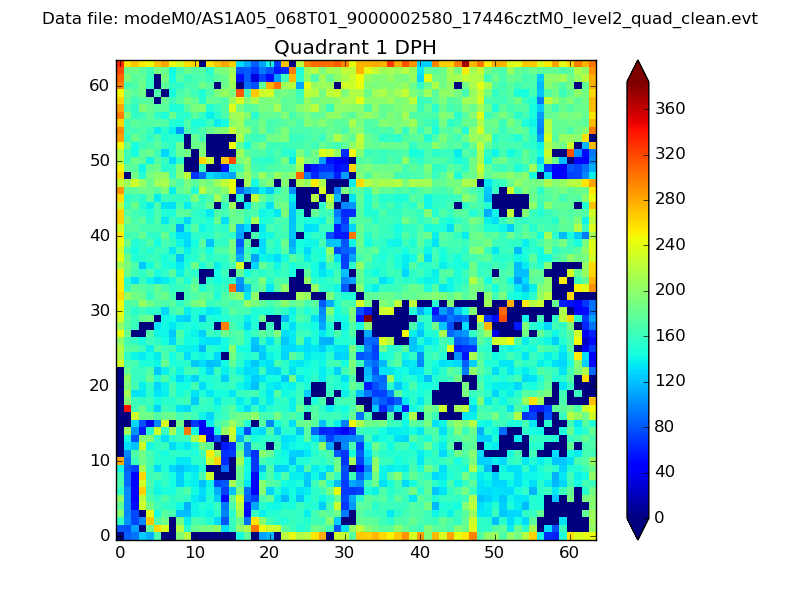 |
Quadrant B |
|---|---|---|---|
| Quadrant D | 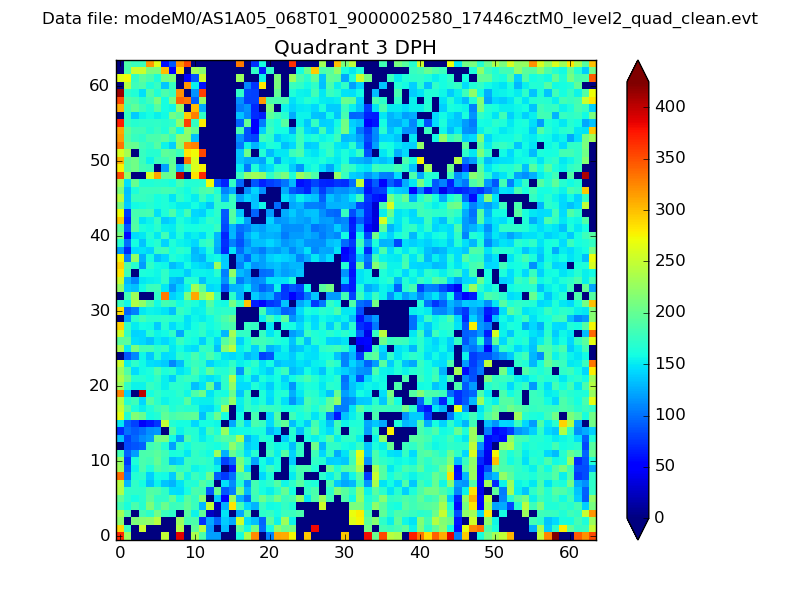 |
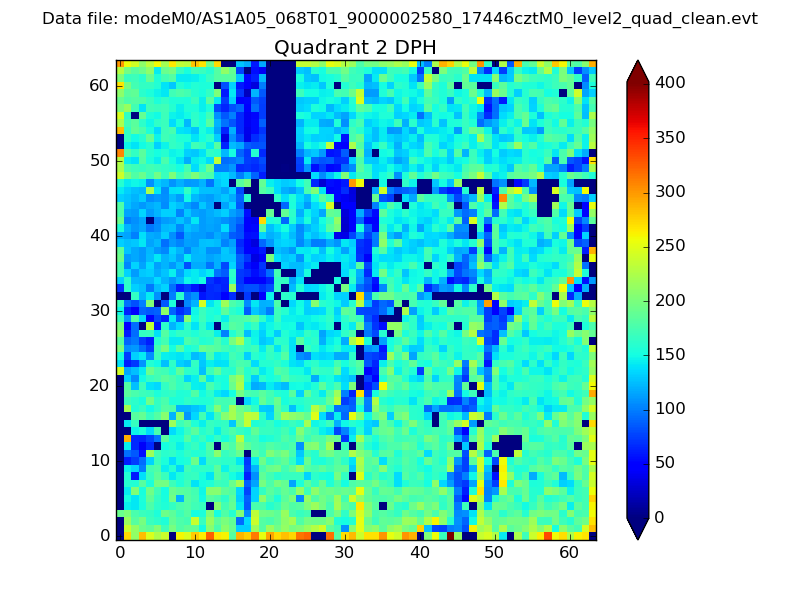 |
Quadrant C |
| Plot type | Count rate plots | Images |
|---|---|---|
| Comparison with Poisson distribution Blue bars denote a histogram of data divided into 1 sec bins. Red curve is a Poisson curve with rate = median count rate of data. |
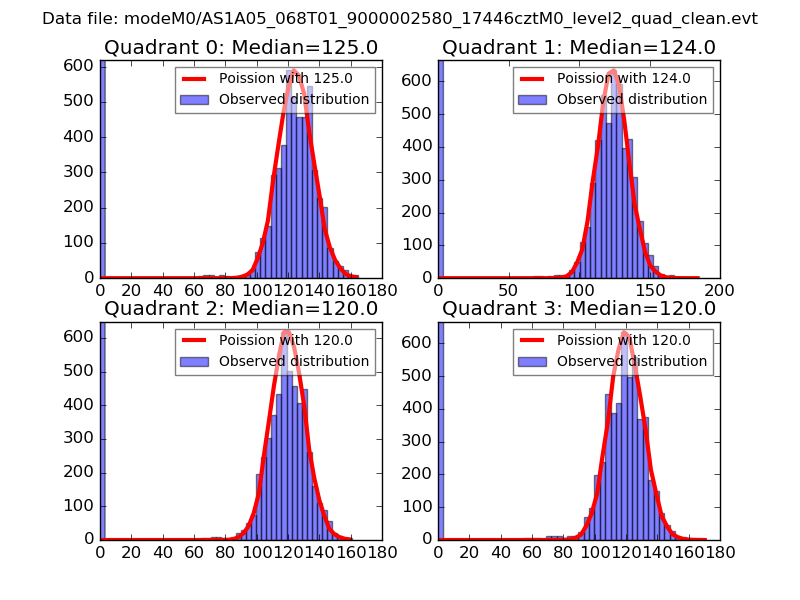 |
 |
| Quadrant-wise count rates Data is divided into 100 sec bins |
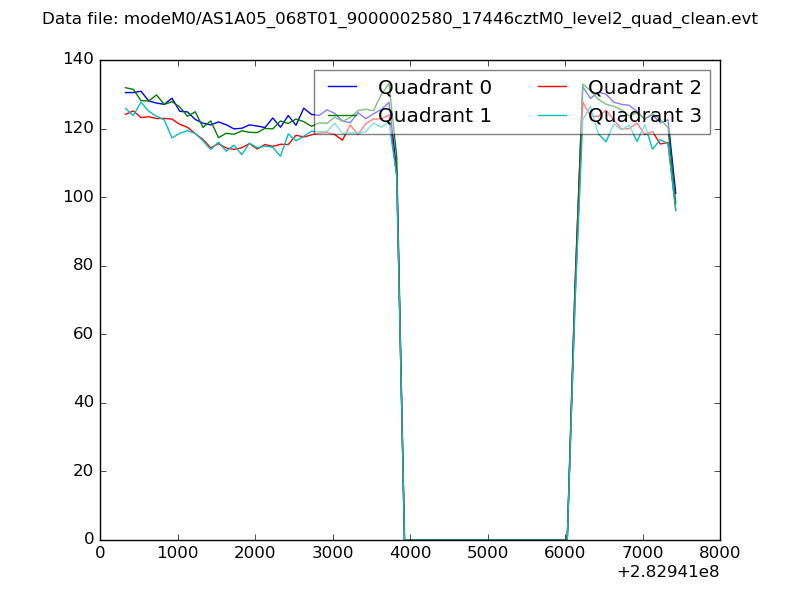 |
|
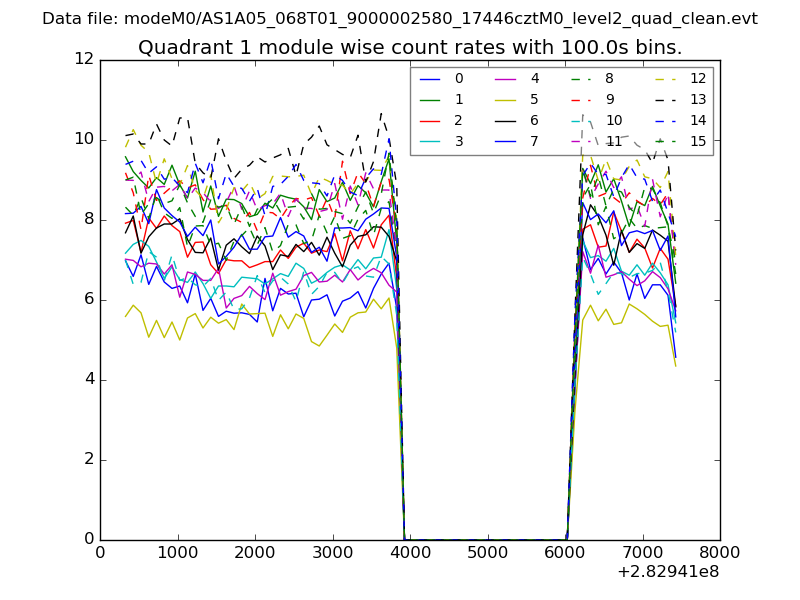
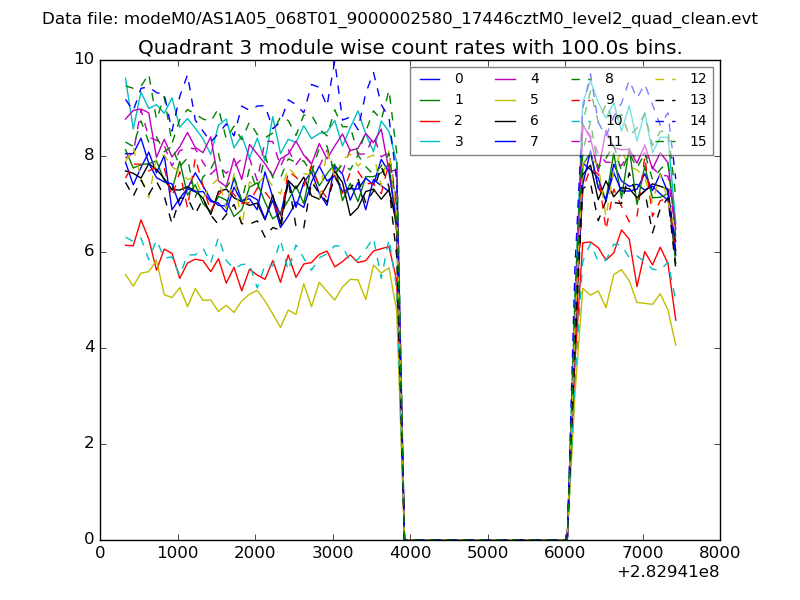
| Module-wise count rates for Quadrant A Data is divided into 100 sec bins |
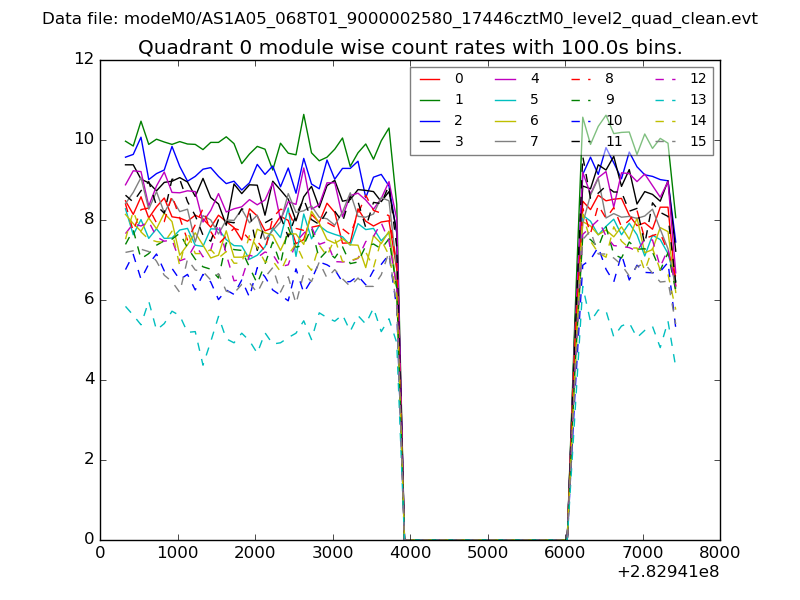 |
 |
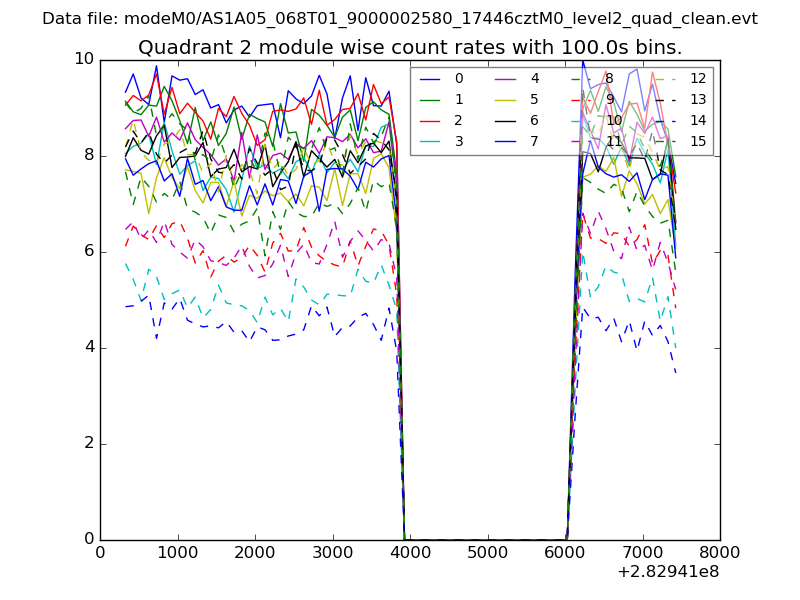
| Module-wise count rates for Quadrant B Data is divided into 100 sec bins |
 |
 |
| Module-wise count rates for Quadrant C Data is divided into 100 sec bins |
 |
 |
| Module-wise count rates for Quadrant D Data is divided into 100 sec bins |
 |
 |
| Parameter | Plot |
|---|---|
| CZT HV Monitor | 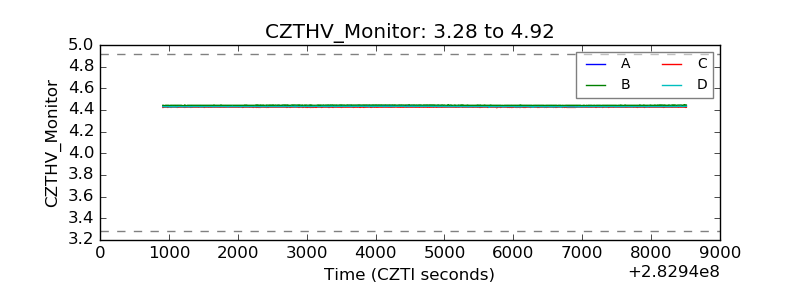 |
| D_VDD |  |
| Temperature 1 | 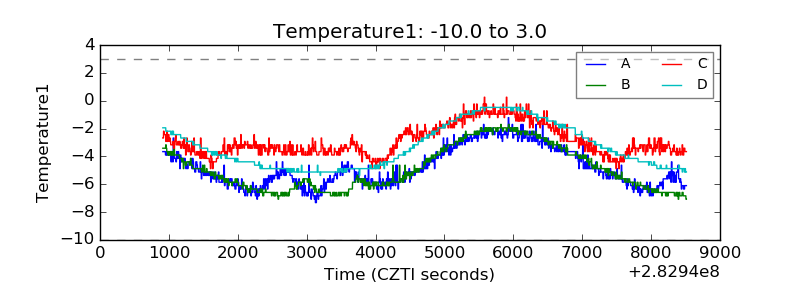 |
| Veto HV Monitor | 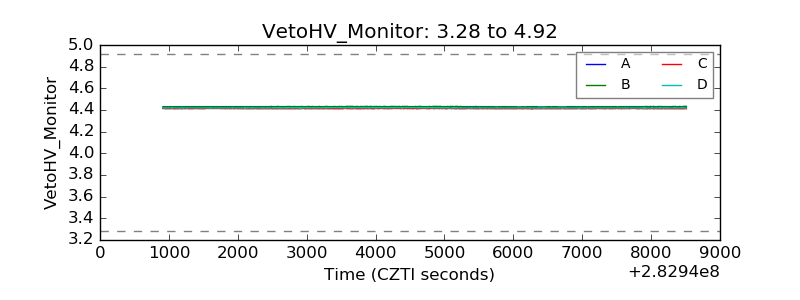 |
| Veto LLD | 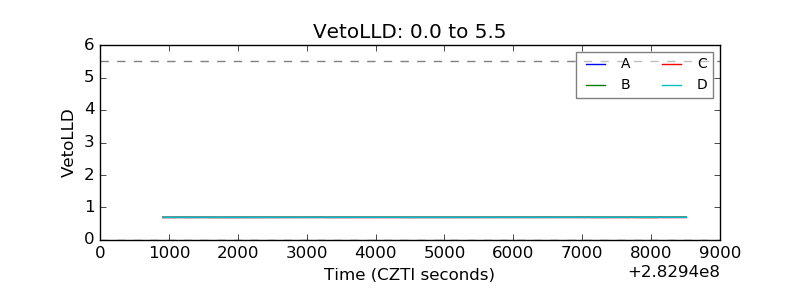 |
| Alpha Counter | 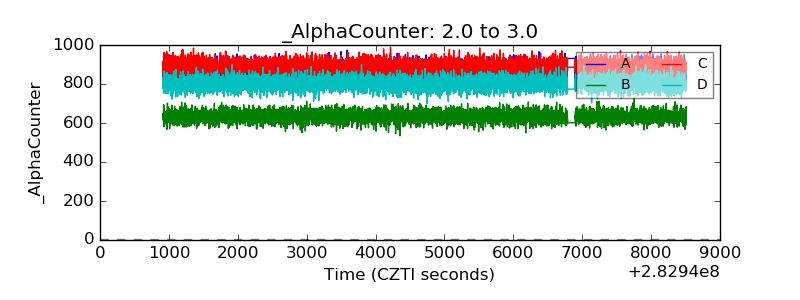 |
| _CPM_Rate | 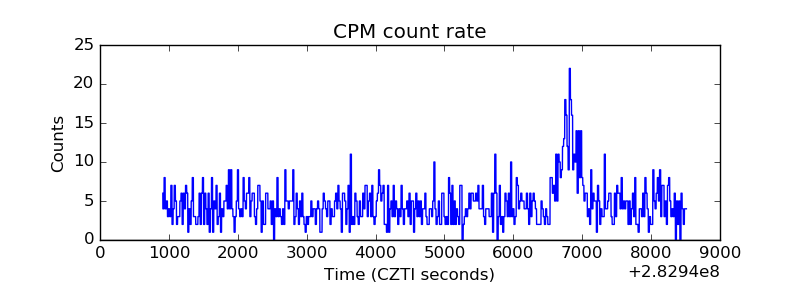 |
| CZT Counter | 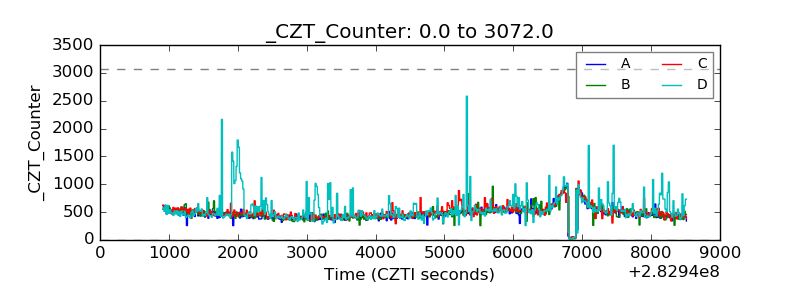 |
| +2.5 Volts monitor |  |
| +5 Volts monitor |  |
| _ROLL_ROT | 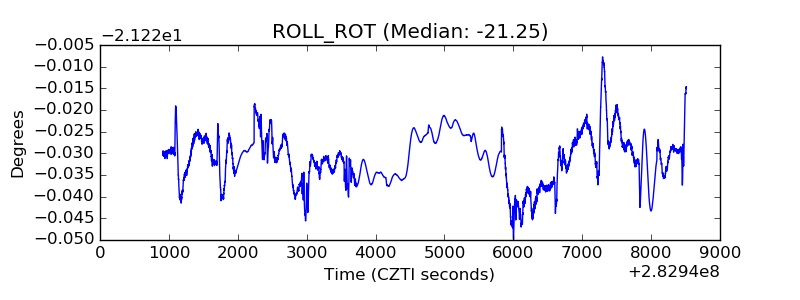 |
| _Roll_DEC |  |
| _Roll_RA | 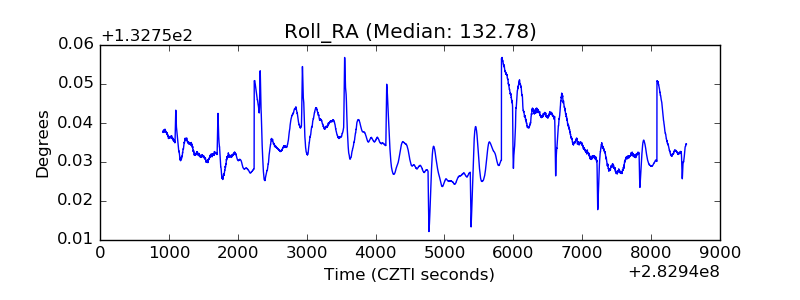 |
| Veto Counter | 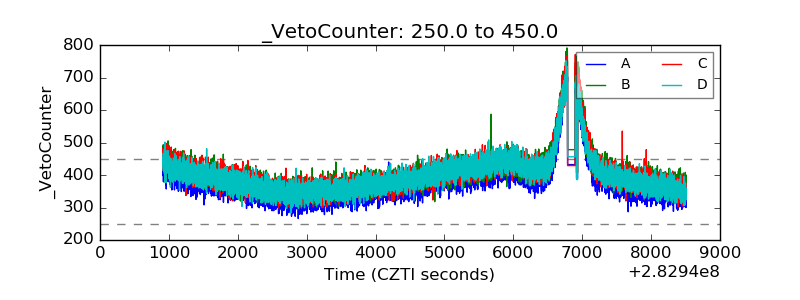 |