| Param | Original file | Final file |
|---|---|---|
| Filename | modeM0/AS1T03_067T01_9000002582cztM0_level2.fits | modeM0/AS1T03_067T01_9000002582cztM0_level2_quad_clean.evt |
| Size (bytes) | 1,077,514,560 | 1,000,258,560 |
| Size | 1.0 GB | 953.9 MB |
| Events in quadrant A | 6,633,622 | 5,958,664 |
| Events in quadrant B | 6,339,660 | 5,960,083 |
| Events in quadrant C | 6,476,310 | 5,651,405 |
| Events in quadrant D | 5,538,754 | 5,081,856 |
| Mode M0 | |||
|---|---|---|---|
| Quadrant | BADHDUFLAG | Total packets | Discarded packets |
| A | 0 | 242905 | 0 |
| B | 0 | 251697 | 0 |
| C | 0 | 234600 | 0 |
| D | 0 | 321471 | 0 |
| Mode SS | |||
|---|---|---|---|
| Quadrant | BADHDUFLAG | Total packets | Discarded packets |
| A | 0 | 2270 | 0 |
| B | 0 | 2270 | 0 |
| C | 0 | 2270 | 0 |
| D | 0 | 2270 | 0 |
| Mode M9 | |||
|---|---|---|---|
| Quadrant | BADHDUFLAG | Total packets | Discarded packets |
| A | 0 | 183 | 0 |
| B | 0 | 183 | 0 |
| C | 0 | 183 | 0 |
| D | 0 | 183 | 0 |
| Quadrant | Total seconds | Saturated seconds | Saturation percentage |
|---|---|---|---|
| A | 111505 | 2358 | 2.114703% |
| B | 111505 | 1716 | 1.538944% |
| C | 111505 | 1428 | 1.280660% |
| D | 111505 | 7459 | 6.689386% |
Noise dominated data is calculated using 1-second bins in cleaned event files. If a bin has >2000 counts, and if more than 50% of those come from <1% of pixels, then it is considered to be noise-dominated and hence unusable.
| Quadrant | # 1 sec bins | Bins with >0 counts | Bins with >2000 counts | High rate bins dominated by noise | Noise dominated (total time) | Noise dominated (detector-on time) | Marked lightcurve |
|---|---|---|---|---|---|---|---|
| A | 129635 | 111503 | 0 | 0 | 0.00% | 0.00% | 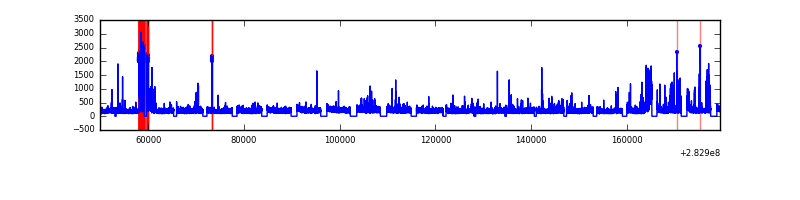 |
| B | 129635 | 111499 | 0 | 0 | 0.00% | 0.00% | 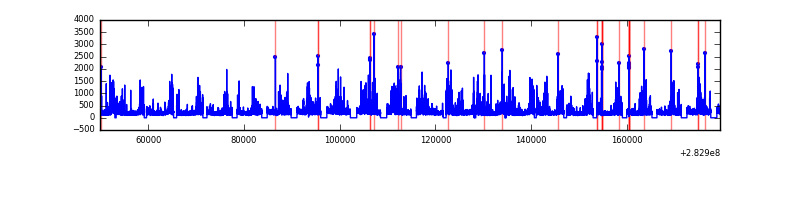 |
| C | 129635 | 111503 | 0 | 0 | 0.00% | 0.00% | 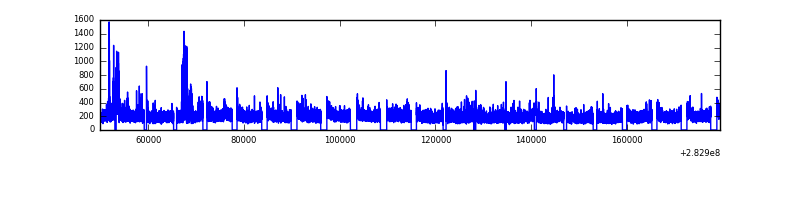 |
| D | 129633 | 111471 | 0 | 0 | 0.00% | 0.00% | 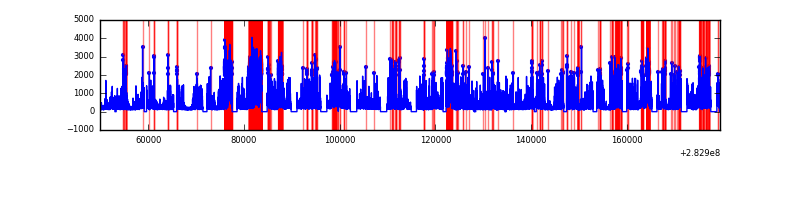 |
Top three noisy pixels from each quadrant. If the there are fewer than three noisy pixels in the level2.evt file, extra rows are filled as -1
| Pixel properties | Quadrant properties | ||||||
|---|---|---|---|---|---|---|---|
| Quadrant | DetID | PixID | Counts | Sigma | Mean | Median | Sigma |
| A | 0 | 29 | 6307 | 10.99 | 1731 | 1628 | 425.8 |
| A | 7 | 110 | 5427 | 8.92 | 1731 | 1628 | 425.8 |
| A | 0 | 30 | 5163 | 8.3 | 1731 | 1628 | 425.8 |
| B | 2 | 9 | 5044 | 10.66 | 1681 | 1609 | 322.1 |
| B | 2 | 8 | 4285 | 8.31 | 1681 | 1609 | 322.1 |
| B | 3 | 17 | 4233 | 8.15 | 1681 | 1609 | 322.1 |
| C | 12 | 241 | 4444 | 6.59 | 1712 | 1606 | 431.0 |
| C | 3 | 126 | 4440 | 6.58 | 1712 | 1606 | 431.0 |
| C | 2 | 191 | 4246 | 6.13 | 1712 | 1606 | 431.0 |
| D | 3 | 14 | 4016 | 6.16 | 1583 | 1444 | 417.5 |
| D | 6 | 231 | 4008 | 6.14 | 1583 | 1444 | 417.5 |
| D | 7 | 3 | 3900 | 5.88 | 1583 | 1444 | 417.5 |
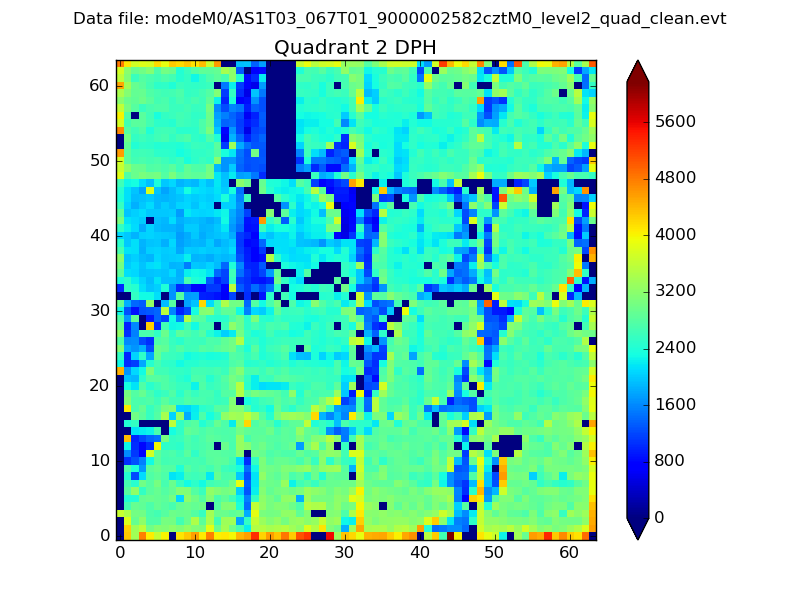
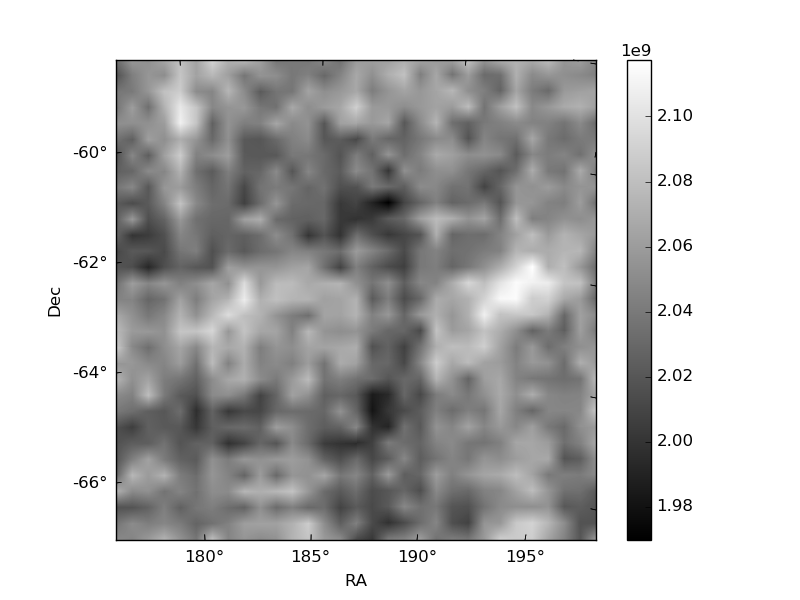
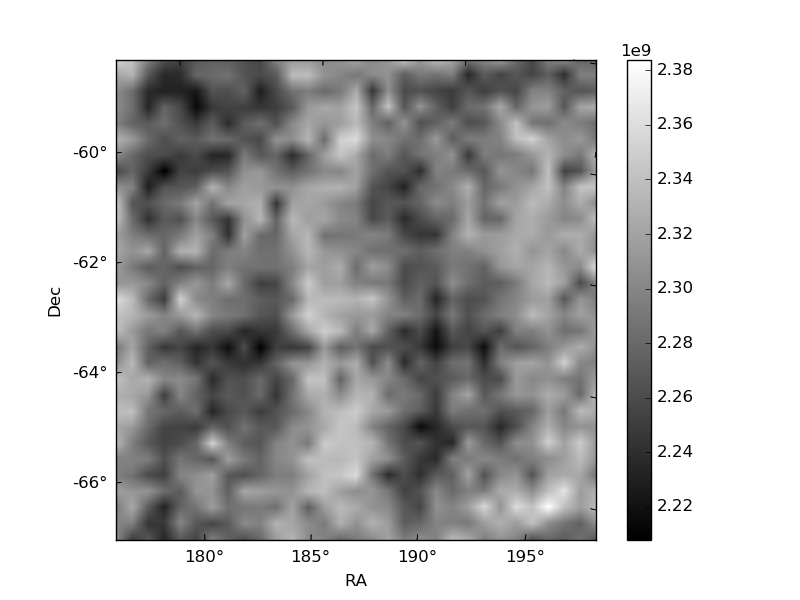
Histogram calculated using DETX and DETY for each event in the final _common_clean file
| Quadrant A | 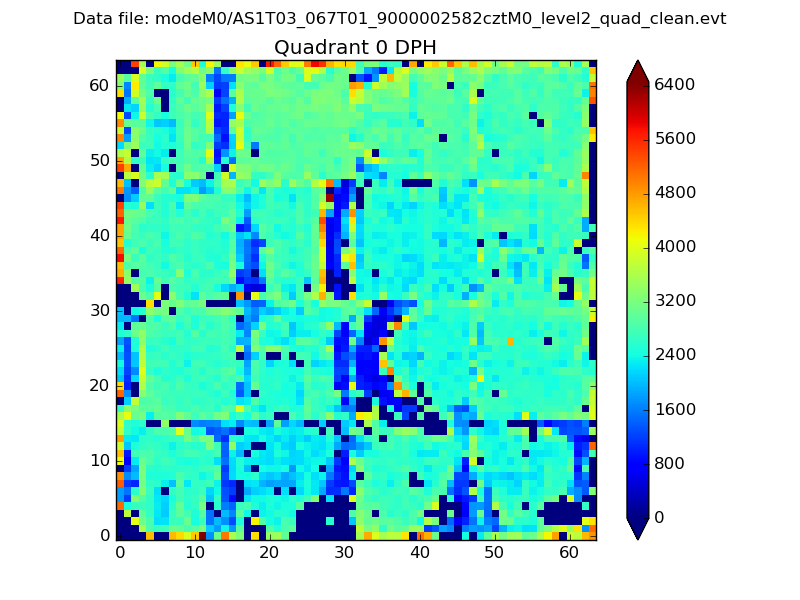 |
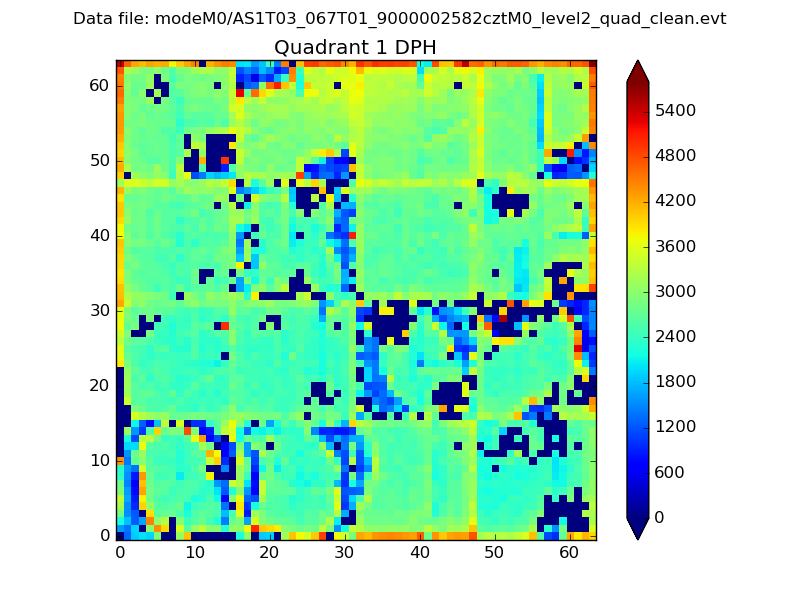 |
Quadrant B |
|---|---|---|---|
| Quadrant D | 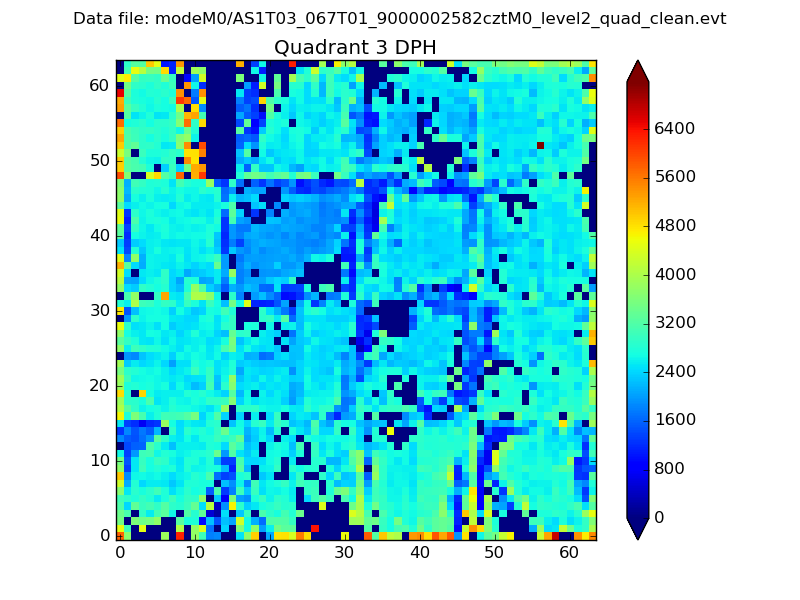 |
 |
Quadrant C |
| Plot type | Count rate plots | Images |
|---|---|---|
| Comparison with Poisson distribution Blue bars denote a histogram of data divided into 1 sec bins. Red curve is a Poisson curve with rate = median count rate of data. |
 |
 |
| Quadrant-wise count rates Data is divided into 100 sec bins |
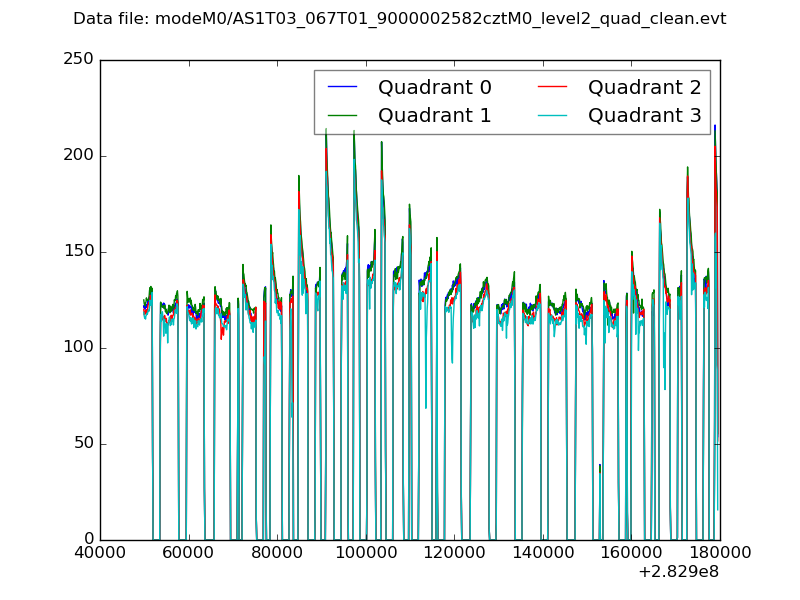 |
|
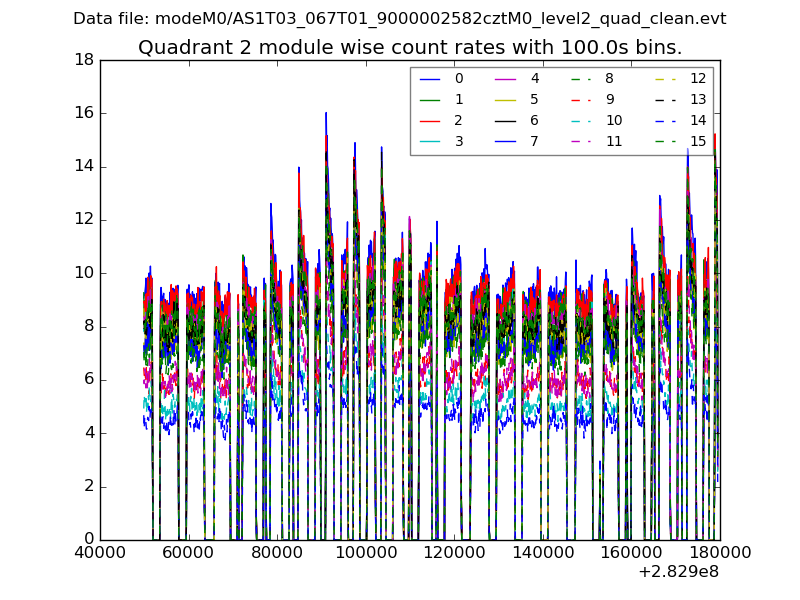
| Module-wise count rates for Quadrant A Data is divided into 100 sec bins |
 |
 |
| Module-wise count rates for Quadrant B Data is divided into 100 sec bins |
 |
 |
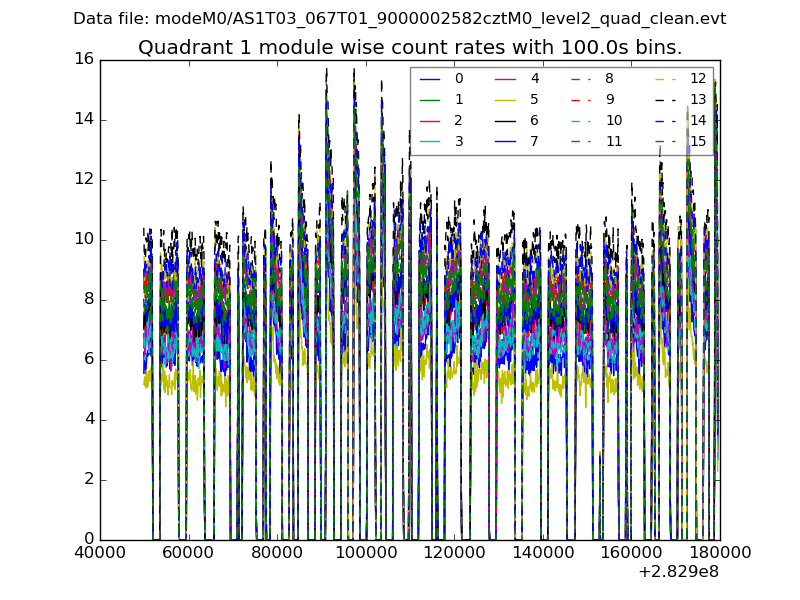
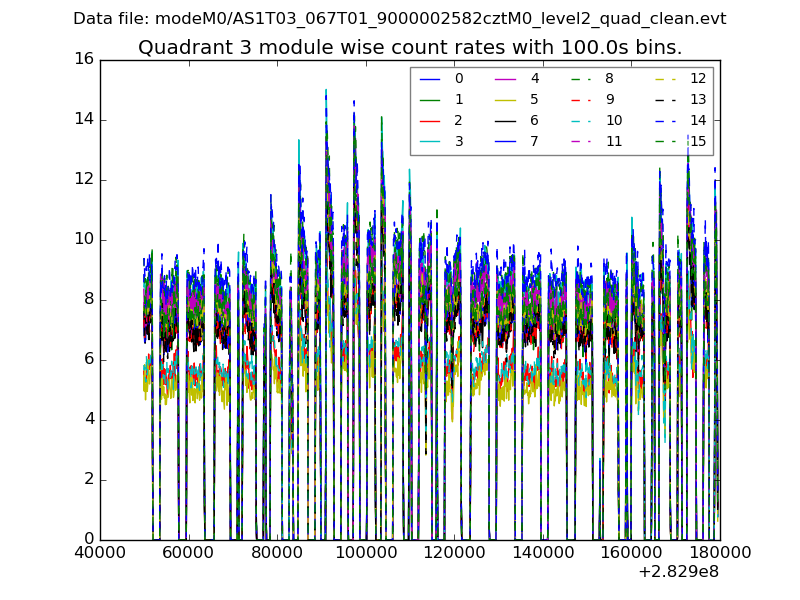
| Module-wise count rates for Quadrant C Data is divided into 100 sec bins |
 |
 |
| Module-wise count rates for Quadrant D Data is divided into 100 sec bins |
 |
 |
| Parameter | Plot |
|---|---|
| CZT HV Monitor | 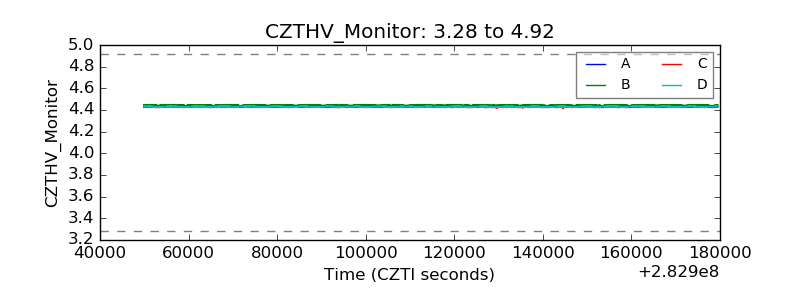 |
| D_VDD | 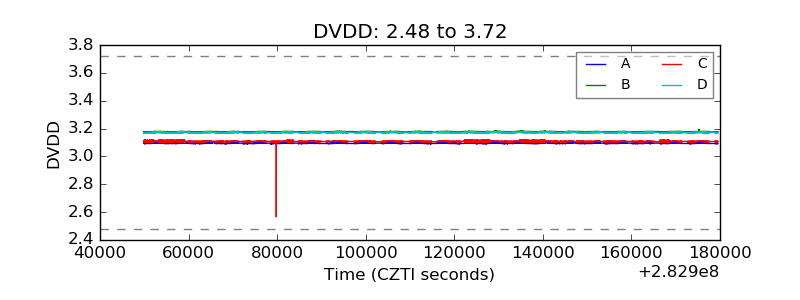 |
| Temperature 1 |  |
| Veto HV Monitor | 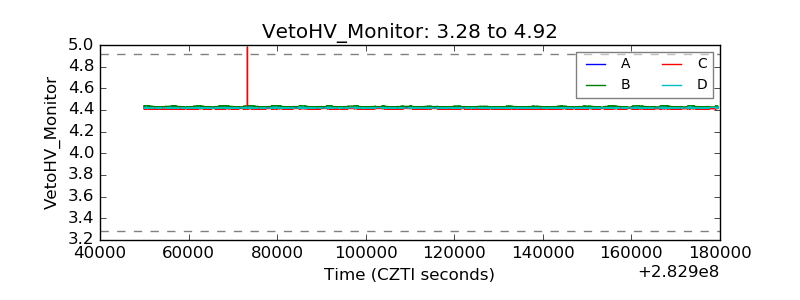 |
| Veto LLD |  |
| Alpha Counter | 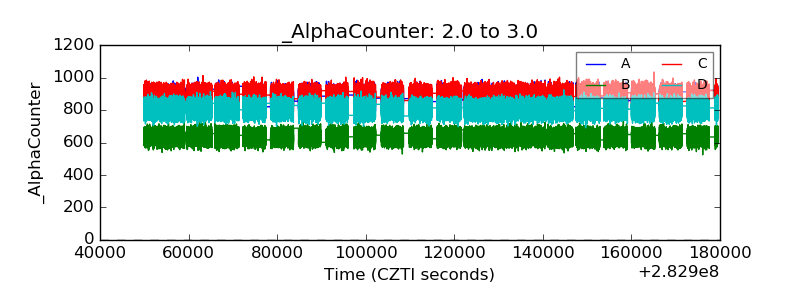 |
| _CPM_Rate | 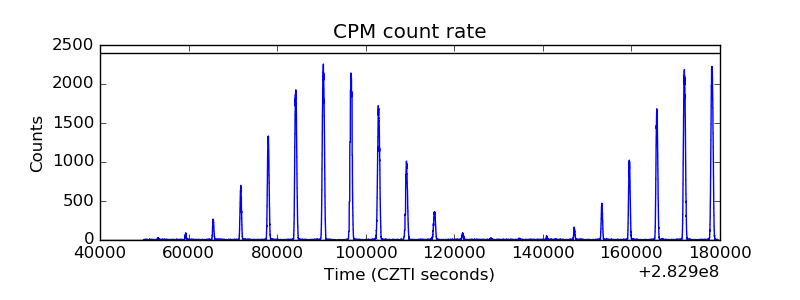 |
| CZT Counter | 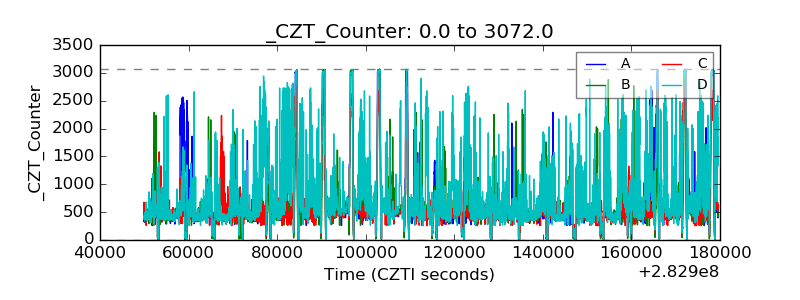 |
| +2.5 Volts monitor | 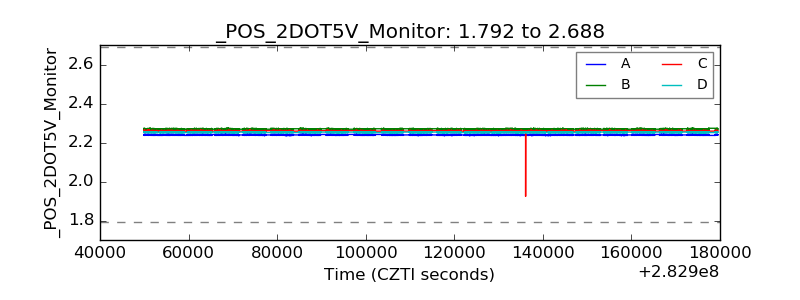 |
| +5 Volts monitor |  |
| _ROLL_ROT | 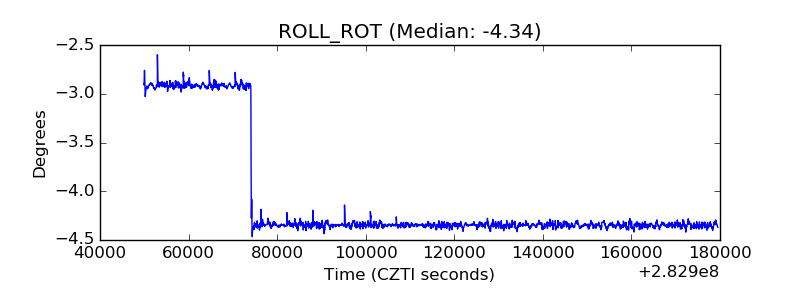 |
| _Roll_DEC |  |
| _Roll_RA | 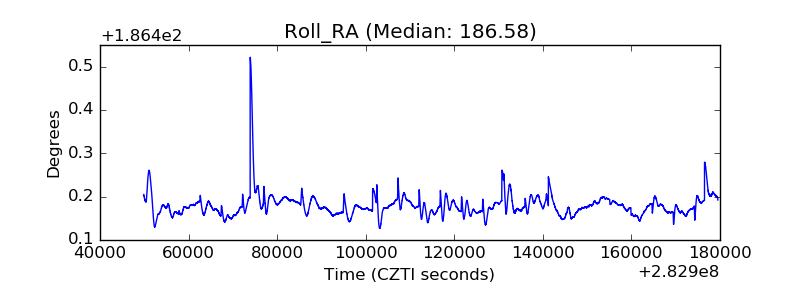 |
| Veto Counter | 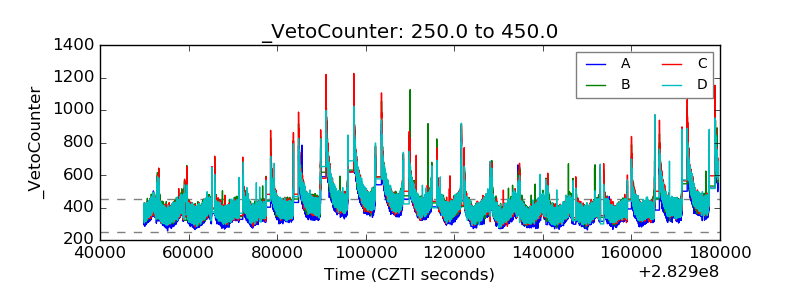 |