| Param | Original file | Final file |
|---|---|---|
| Filename | modeM0/AS1T03_067T01_9000002582_17451cztM0_level2.evt | modeM0/AS1T03_067T01_9000002582_17451cztM0_level2_quad_clean.evt |
| Size (bytes) | 881,815,680 | 161,236,800 |
| Size | 841.0 MB | 153.8 MB |
| Events in quadrant A | 7,571,769 | 1,032,183 |
| Events in quadrant B | 5,896,048 | 1,053,047 |
| Events in quadrant C | 5,770,627 | 1,006,019 |
| Events in quadrant D | 6,676,213 | 983,427 |
| Mode M0 | |||
|---|---|---|---|
| Quadrant | BADHDUFLAG | Total packets | Discarded packets |
| A | 0 | 30673 | 2 |
| B | 0 | 25429 | 2 |
| C | 0 | 24271 | 3 |
| D | 0 | 27968 | 2 |
| Mode SS | |||
|---|---|---|---|
| Quadrant | BADHDUFLAG | Total packets | Discarded packets |
| A | 0 | 238 | 0 |
| B | 0 | 238 | 0 |
| C | 0 | 238 | 0 |
| D | 0 | 238 | 0 |
| Mode M9 | |||
|---|---|---|---|
| Quadrant | BADHDUFLAG | Total packets | Discarded packets |
| A | 0 | 12 | 0 |
| B | 0 | 12 | 0 |
| C | 0 | 12 | 0 |
| D | 0 | 12 | 0 |
| Quadrant | Total seconds | Saturated seconds | Saturation percentage |
|---|---|---|---|
| A | 11688 | 1110 | 9.496920% |
| B | 11689 | 99 | 0.846950% |
| C | 11688 | 83 | 0.710130% |
| D | 11688 | 203 | 1.736824% |
Noise dominated data is calculated using 1-second bins in cleaned event files. If a bin has >2000 counts, and if more than 50% of those come from <1% of pixels, then it is considered to be noise-dominated and hence unusable.
| Quadrant | # 1 sec bins | Bins with >0 counts | Bins with >2000 counts | High rate bins dominated by noise | Noise dominated (total time) | Noise dominated (detector-on time) | Marked lightcurve |
|---|---|---|---|---|---|---|---|
| A | 12818 | 11690 | 832 | 832 | 6.49% | 7.12% | 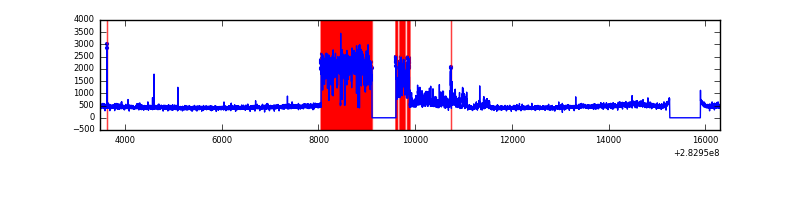 |
| B | 12819 | 11691 | 17 | 17 | 0.13% | 0.15% | 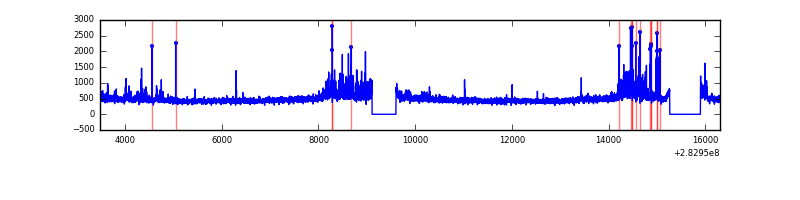 |
| C | 12818 | 11690 | 0 | 0 | 0.00% | 0.00% | 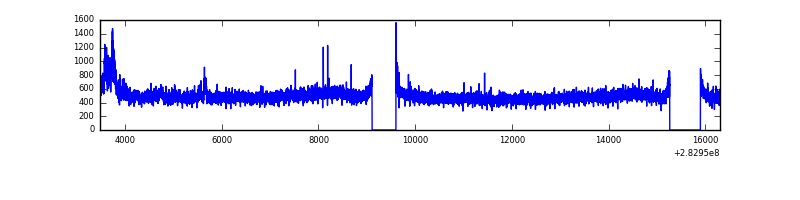 |
| D | 12818 | 11690 | 129 | 129 | 1.01% | 1.10% | 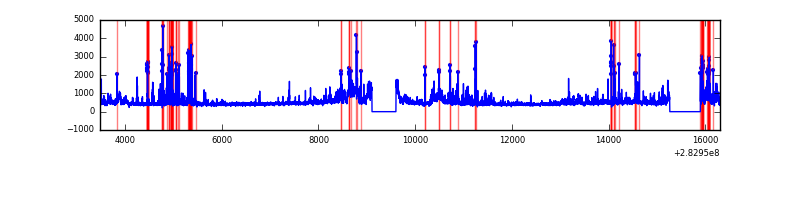 |
Top three noisy pixels from each quadrant. If the there are fewer than three noisy pixels in the level2.evt file, extra rows are filled as -1
| Pixel properties | Quadrant properties | ||||||
|---|---|---|---|---|---|---|---|
| Quadrant | DetID | PixID | Counts | Sigma | Mean | Median | Sigma |
| A | 3 | 64 | 2450800 | 9170.45 | 1324 | 1296 | 267.1 |
| A | 14 | 237 | 17402 | 60.3 | 1324 | 1296 | 267.1 |
| A | 0 | 226 | 11534 | 38.33 | 1324 | 1296 | 267.1 |
| B | 7 | 220 | 302648 | 1170.28 | 1366 | 1330 | 257.5 |
| B | 0 | 219 | 60151 | 228.45 | 1366 | 1330 | 257.5 |
| B | 0 | 189 | 50723 | 191.84 | 1366 | 1330 | 257.5 |
| C | 3 | 233 | 292131 | 951.82 | 1310 | 1319 | 305.5 |
| C | 14 | 238 | 202035 | 656.94 | 1310 | 1319 | 305.5 |
| C | 5 | 218 | 123761 | 400.75 | 1310 | 1319 | 305.5 |
| D | 11 | 176 | 529403 | 1645.02 | 1321 | 1281 | 321.0 |
| D | 13 | 232 | 456869 | 1419.08 | 1321 | 1281 | 321.0 |
| D | 13 | 189 | 451789 | 1403.26 | 1321 | 1281 | 321.0 |
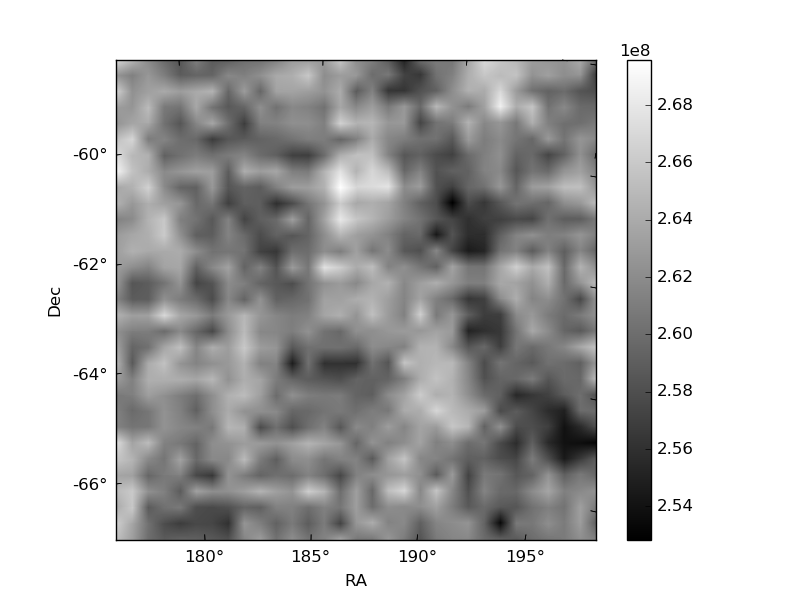
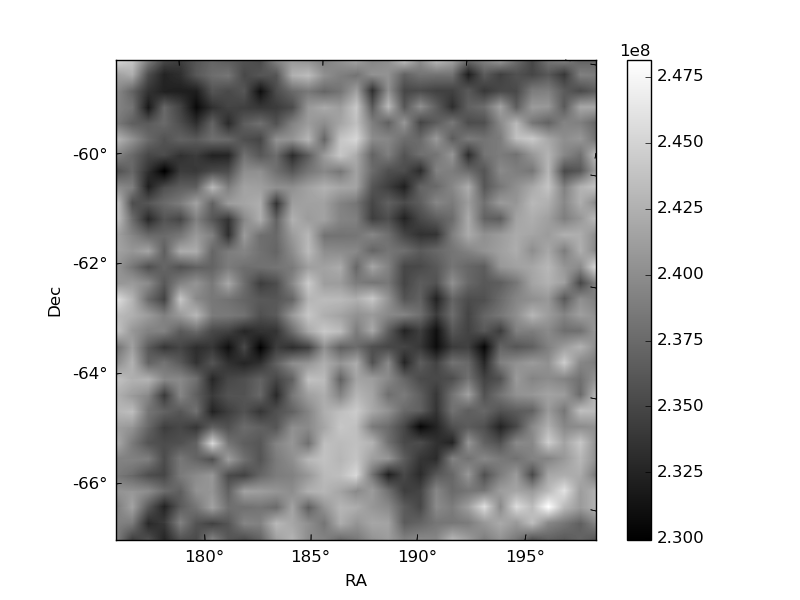
Histogram calculated using DETX and DETY for each event in the final _common_clean file
| Quadrant A | 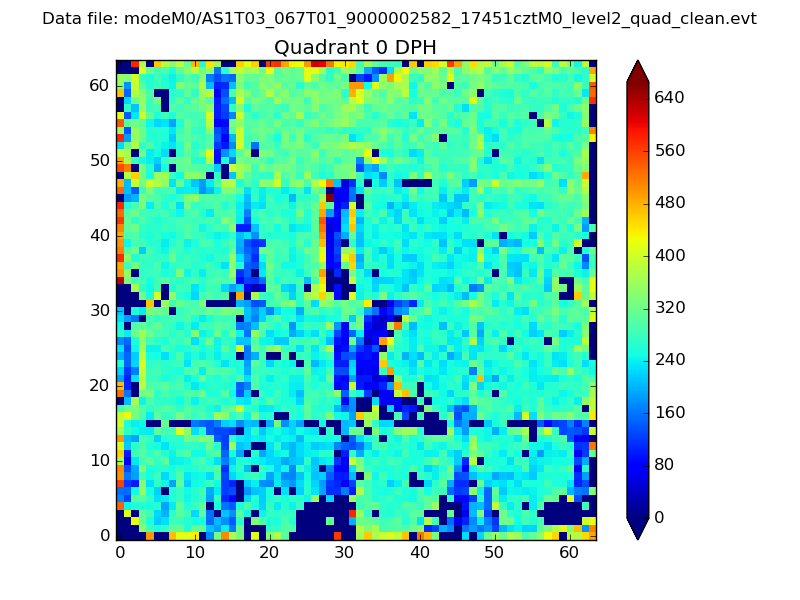 |
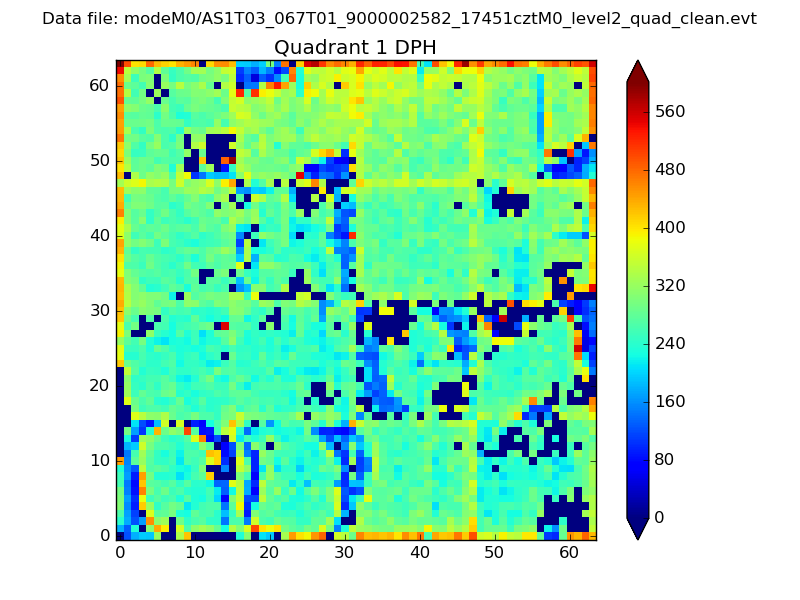 |
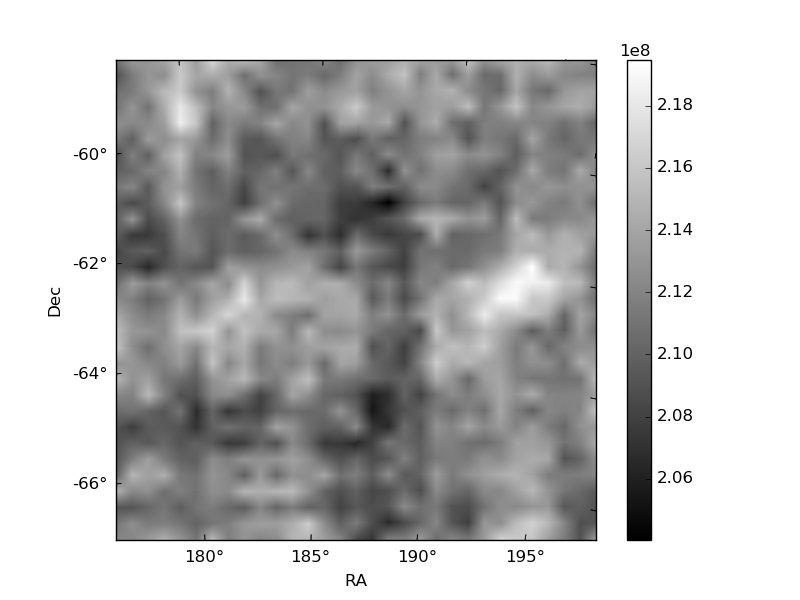
Quadrant B |
|---|---|---|---|
| Quadrant D | 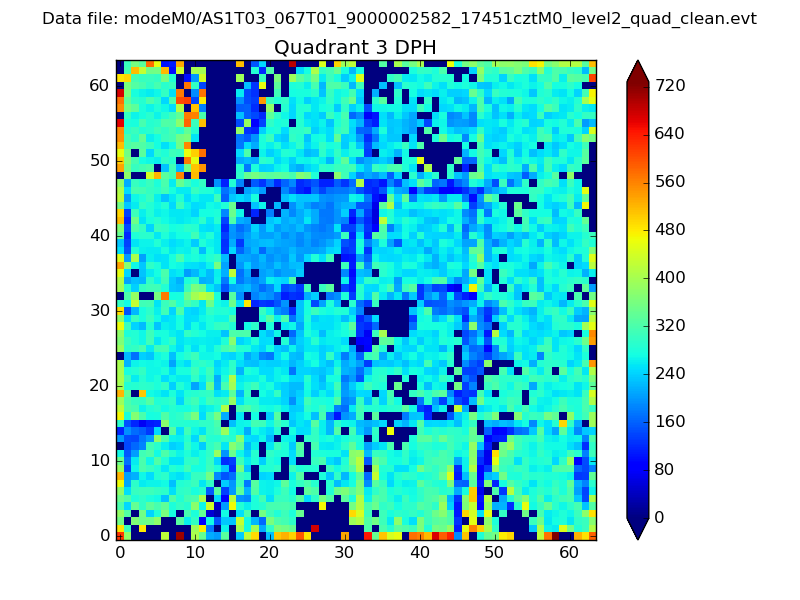 |
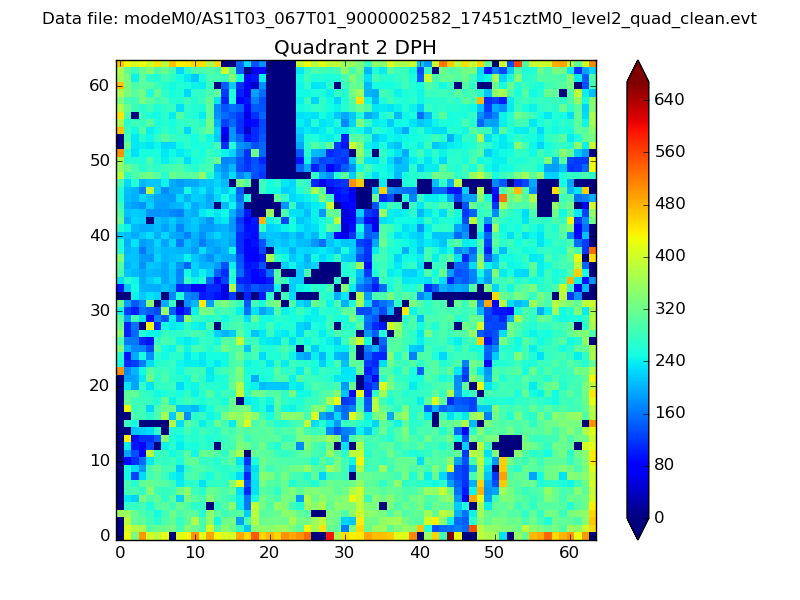 |
Quadrant C |
| Plot type | Count rate plots | Images |
|---|---|---|
| Comparison with Poisson distribution Blue bars denote a histogram of data divided into 1 sec bins. Red curve is a Poisson curve with rate = median count rate of data. |
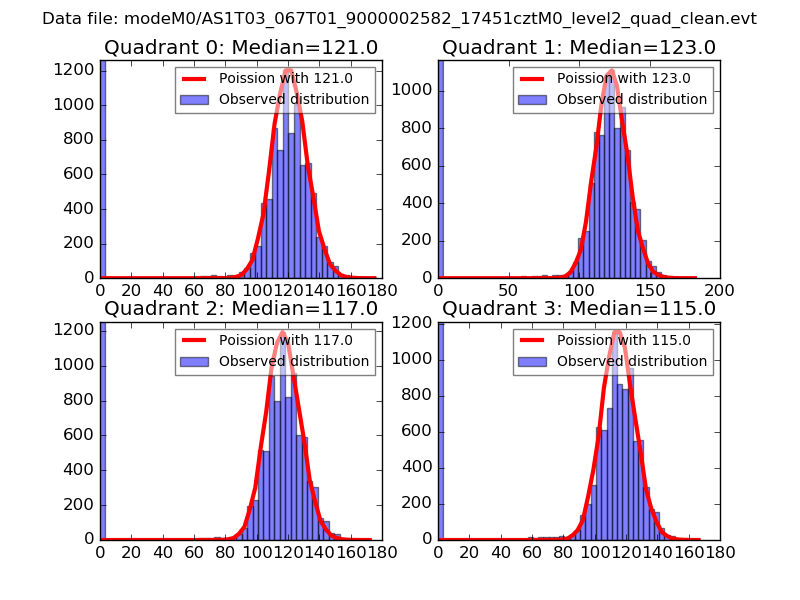 |
 |
| Quadrant-wise count rates Data is divided into 100 sec bins |
 |
|
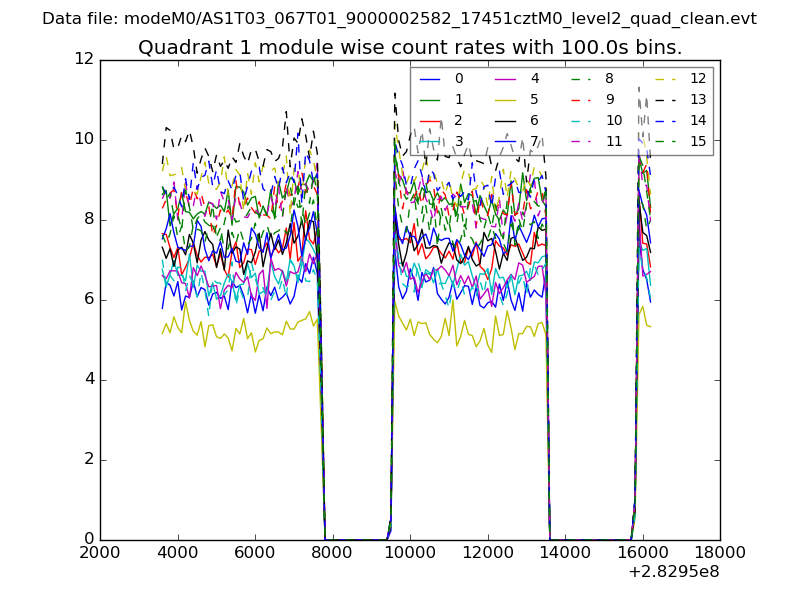
| Module-wise count rates for Quadrant A Data is divided into 100 sec bins |
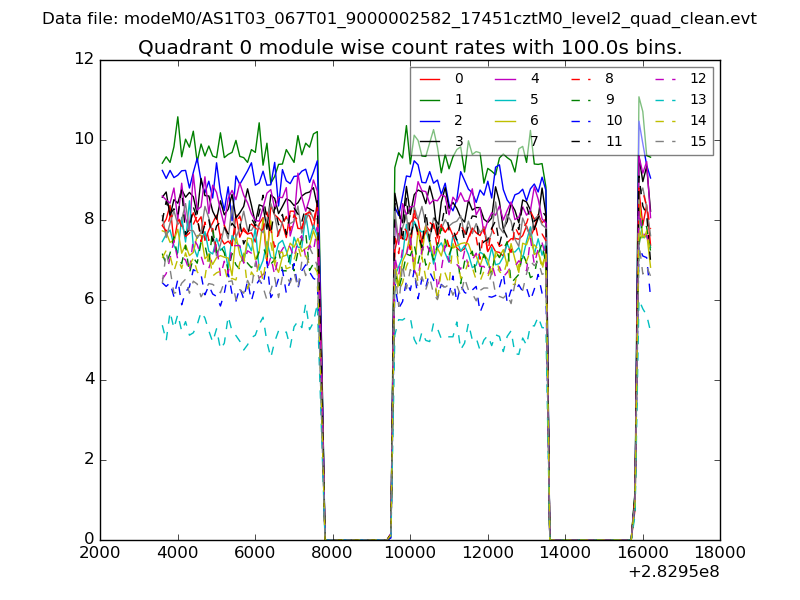 |
 |
| Module-wise count rates for Quadrant B Data is divided into 100 sec bins |
 |
 |
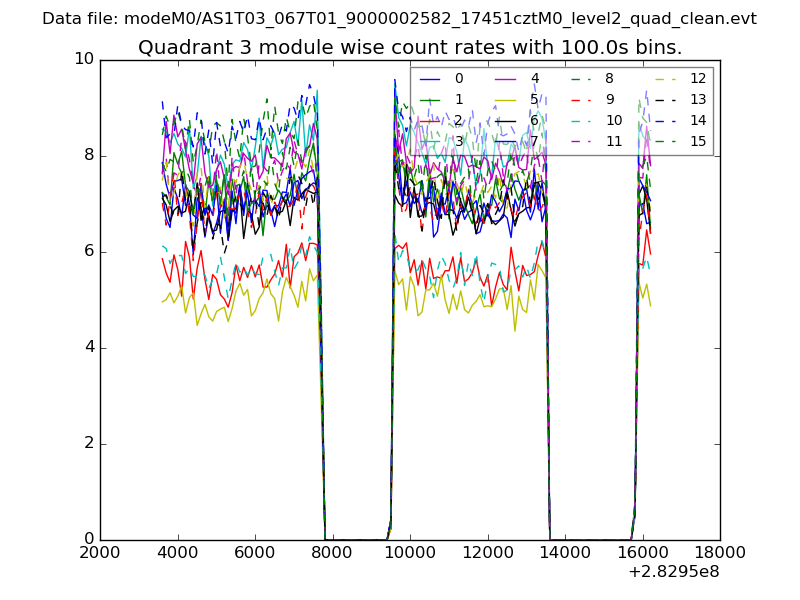
| Module-wise count rates for Quadrant C Data is divided into 100 sec bins |
 |
 |
| Module-wise count rates for Quadrant D Data is divided into 100 sec bins |
 |
 |
| Parameter | Plot |
|---|---|
| CZT HV Monitor | 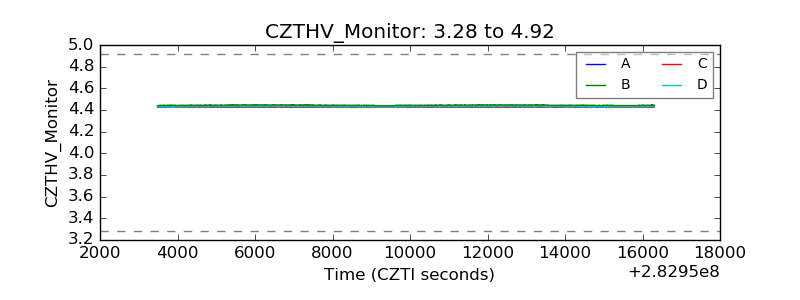 |
| D_VDD | 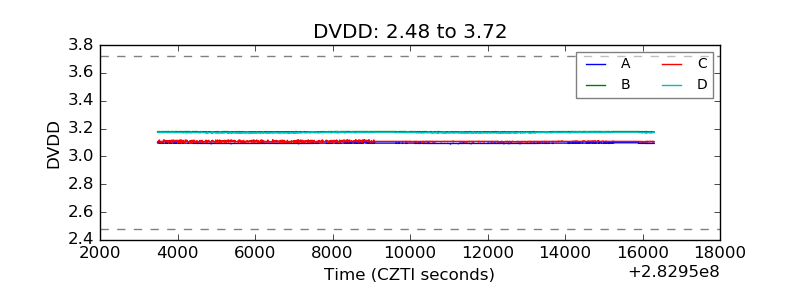 |
| Temperature 1 | 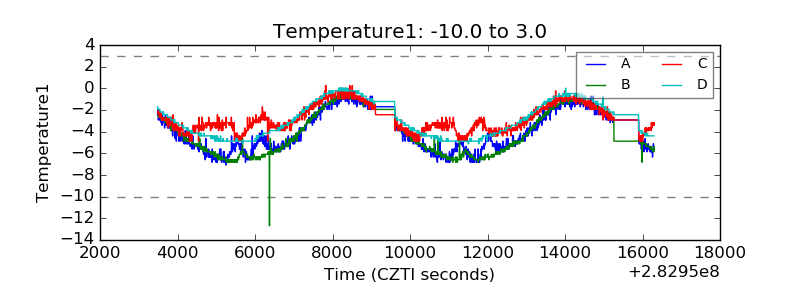 |
| Veto HV Monitor | 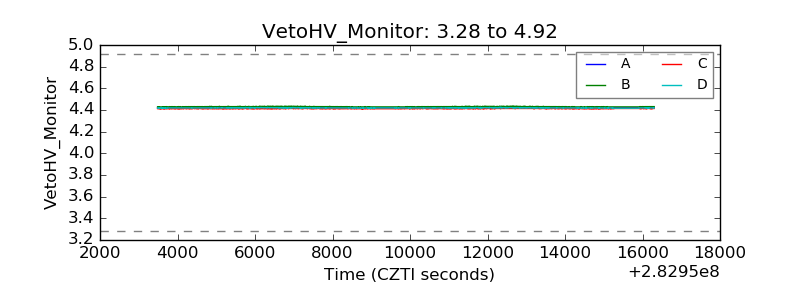 |
| Veto LLD | 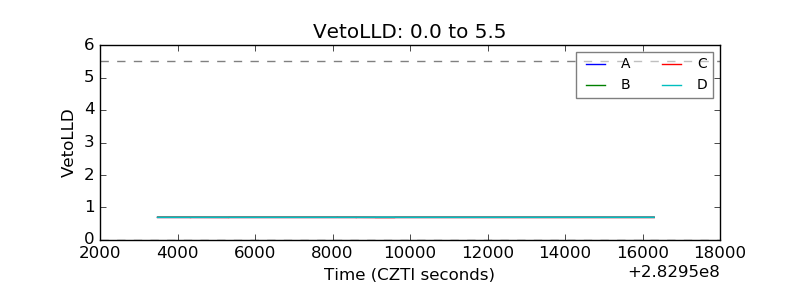 |
| Alpha Counter |  |
| _CPM_Rate | 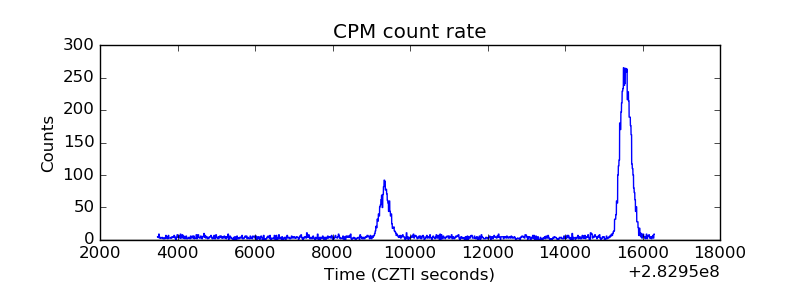 |
| CZT Counter | 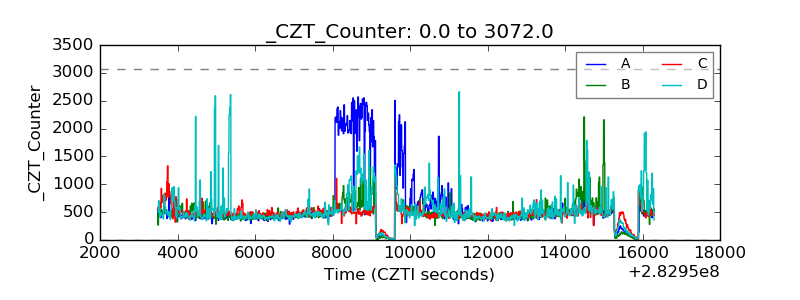 |
| +2.5 Volts monitor | 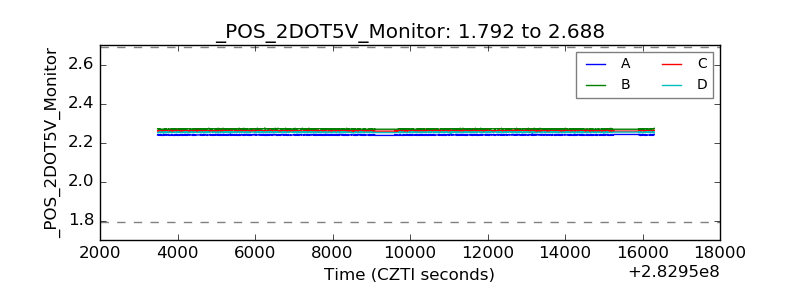 |
| +5 Volts monitor |  |
| _ROLL_ROT | 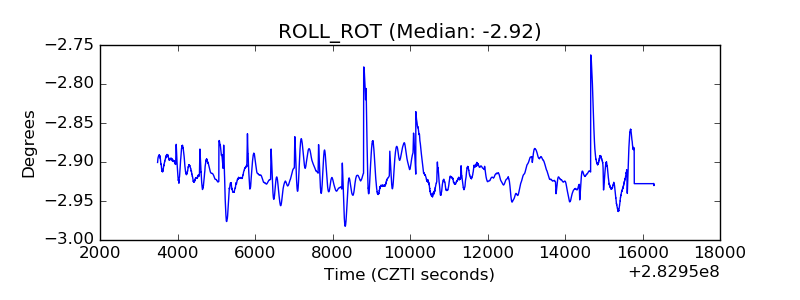 |
| _Roll_DEC | 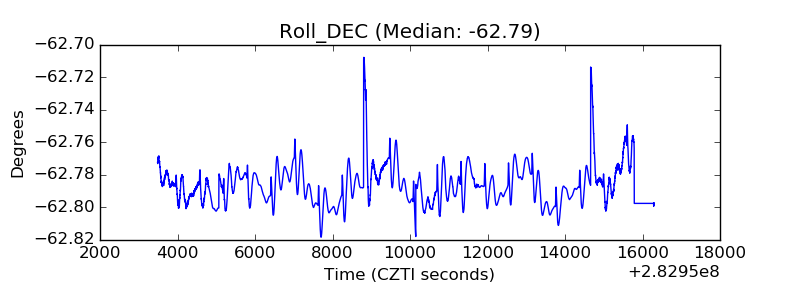 |
| _Roll_RA | 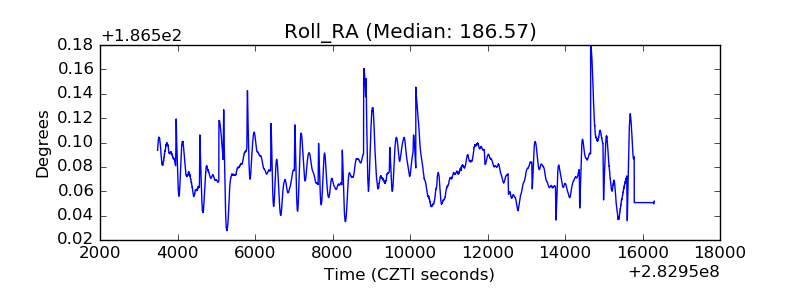 |
| Veto Counter | 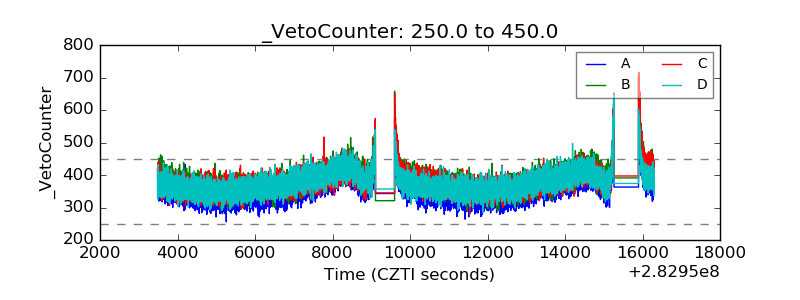 |