| Param | Original file | Final file |
|---|---|---|
| Filename | modeM0/AS1T03_067T01_9000002582_17453cztM0_level2.evt | modeM0/AS1T03_067T01_9000002582_17453cztM0_level2_quad_clean.evt |
| Size (bytes) | 1,424,862,720 | 243,679,680 |
| Size | 1.3 GB | 232.4 MB |
| Events in quadrant A | 8,208,479 | 1,573,923 |
| Events in quadrant B | 8,756,211 | 1,602,933 |
| Events in quadrant C | 9,404,606 | 1,539,660 |
| Events in quadrant D | 15,598,063 | 1,454,220 |
| Mode M0 | |||
|---|---|---|---|
| Quadrant | BADHDUFLAG | Total packets | Discarded packets |
| A | 0 | 35994 | 4 |
| B | 0 | 37532 | 4 |
| C | 0 | 38585 | 4 |
| D | 0 | 58518 | 4 |
| Mode SS | |||
|---|---|---|---|
| Quadrant | BADHDUFLAG | Total packets | Discarded packets |
| A | 0 | 356 | 0 |
| B | 0 | 356 | 0 |
| C | 0 | 356 | 0 |
| D | 0 | 356 | 0 |
| Mode M9 | |||
|---|---|---|---|
| Quadrant | BADHDUFLAG | Total packets | Discarded packets |
| A | 0 | 38 | 0 |
| B | 0 | 38 | 0 |
| C | 0 | 38 | 0 |
| D | 0 | 38 | 0 |
| Quadrant | Total seconds | Saturated seconds | Saturation percentage |
|---|---|---|---|
| A | 17562 | 59 | 0.335953% |
| B | 17562 | 116 | 0.660517% |
| C | 17561 | 233 | 1.326804% |
| D | 17562 | 2165 | 12.327753% |
Noise dominated data is calculated using 1-second bins in cleaned event files. If a bin has >2000 counts, and if more than 50% of those come from <1% of pixels, then it is considered to be noise-dominated and hence unusable.
| Quadrant | # 1 sec bins | Bins with >0 counts | Bins with >2000 counts | High rate bins dominated by noise | Noise dominated (total time) | Noise dominated (detector-on time) | Marked lightcurve |
|---|---|---|---|---|---|---|---|
| A | 21227 | 17566 | 7 | 7 | 0.03% | 0.04% | 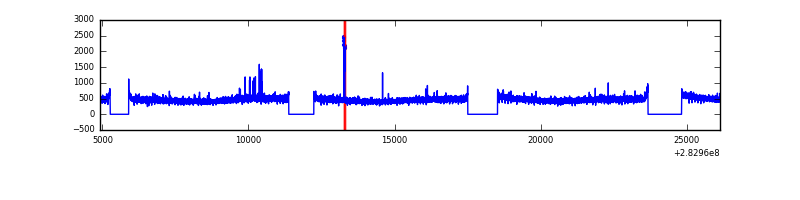 |
| B | 21227 | 17566 | 22 | 22 | 0.10% | 0.13% | 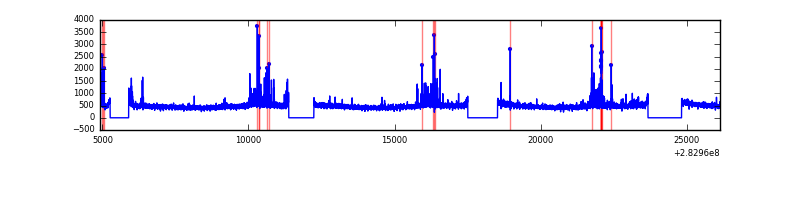 |
| C | 21226 | 17565 | 25 | 25 | 0.12% | 0.14% | 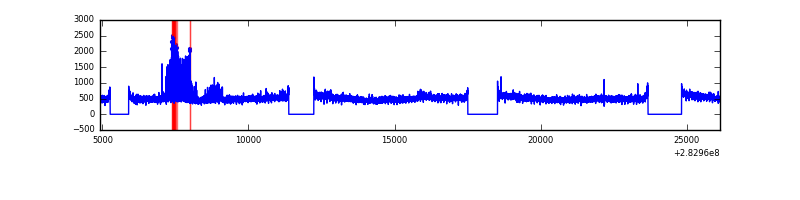 |
| D | 21227 | 17565 | 1922 | 1922 | 9.05% | 10.94% | 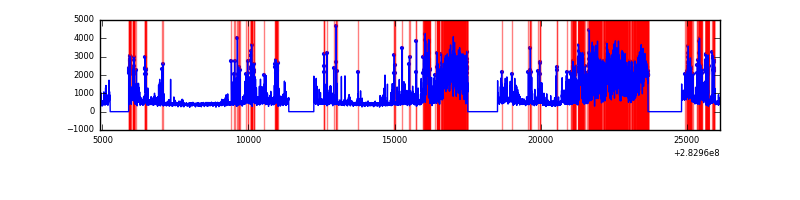 |
Top three noisy pixels from each quadrant. If the there are fewer than three noisy pixels in the level2.evt file, extra rows are filled as -1
| Pixel properties | Quadrant properties | ||||||
|---|---|---|---|---|---|---|---|
| Quadrant | DetID | PixID | Counts | Sigma | Mean | Median | Sigma |
| A | 14 | 237 | 68478 | 158.01 | 2104 | 2058 | 420.4 |
| A | 3 | 64 | 51392 | 117.36 | 2104 | 2058 | 420.4 |
| A | 0 | 226 | 18281 | 38.59 | 2104 | 2058 | 420.4 |
| B | 7 | 220 | 402443 | 1010.75 | 2104 | 2054 | 396.1 |
| B | 12 | 111 | 45529 | 109.75 | 2104 | 2054 | 396.1 |
| B | 11 | 111 | 38839 | 92.86 | 2104 | 2054 | 396.1 |
| C | 3 | 233 | 1002538 | 2119.49 | 2037 | 2052 | 472.0 |
| C | 14 | 238 | 317710 | 668.71 | 2037 | 2052 | 472.0 |
| C | 5 | 218 | 124071 | 258.49 | 2037 | 2052 | 472.0 |
| D | 11 | 176 | 5814257 | 12129.49 | 1975 | 1921 | 479.2 |
| D | 13 | 232 | 957223 | 1993.57 | 1975 | 1921 | 479.2 |
| D | 13 | 189 | 530669 | 1103.42 | 1975 | 1921 | 479.2 |
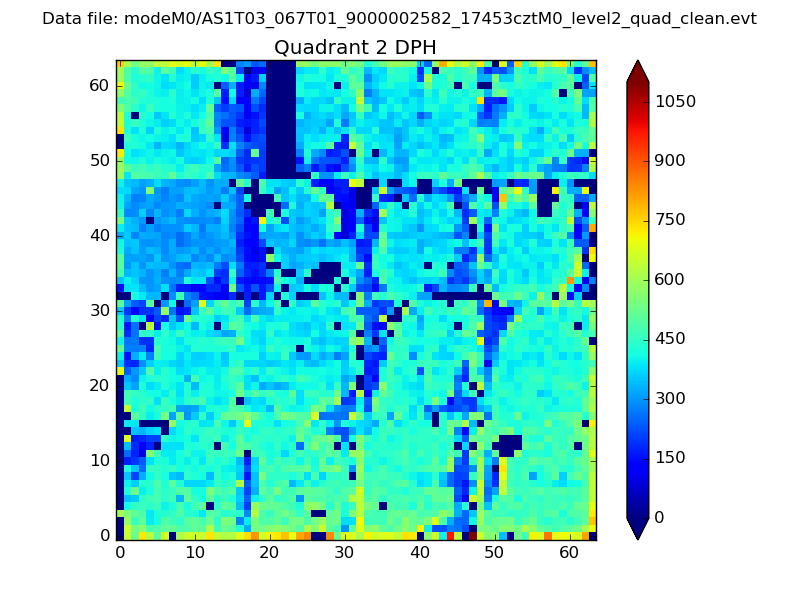
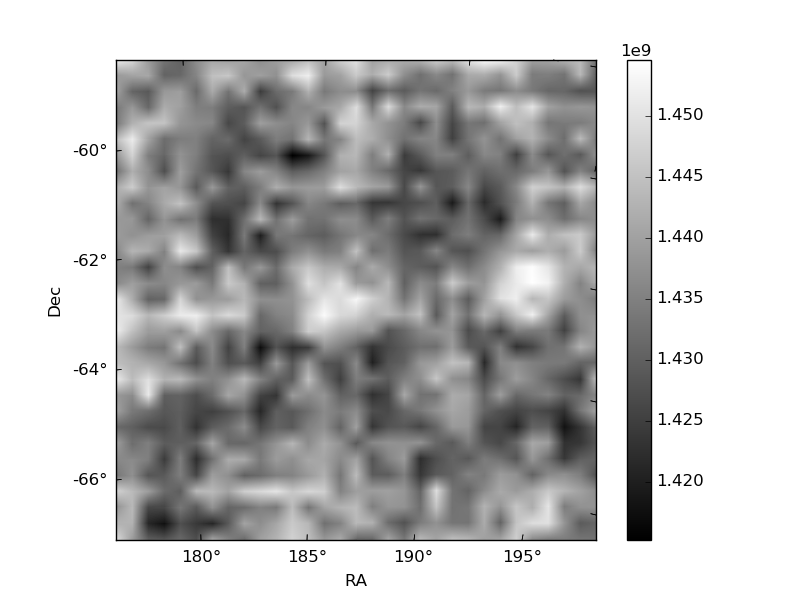
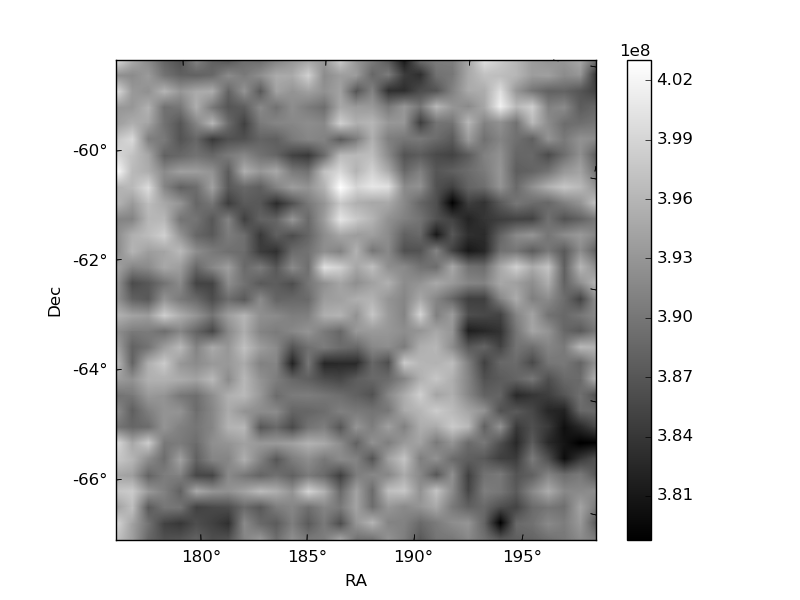
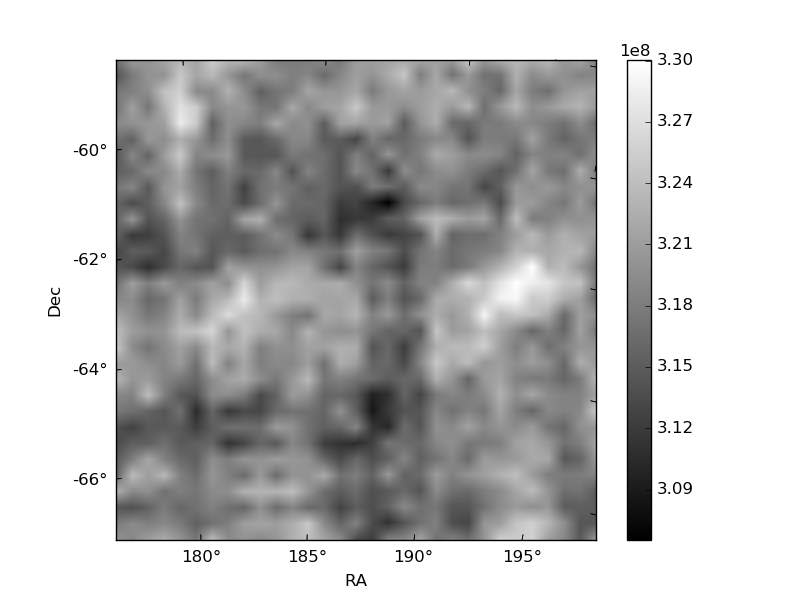
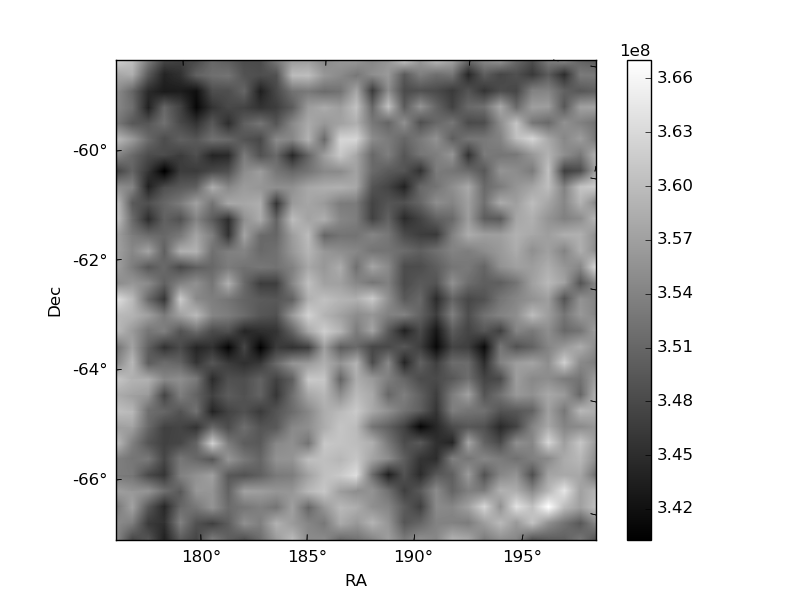
Histogram calculated using DETX and DETY for each event in the final _common_clean file
| Quadrant A | 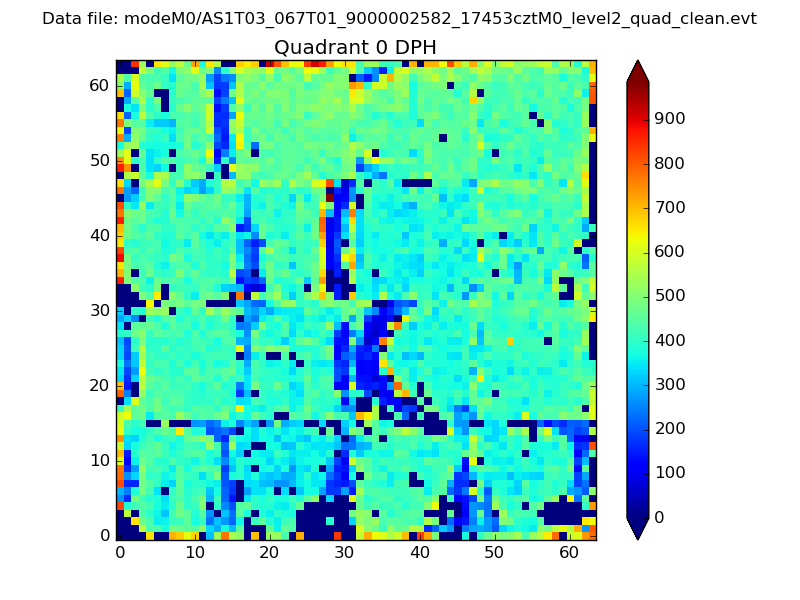 |
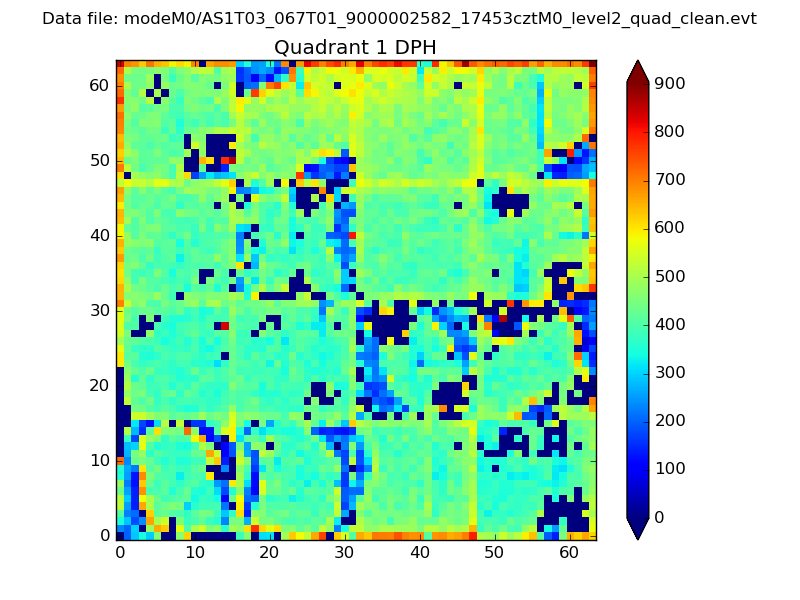 |
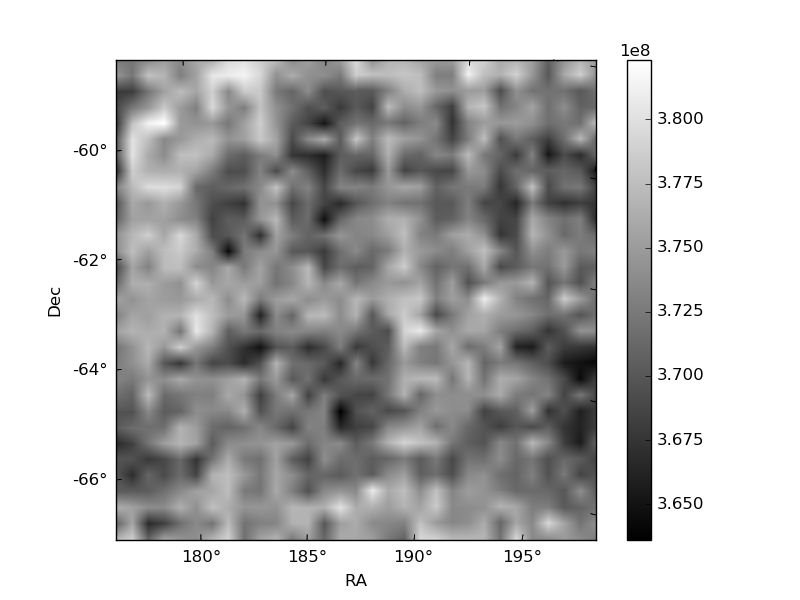
Quadrant B |
|---|---|---|---|
| Quadrant D | 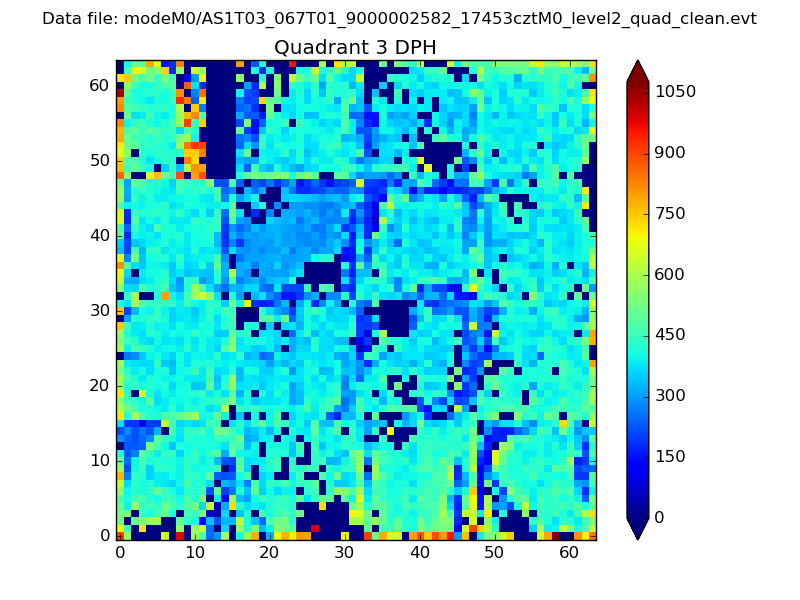 |
 |
Quadrant C |
| Plot type | Count rate plots | Images |
|---|---|---|
| Comparison with Poisson distribution Blue bars denote a histogram of data divided into 1 sec bins. Red curve is a Poisson curve with rate = median count rate of data. |
 |
 |
| Quadrant-wise count rates Data is divided into 100 sec bins |
 |
|
| Module-wise count rates for Quadrant A Data is divided into 100 sec bins |
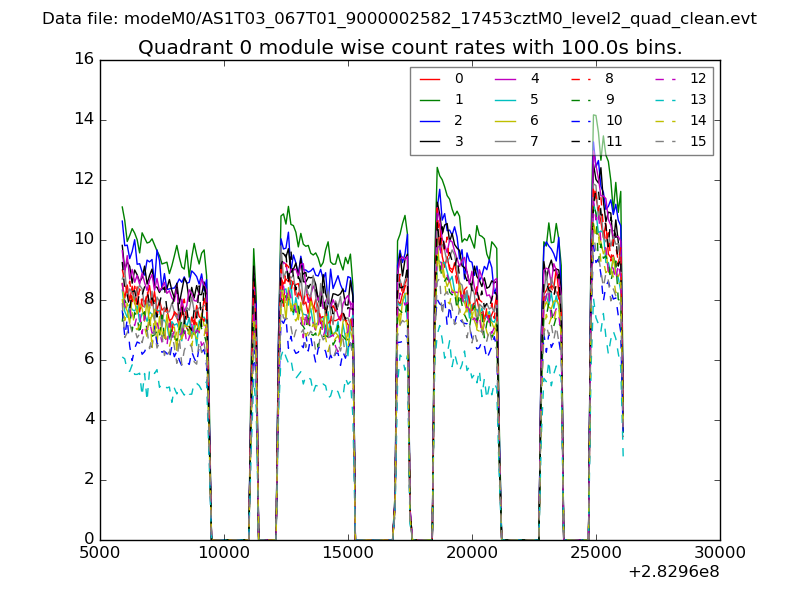 |
 |
| Module-wise count rates for Quadrant B Data is divided into 100 sec bins |
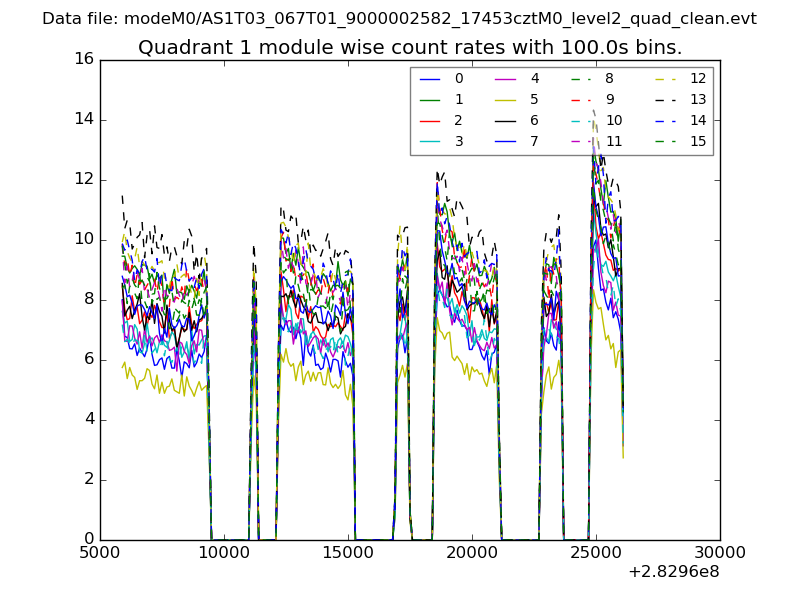 |
 |
| Module-wise count rates for Quadrant C Data is divided into 100 sec bins |
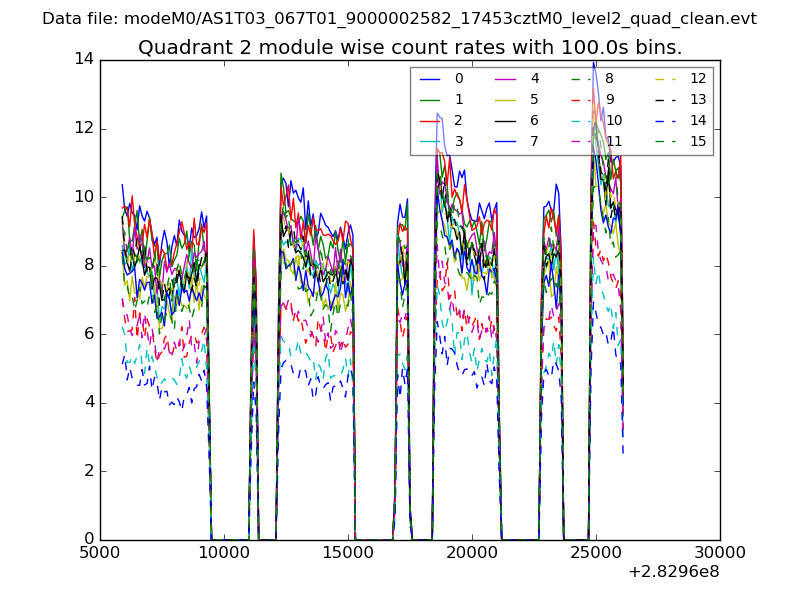 |
 |
| Module-wise count rates for Quadrant D Data is divided into 100 sec bins |
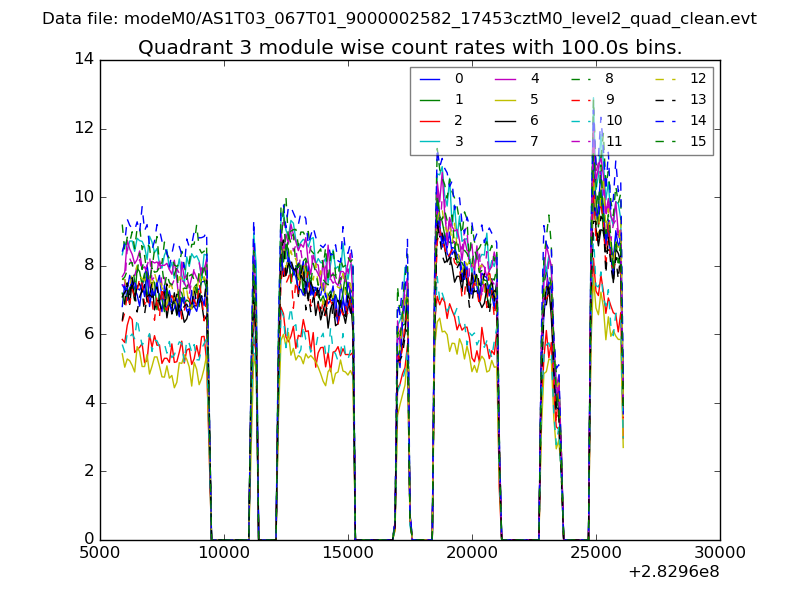 |
 |
| Parameter | Plot |
|---|---|
| CZT HV Monitor | 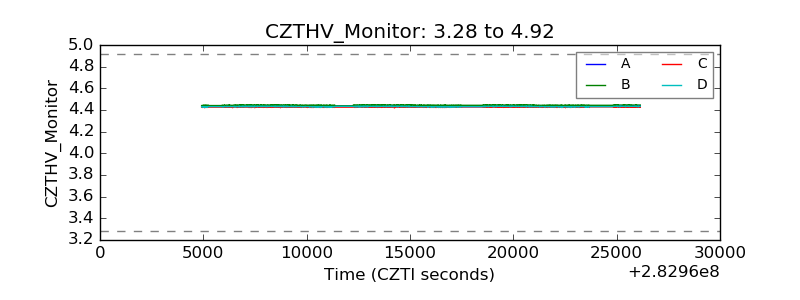 |
| D_VDD | 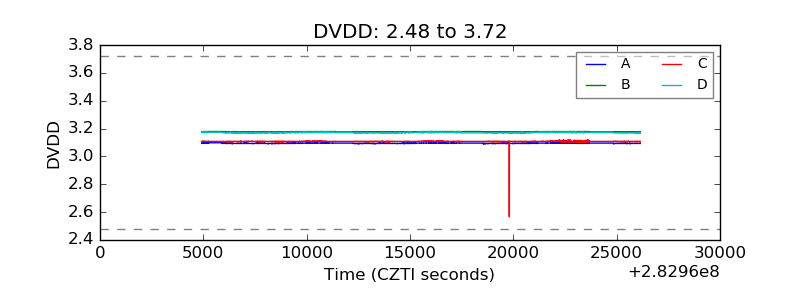 |
| Temperature 1 | 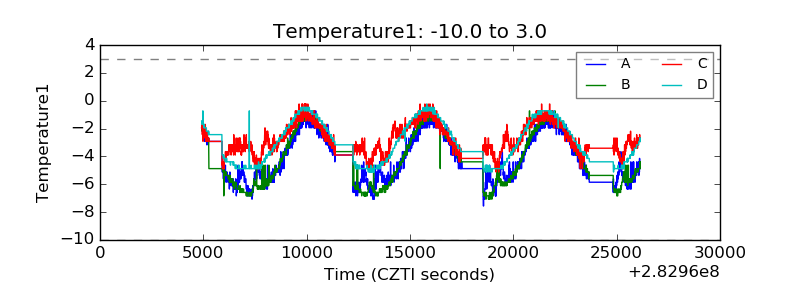 |
| Veto HV Monitor | 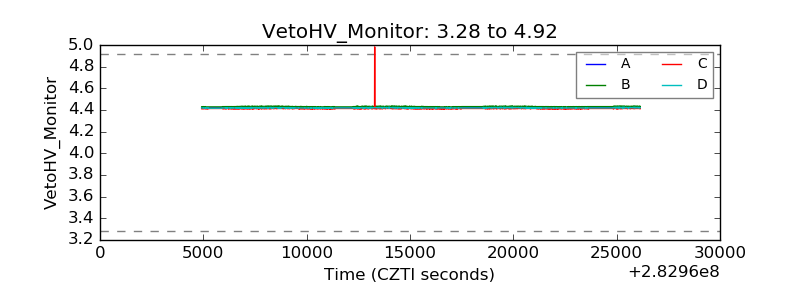 |
| Veto LLD | 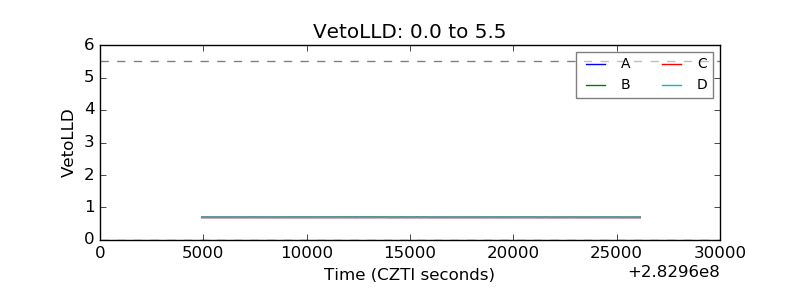 |
| Alpha Counter |  |
| _CPM_Rate | 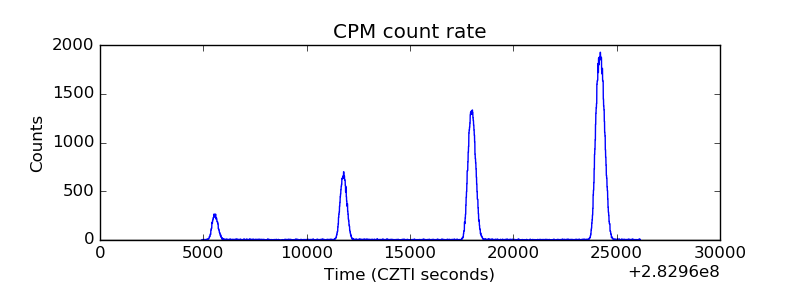 |
| CZT Counter | 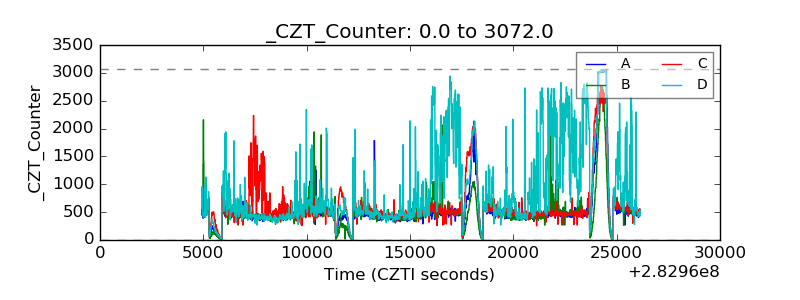 |
| +2.5 Volts monitor | 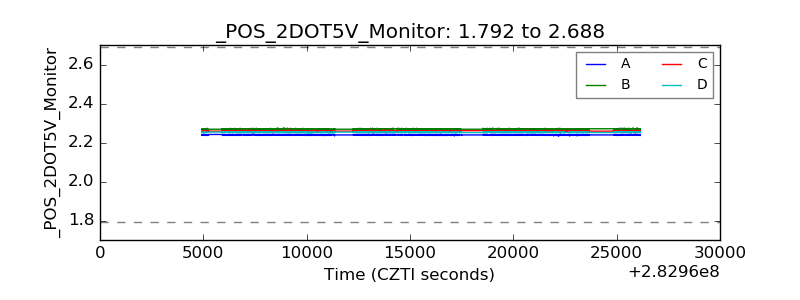 |
| +5 Volts monitor |  |
| _ROLL_ROT | 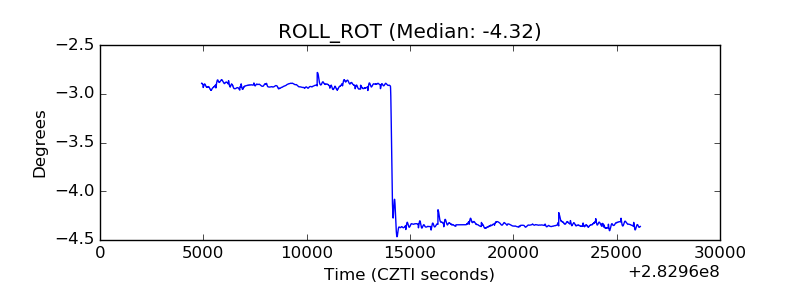 |
| _Roll_DEC |  |
| _Roll_RA | 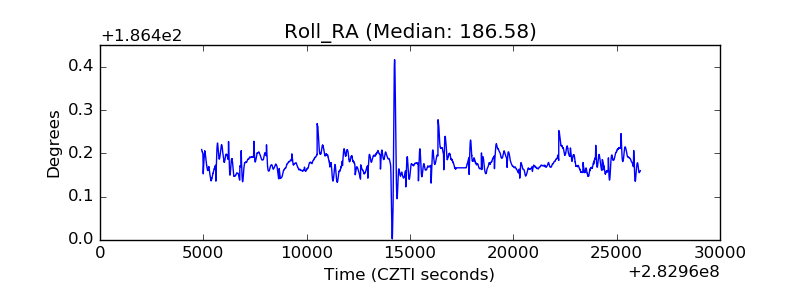 |
| Veto Counter | 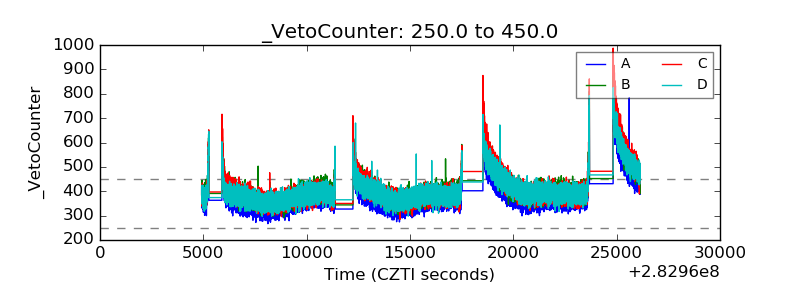 |