| Param | Original file | Final file |
|---|---|---|
| Filename | modeM0/AS1T03_067T01_9000002582_17455cztM0_level2.evt | modeM0/AS1T03_067T01_9000002582_17455cztM0_level2_quad_clean.evt |
| Size (bytes) | 464,143,680 | 97,295,040 |
| Size | 442.6 MB | 92.8 MB |
| Events in quadrant A | 2,979,455 | 651,864 |
| Events in quadrant B | 3,409,060 | 658,097 |
| Events in quadrant C | 3,014,547 | 625,175 |
| Events in quadrant D | 4,262,499 | 608,681 |
| Mode M0 | |||
|---|---|---|---|
| Quadrant | BADHDUFLAG | Total packets | Discarded packets |
| A | 0 | 12322 | 1 |
| B | 0 | 13678 | 1 |
| C | 0 | 12465 | 1 |
| D | 0 | 16452 | 1 |
| Mode SS | |||
|---|---|---|---|
| Quadrant | BADHDUFLAG | Total packets | Discarded packets |
| A | 0 | 118 | 0 |
| B | 0 | 118 | 0 |
| C | 0 | 118 | 0 |
| D | 0 | 118 | 0 |
| Mode M9 | |||
|---|---|---|---|
| Quadrant | BADHDUFLAG | Total packets | Discarded packets |
| A | 0 | 13 | 0 |
| B | 0 | 13 | 0 |
| C | 0 | 13 | 0 |
| D | 0 | 13 | 0 |
| Quadrant | Total seconds | Saturated seconds | Saturation percentage |
|---|---|---|---|
| A | 5759 | 66 | 1.146032% |
| B | 5760 | 67 | 1.163194% |
| C | 5760 | 88 | 1.527778% |
| D | 5760 | 224 | 3.888889% |
Noise dominated data is calculated using 1-second bins in cleaned event files. If a bin has >2000 counts, and if more than 50% of those come from <1% of pixels, then it is considered to be noise-dominated and hence unusable.
| Quadrant | # 1 sec bins | Bins with >0 counts | Bins with >2000 counts | High rate bins dominated by noise | Noise dominated (total time) | Noise dominated (detector-on time) | Marked lightcurve |
|---|---|---|---|---|---|---|---|
| A | 7059 | 5760 | 0 | 0 | 0.00% | 0.00% | 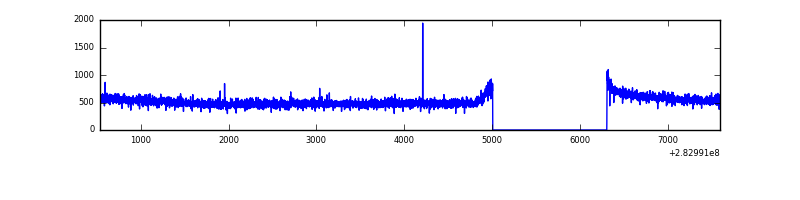 |
| B | 7060 | 5761 | 10 | 10 | 0.14% | 0.17% | 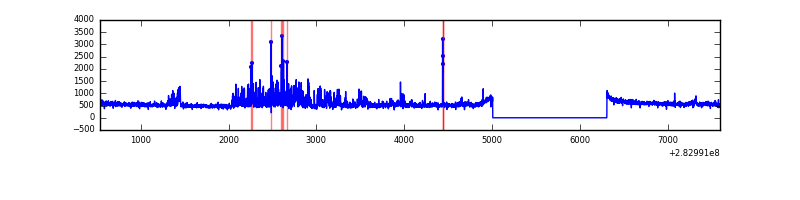 |
| C | 7060 | 5761 | 0 | 0 | 0.00% | 0.00% | 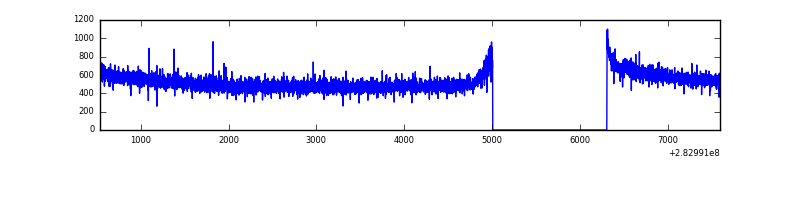 |
| D | 7060 | 5761 | 128 | 128 | 1.81% | 2.22% | 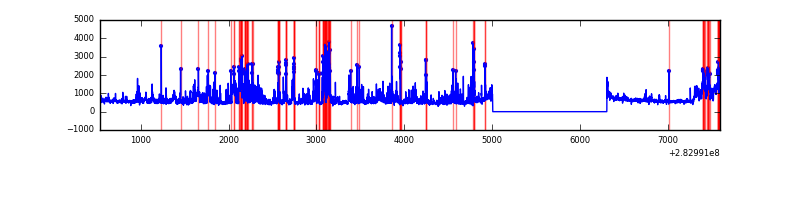 |
Top three noisy pixels from each quadrant. If the there are fewer than three noisy pixels in the level2.evt file, extra rows are filled as -1
| Pixel properties | Quadrant properties | ||||||
|---|---|---|---|---|---|---|---|
| Quadrant | DetID | PixID | Counts | Sigma | Mean | Median | Sigma |
| A | 0 | 226 | 7096 | 41.13 | 774 | 758 | 154.1 |
| A | 12 | 194 | 5850 | 33.05 | 774 | 758 | 154.1 |
| A | 3 | 137 | 4794 | 26.19 | 774 | 758 | 154.1 |
| B | 7 | 220 | 190157 | 1337.17 | 762 | 745 | 141.7 |
| B | 15 | 35 | 81493 | 570.05 | 762 | 745 | 141.7 |
| B | 4 | 216 | 44802 | 311.02 | 762 | 745 | 141.7 |
| C | 14 | 238 | 115457 | 668.18 | 738 | 745 | 171.7 |
| C | 3 | 233 | 11617 | 63.33 | 738 | 745 | 171.7 |
| C | 5 | 218 | 7717 | 40.61 | 738 | 745 | 171.7 |
| D | 11 | 176 | 605695 | 3366.78 | 752 | 733 | 179.7 |
| D | 13 | 232 | 516675 | 2871.36 | 752 | 733 | 179.7 |
| D | 15 | 0 | 88851 | 490.4 | 752 | 733 | 179.7 |
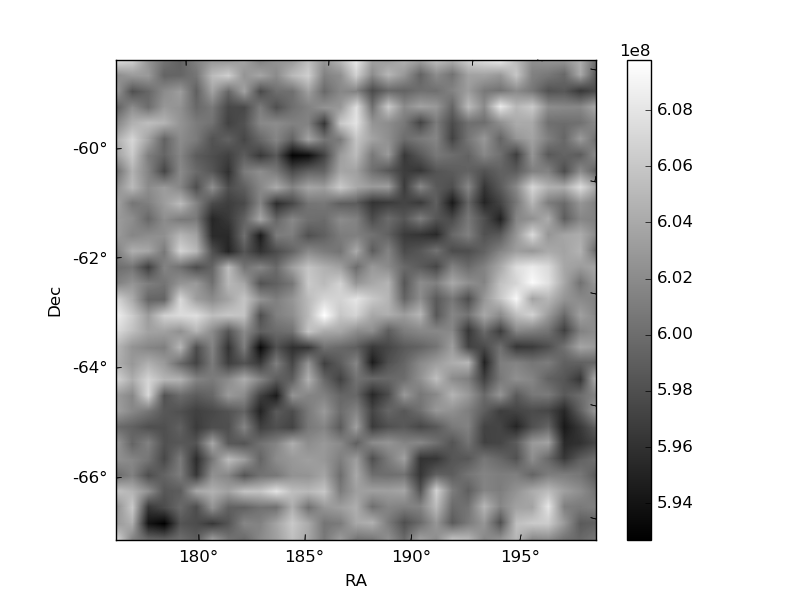
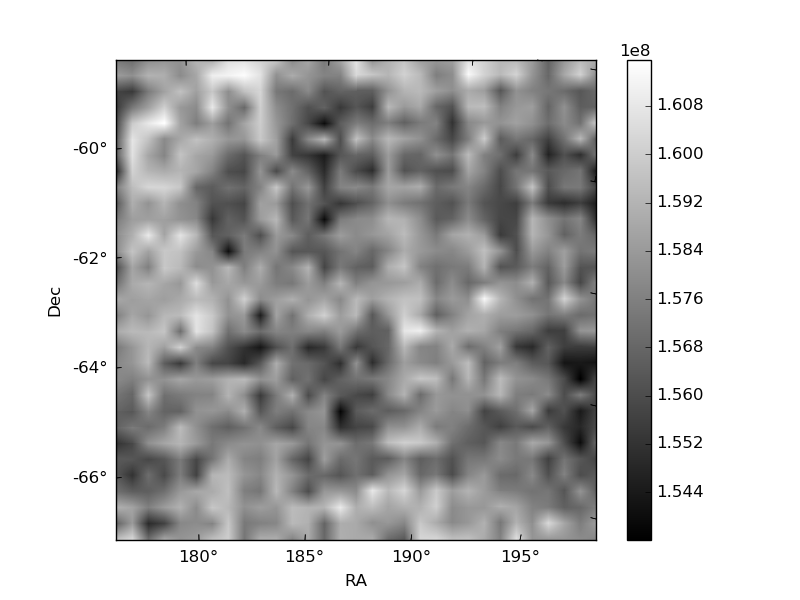
Histogram calculated using DETX and DETY for each event in the final _common_clean file
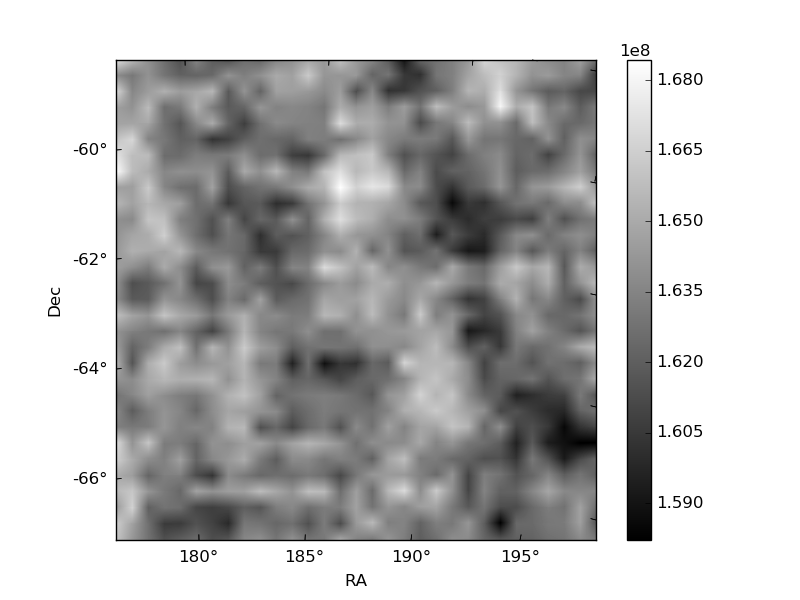
| Quadrant A | 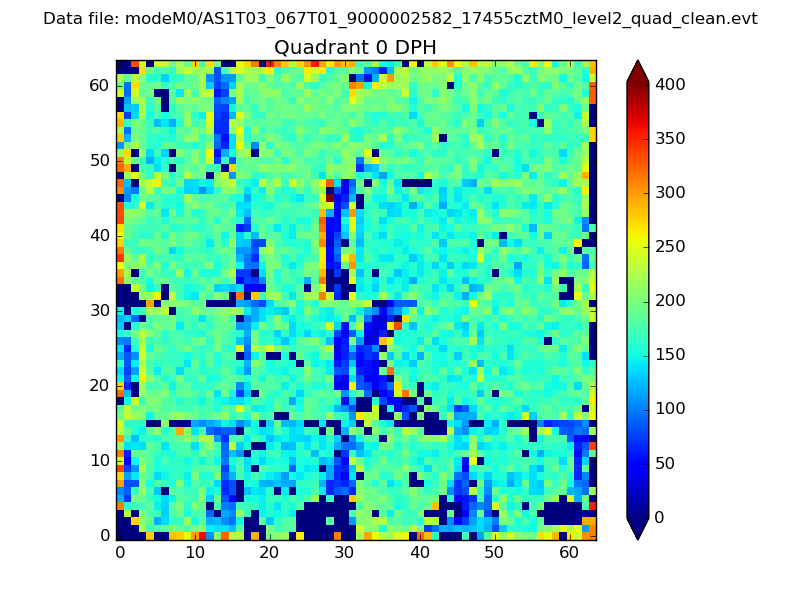 |
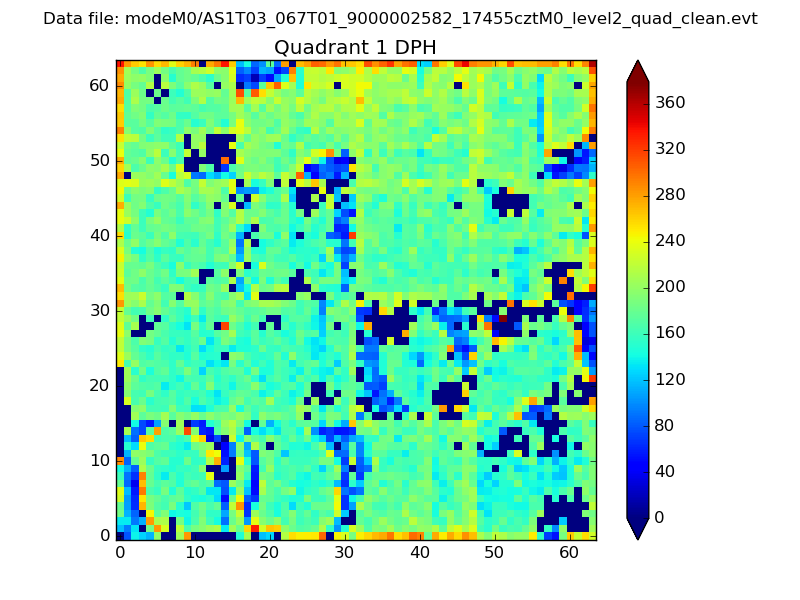 |
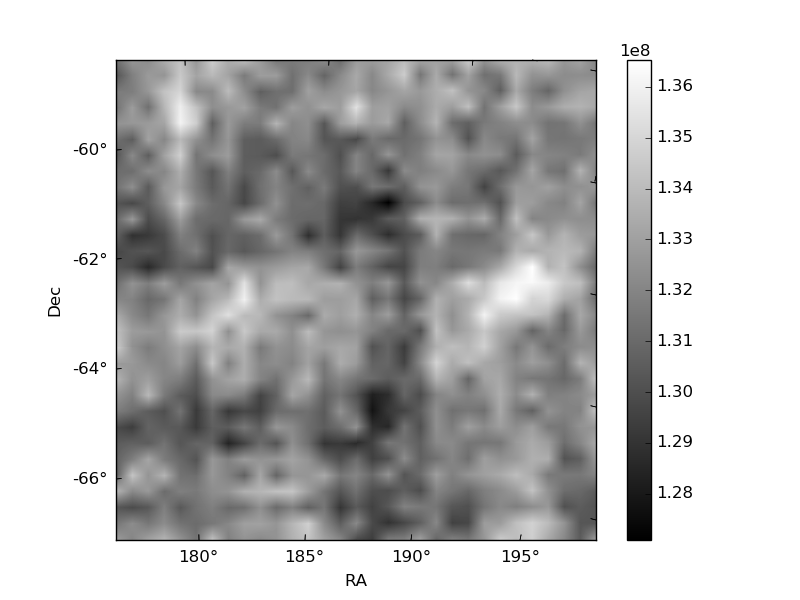
Quadrant B |
|---|---|---|---|
| Quadrant D | 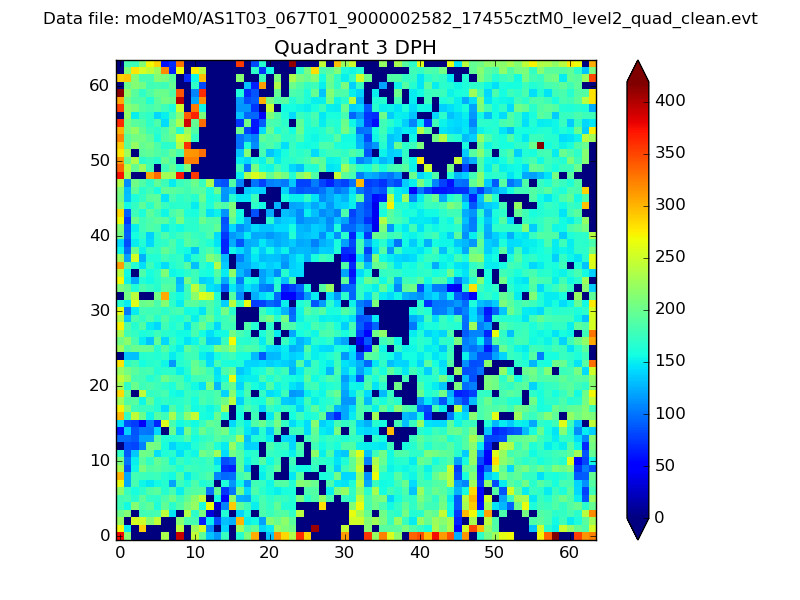 |
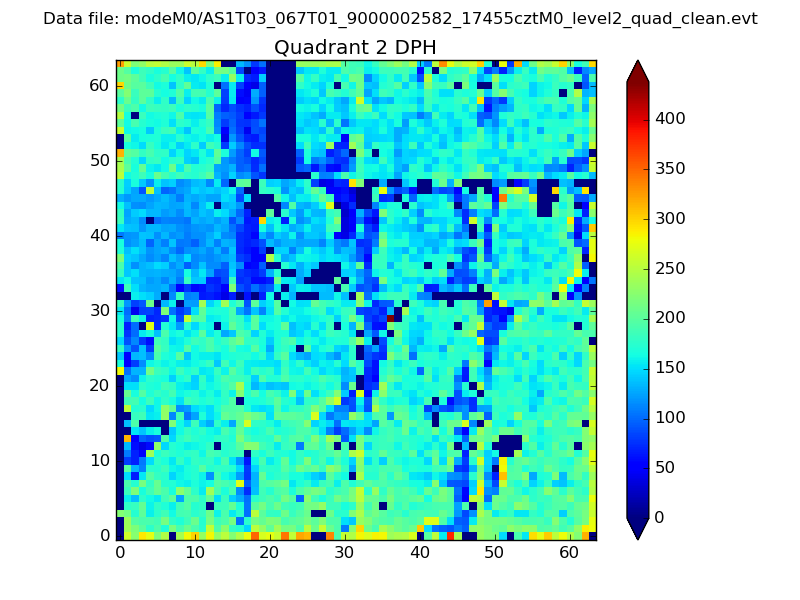 |
Quadrant C |
| Plot type | Count rate plots | Images |
|---|---|---|
| Comparison with Poisson distribution Blue bars denote a histogram of data divided into 1 sec bins. Red curve is a Poisson curve with rate = median count rate of data. |
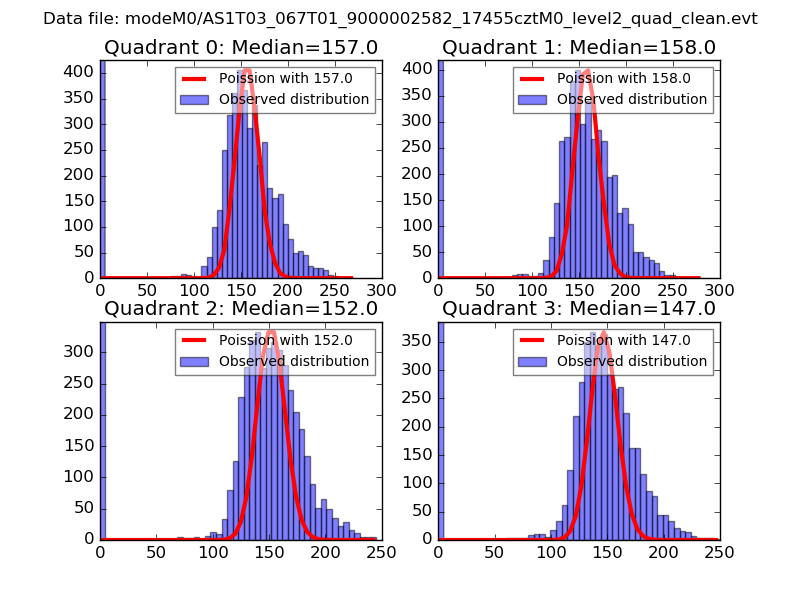 |
 |
| Quadrant-wise count rates Data is divided into 100 sec bins |
 |
|
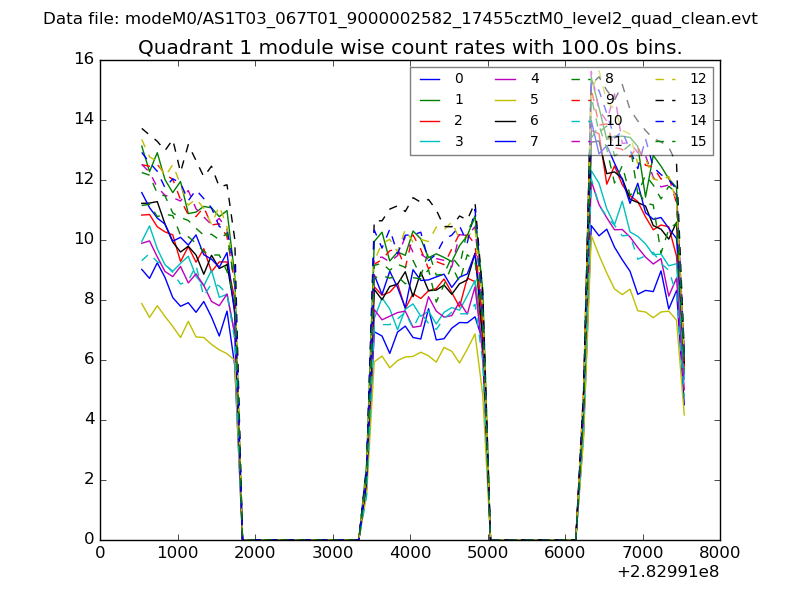
| Module-wise count rates for Quadrant A Data is divided into 100 sec bins |
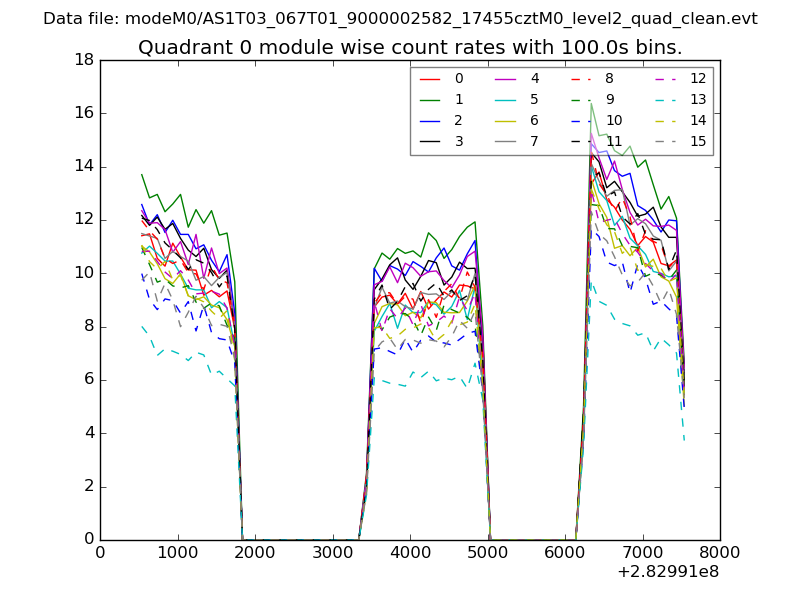 |
 |
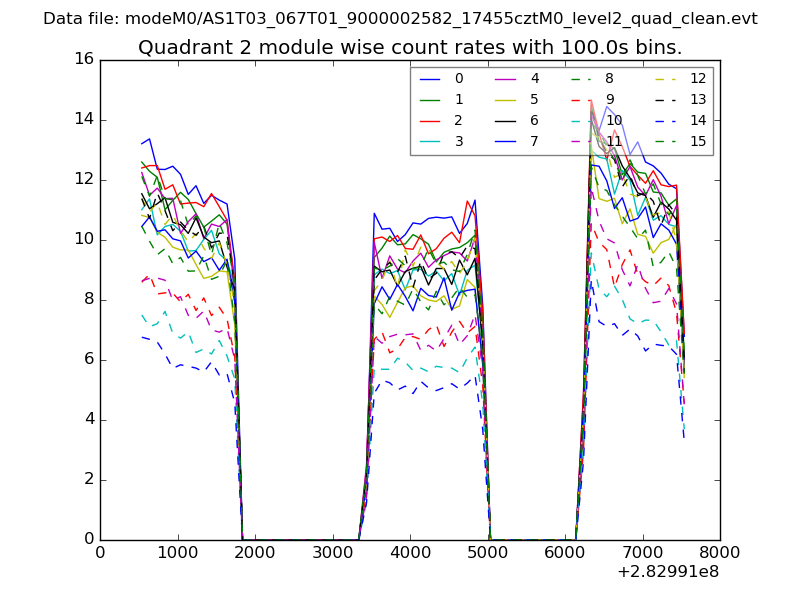
| Module-wise count rates for Quadrant B Data is divided into 100 sec bins |
 |
 |
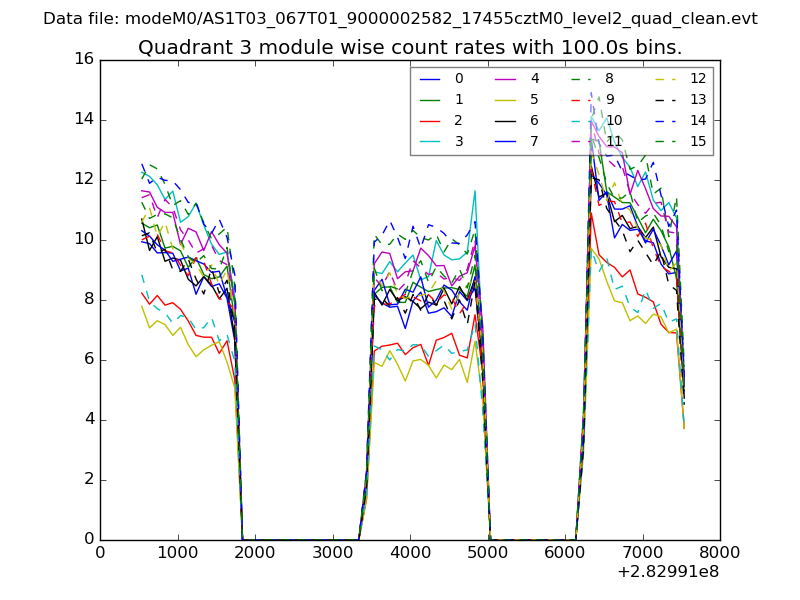
| Module-wise count rates for Quadrant C Data is divided into 100 sec bins |
 |
 |
| Module-wise count rates for Quadrant D Data is divided into 100 sec bins |
 |
 |
| Parameter | Plot |
|---|---|
| CZT HV Monitor |  |
| D_VDD | 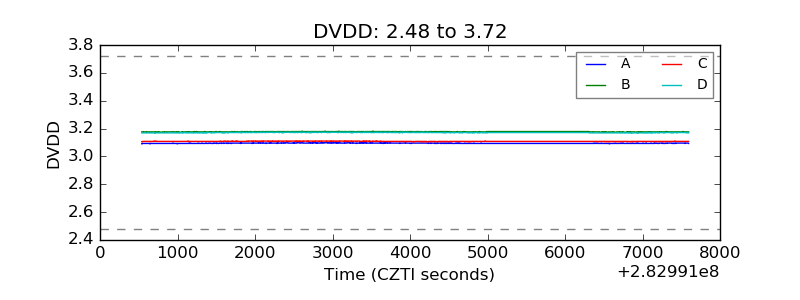 |
| Temperature 1 | 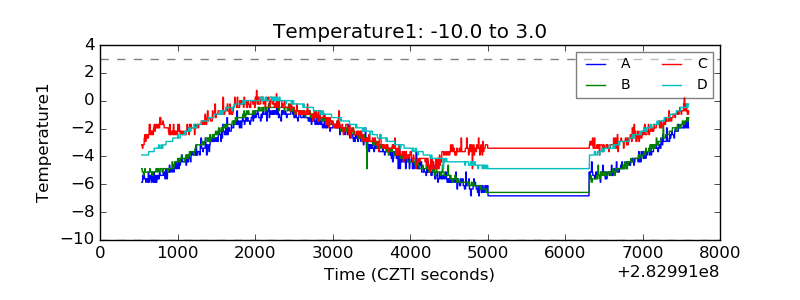 |
| Veto HV Monitor | 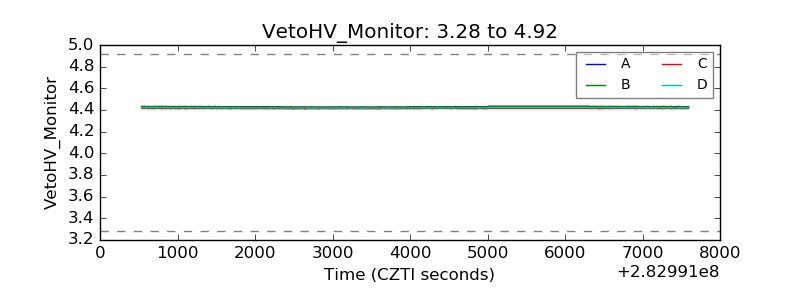 |
| Veto LLD | 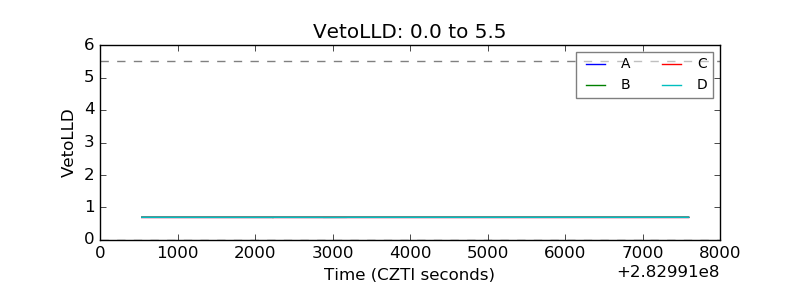 |
| Alpha Counter | 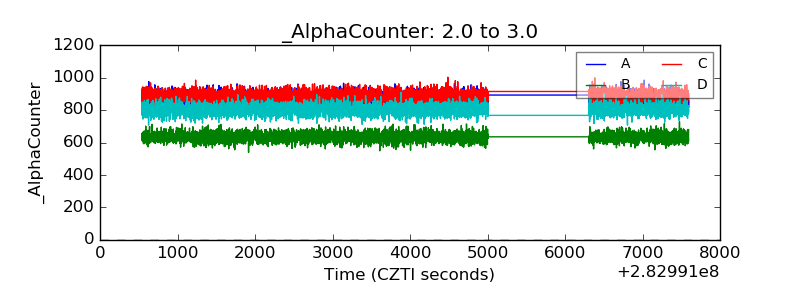 |
| _CPM_Rate | 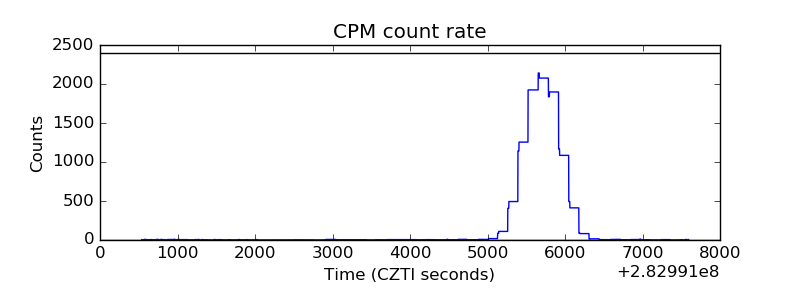 |
| CZT Counter | 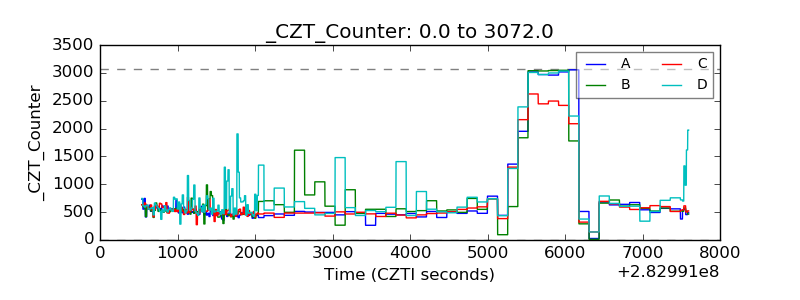 |
| +2.5 Volts monitor | 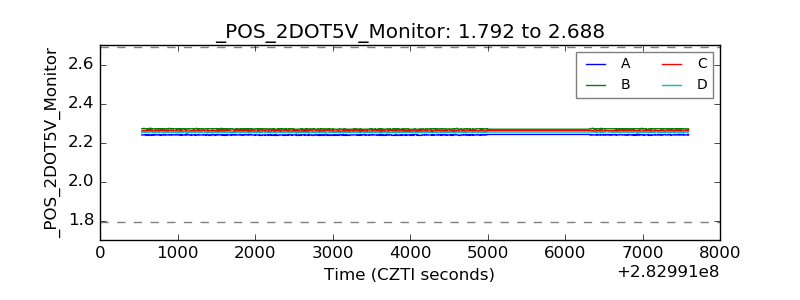 |
| +5 Volts monitor |  |
| _ROLL_ROT | 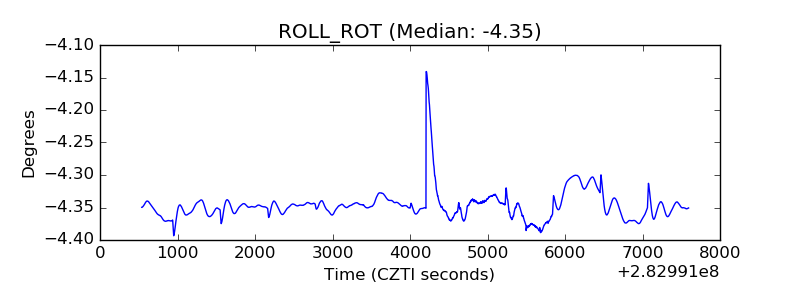 |
| _Roll_DEC | 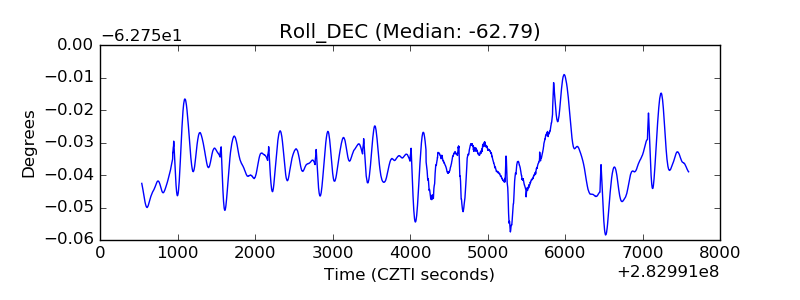 |
| _Roll_RA | 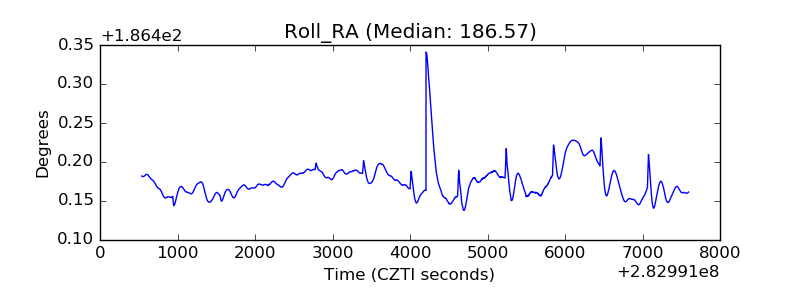 |
| Veto Counter | 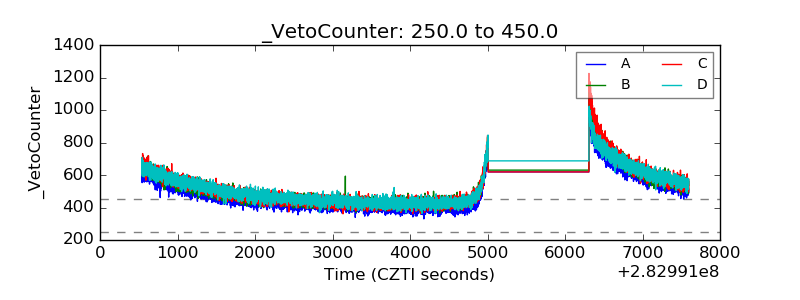 |