| Param | Original file | Final file |
|---|---|---|
| Filename | modeM0/AS1T03_067T01_9000002582_17457cztM0_level2.evt | modeM0/AS1T03_067T01_9000002582_17457cztM0_level2_quad_clean.evt |
| Size (bytes) | 499,855,680 | 90,938,880 |
| Size | 476.7 MB | 86.7 MB |
| Events in quadrant A | 3,430,948 | 592,499 |
| Events in quadrant B | 4,051,948 | 593,839 |
| Events in quadrant C | 3,381,667 | 559,702 |
| Events in quadrant D | 3,832,034 | 554,086 |
| Mode M0 | |||
|---|---|---|---|
| Quadrant | BADHDUFLAG | Total packets | Discarded packets |
| A | 0 | 14092 | 2 |
| B | 0 | 16144 | 2 |
| C | 0 | 13947 | 2 |
| D | 0 | 15545 | 2 |
| Mode SS | |||
|---|---|---|---|
| Quadrant | BADHDUFLAG | Total packets | Discarded packets |
| A | 0 | 132 | 0 |
| B | 0 | 132 | 0 |
| C | 0 | 132 | 0 |
| D | 0 | 132 | 0 |
| Mode M9 | |||
|---|---|---|---|
| Quadrant | BADHDUFLAG | Total packets | Discarded packets |
| A | 0 | 13 | 0 |
| B | 0 | 13 | 0 |
| C | 0 | 13 | 0 |
| D | 0 | 13 | 0 |
| Quadrant | Total seconds | Saturated seconds | Saturation percentage |
|---|---|---|---|
| A | 6506 | 93 | 1.429450% |
| B | 6507 | 148 | 2.274474% |
| C | 6507 | 128 | 1.967112% |
| D | 6507 | 144 | 2.213001% |
Noise dominated data is calculated using 1-second bins in cleaned event files. If a bin has >2000 counts, and if more than 50% of those come from <1% of pixels, then it is considered to be noise-dominated and hence unusable.
| Quadrant | # 1 sec bins | Bins with >0 counts | Bins with >2000 counts | High rate bins dominated by noise | Noise dominated (total time) | Noise dominated (detector-on time) | Marked lightcurve |
|---|---|---|---|---|---|---|---|
| A | 7821 | 6507 | 0 | 0 | 0.00% | 0.00% | 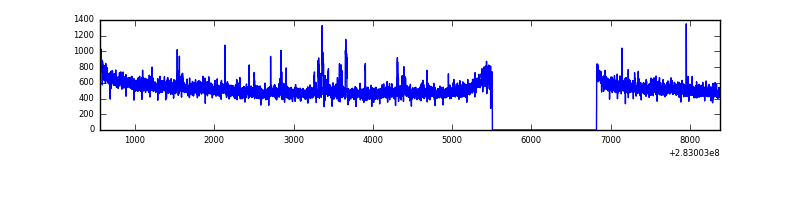 |
| B | 7822 | 6508 | 24 | 24 | 0.31% | 0.37% | 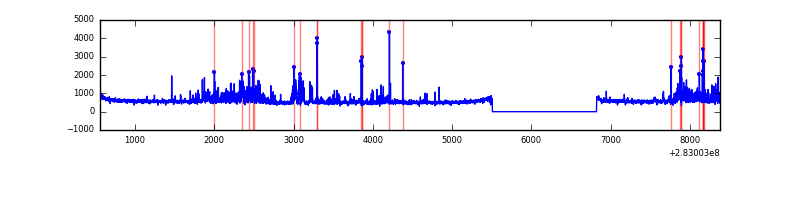 |
| C | 7822 | 6508 | 0 | 0 | 0.00% | 0.00% | 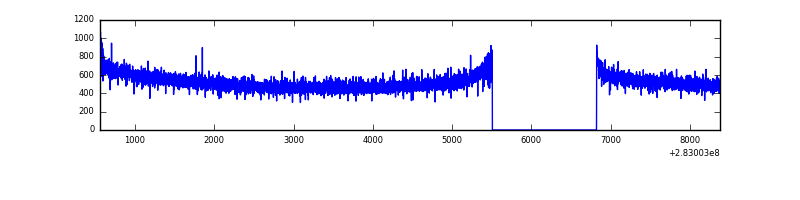 |
| D | 7822 | 6508 | 54 | 54 | 0.69% | 0.83% | 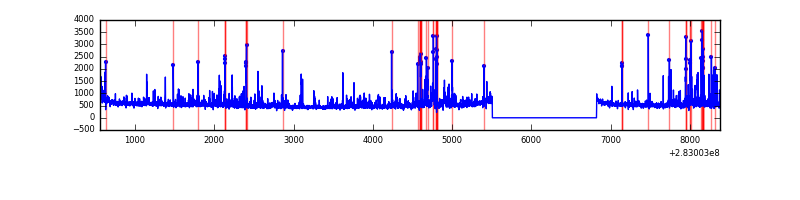 |
Top three noisy pixels from each quadrant. If the there are fewer than three noisy pixels in the level2.evt file, extra rows are filled as -1
| Pixel properties | Quadrant properties | ||||||
|---|---|---|---|---|---|---|---|
| Quadrant | DetID | PixID | Counts | Sigma | Mean | Median | Sigma |
| A | 6 | 16 | 80995 | 467.6 | 870 | 855 | 171.4 |
| A | 0 | 226 | 7852 | 40.83 | 870 | 855 | 171.4 |
| A | 12 | 194 | 6621 | 33.64 | 870 | 855 | 171.4 |
| B | 7 | 220 | 303051 | 1934.71 | 858 | 843 | 156.2 |
| B | 15 | 35 | 156509 | 996.56 | 858 | 843 | 156.2 |
| B | 4 | 216 | 64464 | 407.3 | 858 | 843 | 156.2 |
| C | 14 | 238 | 128870 | 683.88 | 819 | 826 | 187.2 |
| C | 3 | 233 | 23281 | 119.93 | 819 | 826 | 187.2 |
| C | 5 | 218 | 22502 | 115.77 | 819 | 826 | 187.2 |
| D | 13 | 232 | 263458 | 1298.18 | 841 | 818 | 202.3 |
| D | 13 | 189 | 188255 | 926.46 | 841 | 818 | 202.3 |
| D | 13 | 168 | 32987 | 159.0 | 841 | 818 | 202.3 |
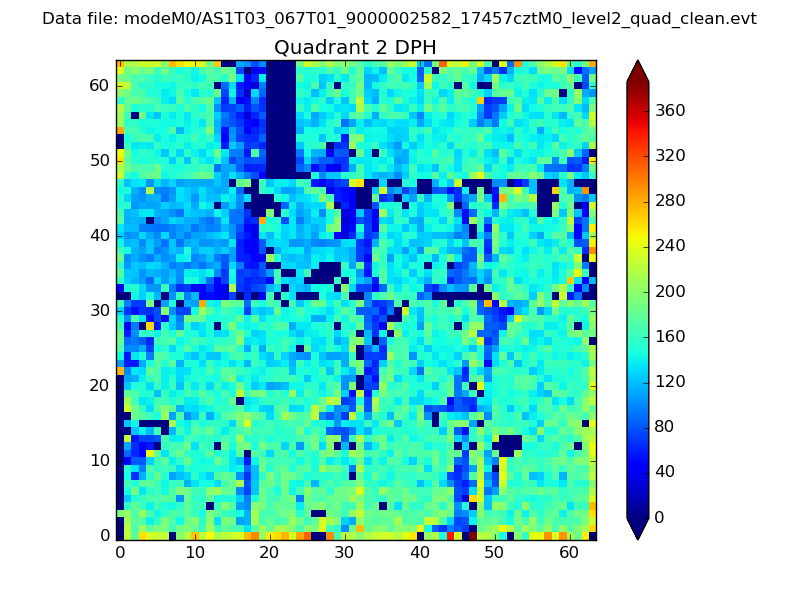
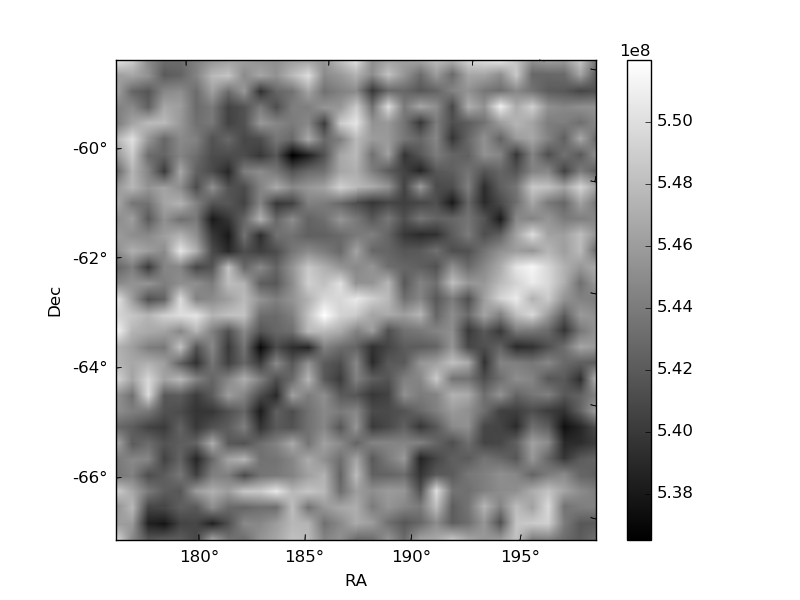
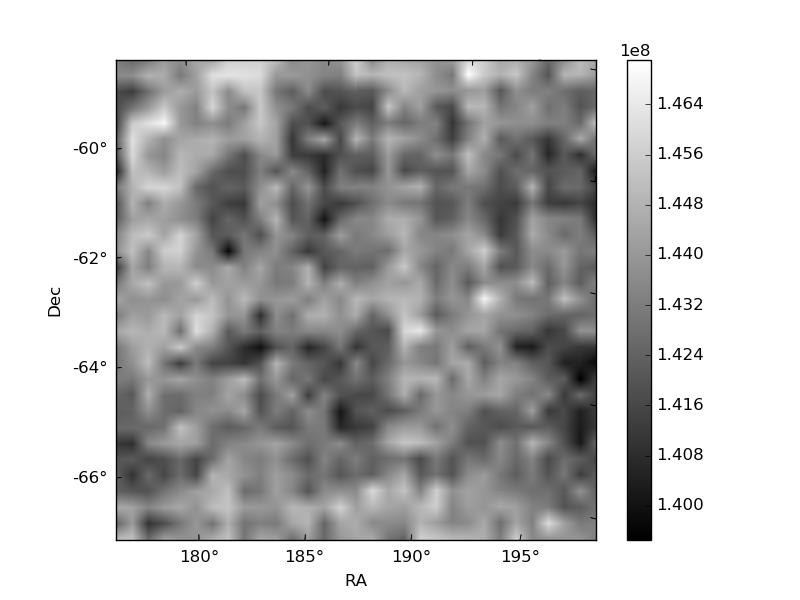
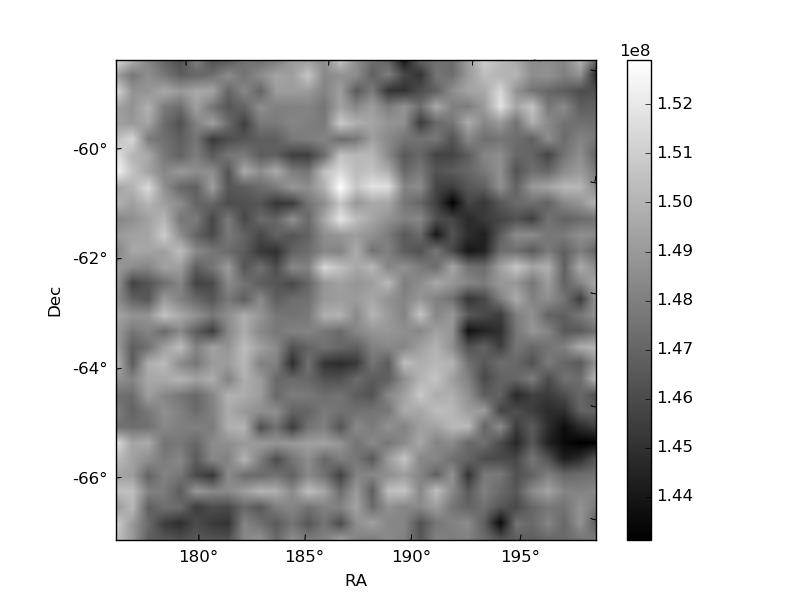
Histogram calculated using DETX and DETY for each event in the final _common_clean file
| Quadrant A | 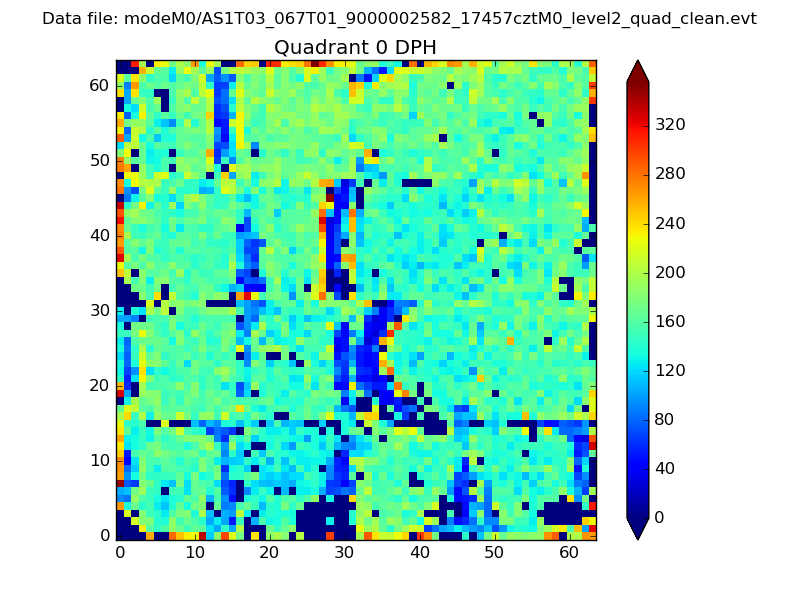 |
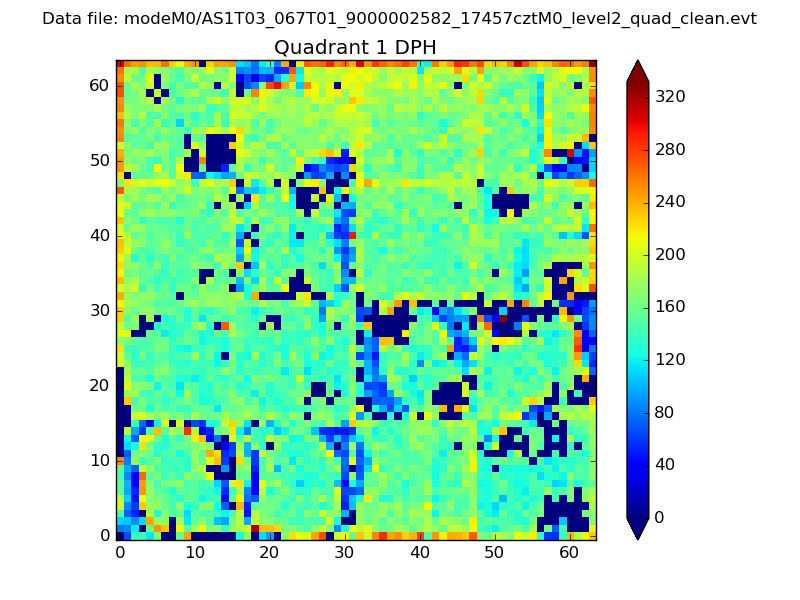 |
Quadrant B |
|---|---|---|---|
| Quadrant D | 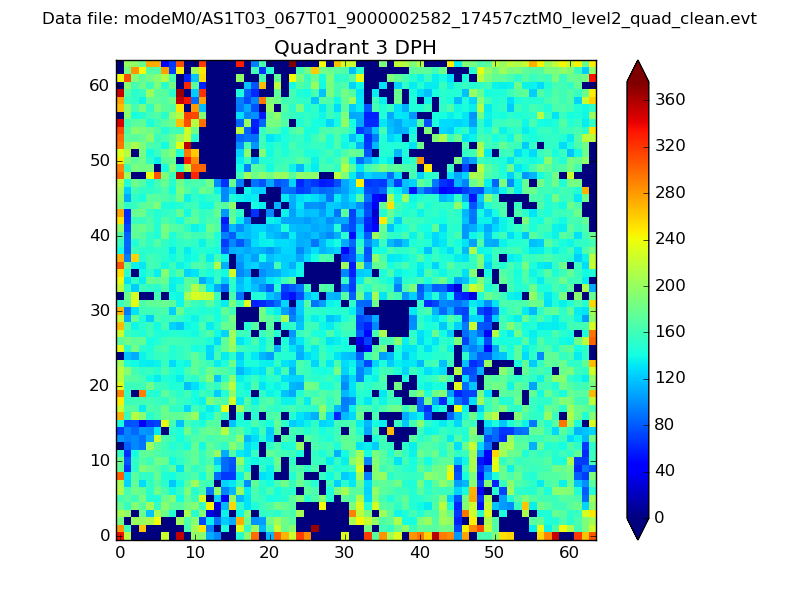 |
 |
Quadrant C |
| Plot type | Count rate plots | Images |
|---|---|---|
| Comparison with Poisson distribution Blue bars denote a histogram of data divided into 1 sec bins. Red curve is a Poisson curve with rate = median count rate of data. |
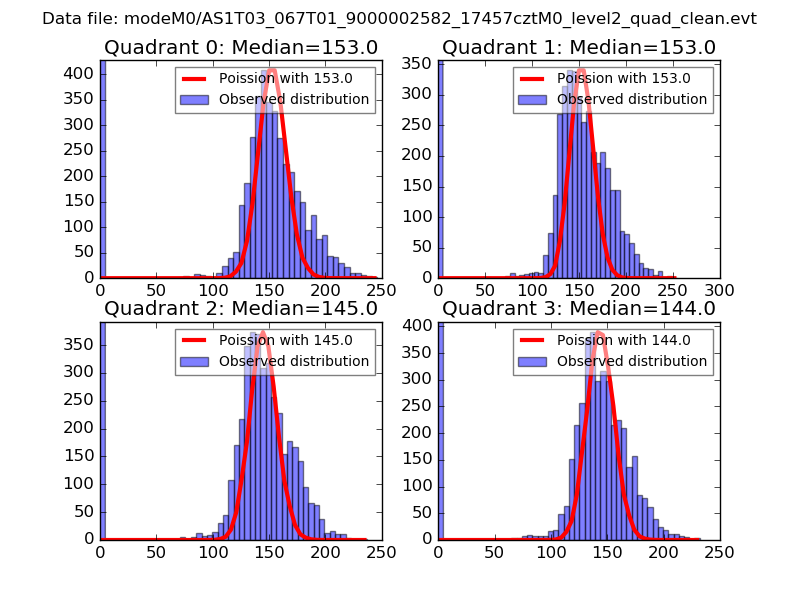 |
 |
| Quadrant-wise count rates Data is divided into 100 sec bins |
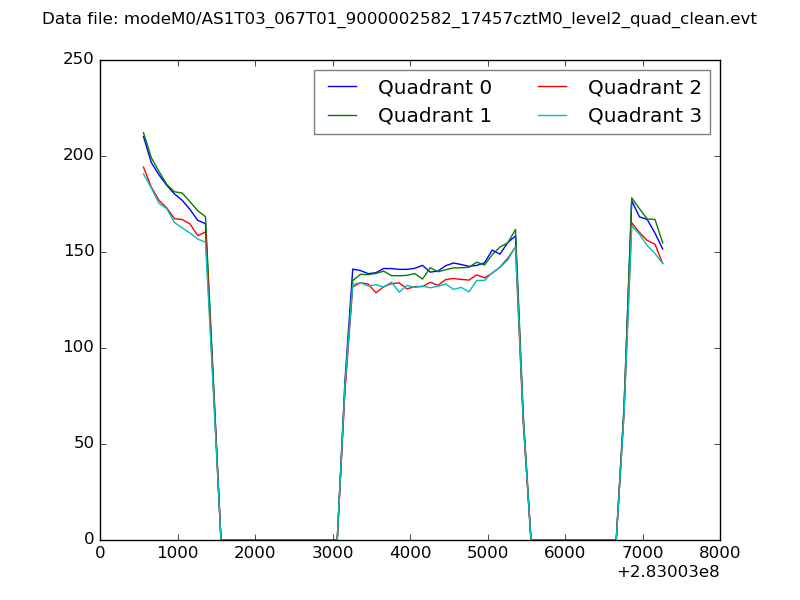 |
|
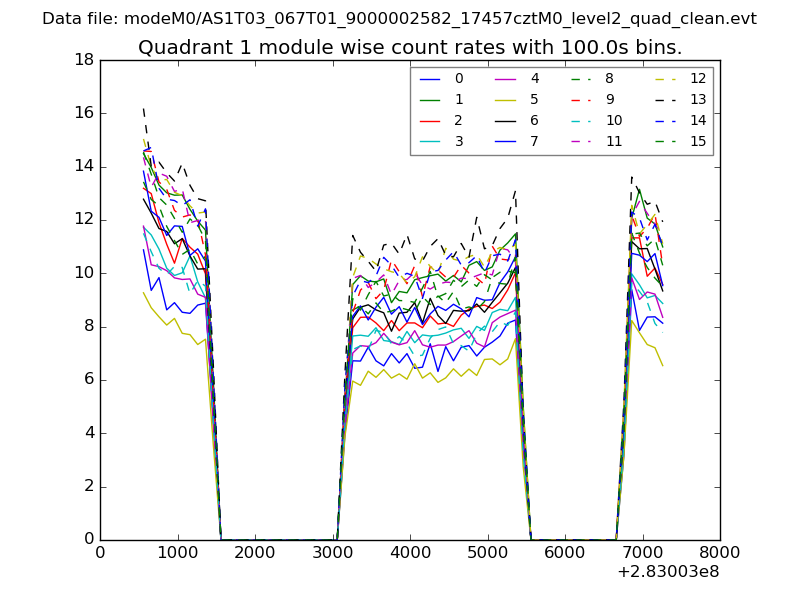
| Module-wise count rates for Quadrant A Data is divided into 100 sec bins |
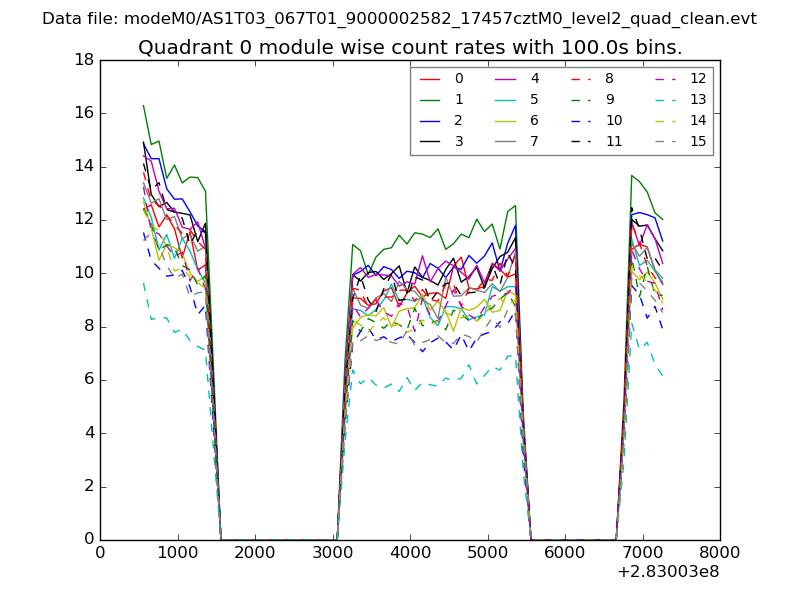 |
 |
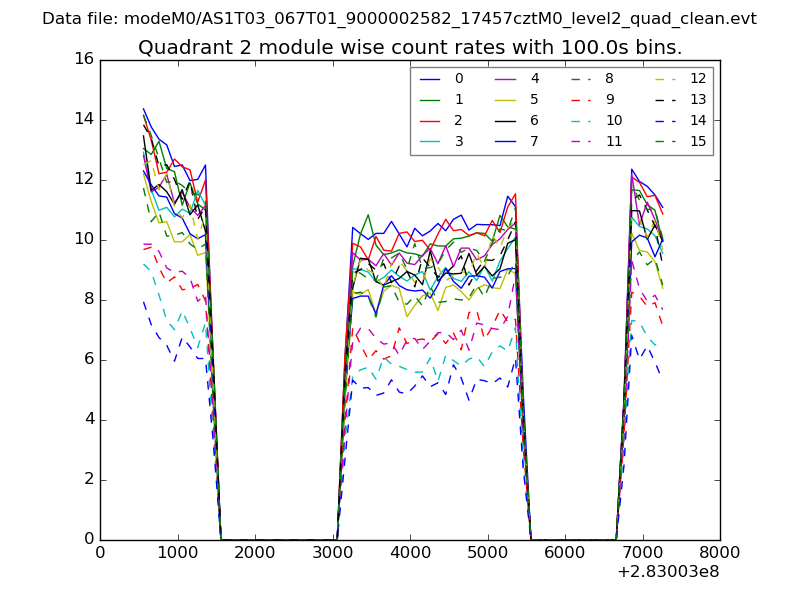
| Module-wise count rates for Quadrant B Data is divided into 100 sec bins |
 |
 |
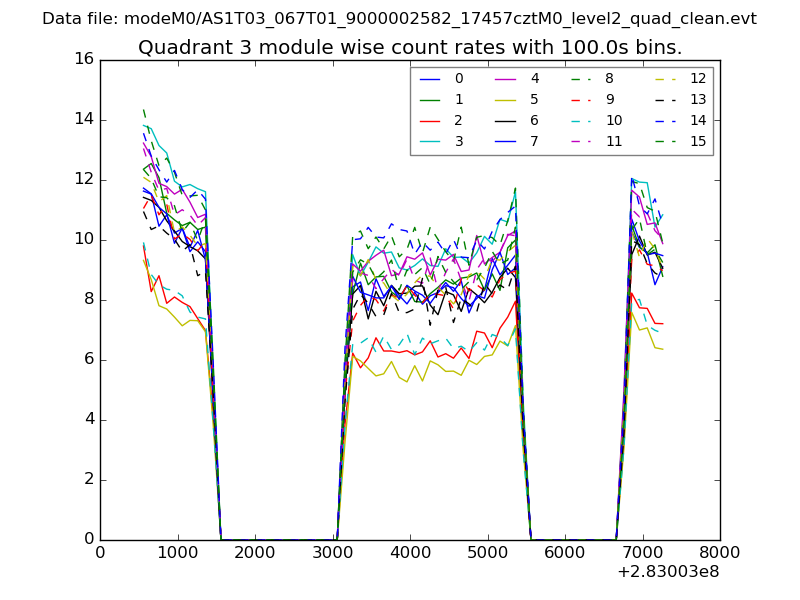
| Module-wise count rates for Quadrant C Data is divided into 100 sec bins |
 |
 |
| Module-wise count rates for Quadrant D Data is divided into 100 sec bins |
 |
 |
| Parameter | Plot |
|---|---|
| CZT HV Monitor | 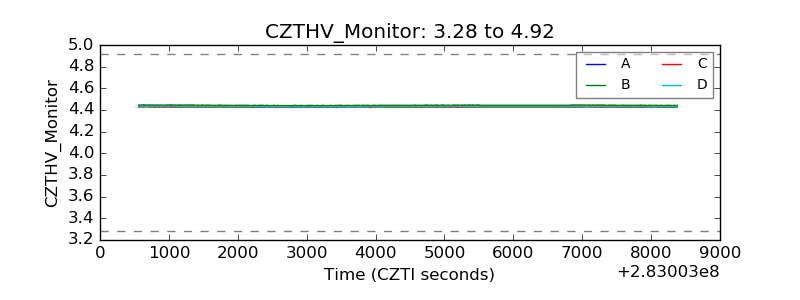 |
| D_VDD | 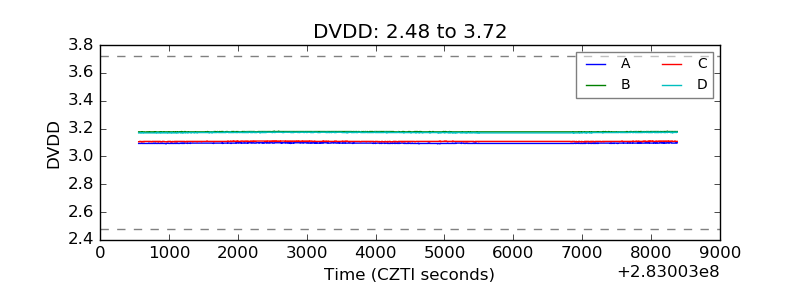 |
| Temperature 1 | 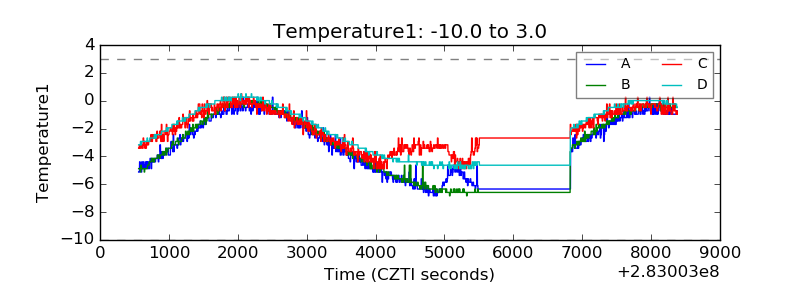 |
| Veto HV Monitor | 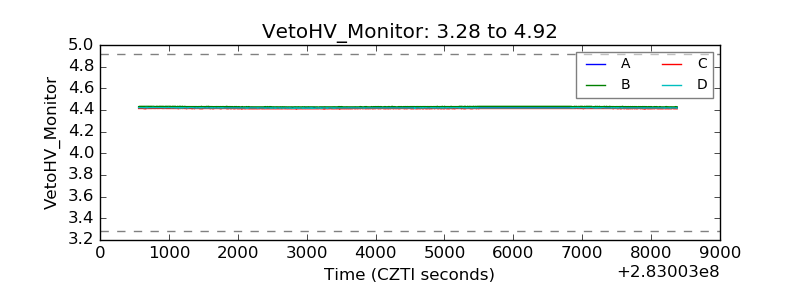 |
| Veto LLD | 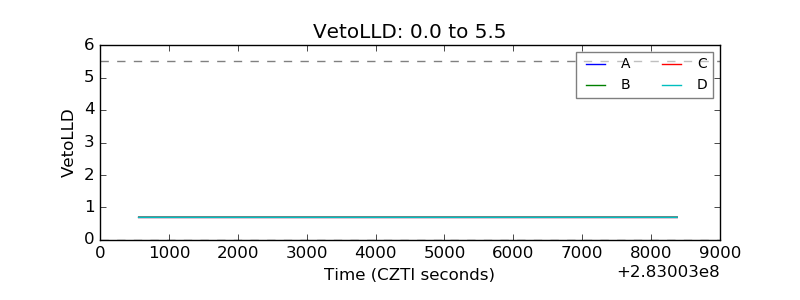 |
| Alpha Counter | 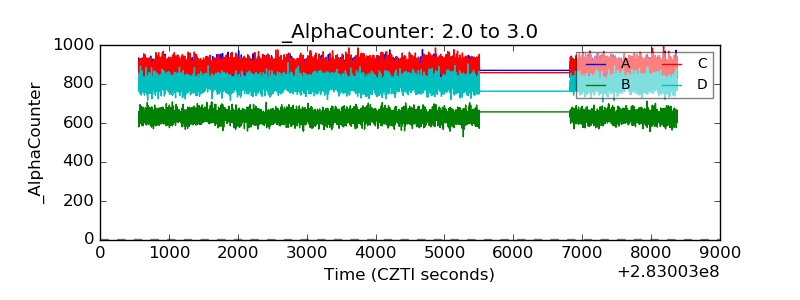 |
| _CPM_Rate | 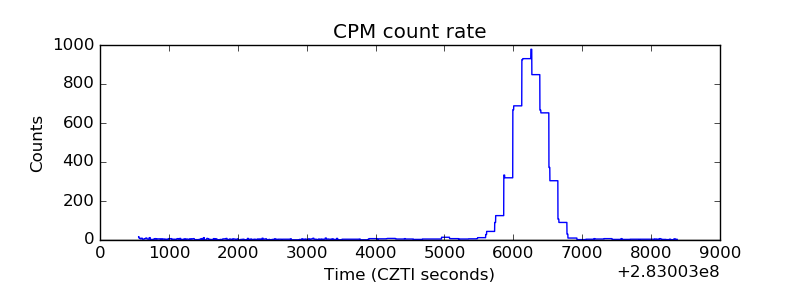 |
| CZT Counter | 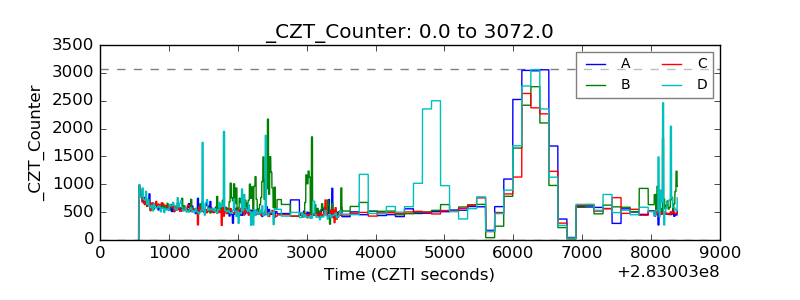 |
| +2.5 Volts monitor |  |
| +5 Volts monitor | 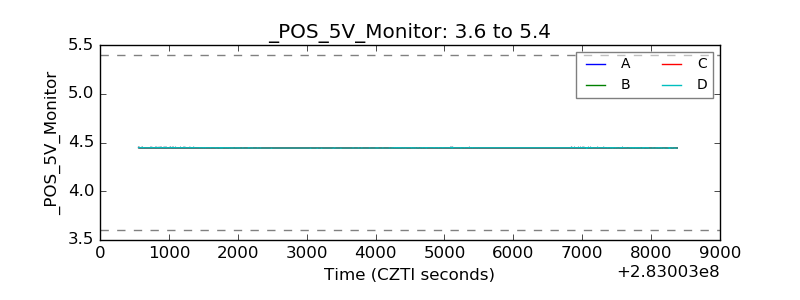 |
| _ROLL_ROT | 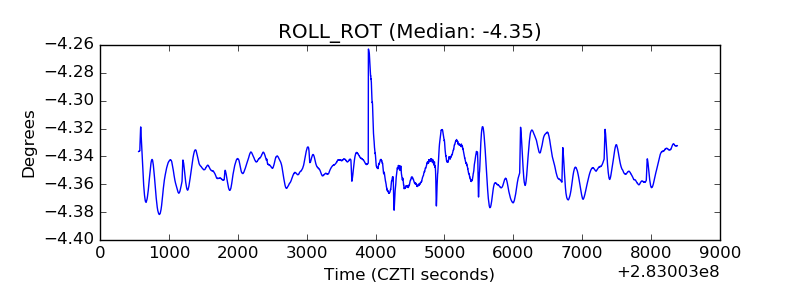 |
| _Roll_DEC | 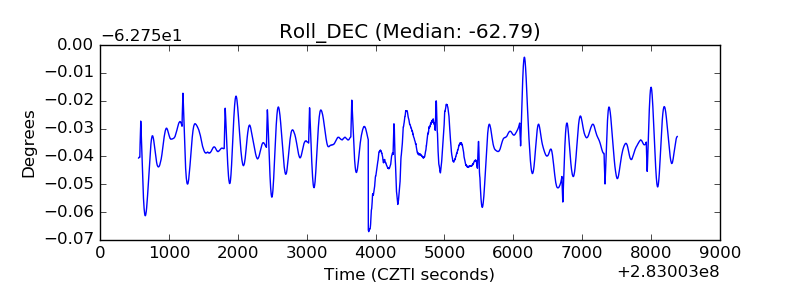 |
| _Roll_RA | 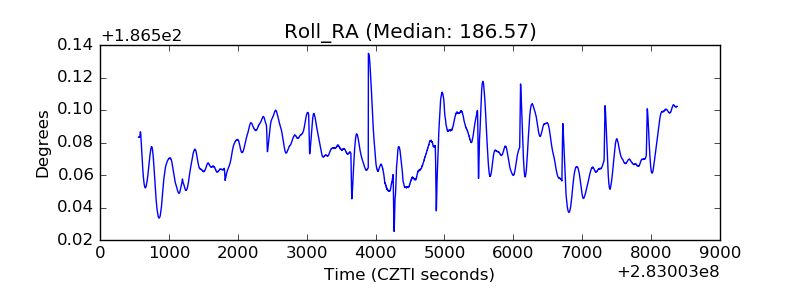 |
| Veto Counter | 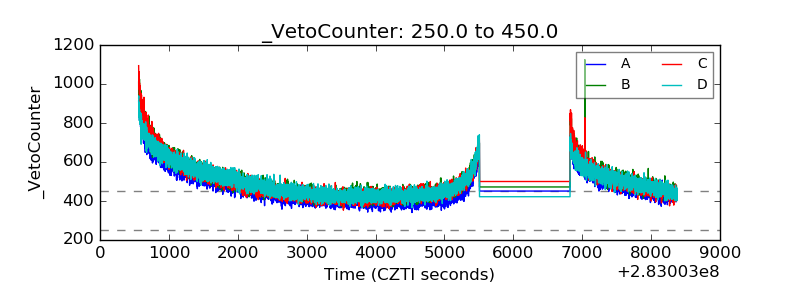 |