| Param | Original file | Final file |
|---|---|---|
| Filename | modeM0/AS1T03_067T01_9000002582_17458cztM0_level2.evt | modeM0/AS1T03_067T01_9000002582_17458cztM0_level2_quad_clean.evt |
| Size (bytes) | 522,780,480 | 80,755,200 |
| Size | 498.6 MB | 77.0 MB |
| Events in quadrant A | 3,301,912 | 511,560 |
| Events in quadrant B | 4,054,350 | 514,839 |
| Events in quadrant C | 3,356,057 | 486,432 |
| Events in quadrant D | 4,667,967 | 467,730 |
| Mode M0 | |||
|---|---|---|---|
| Quadrant | BADHDUFLAG | Total packets | Discarded packets |
| A | 0 | 13887 | 2 |
| B | 0 | 16235 | 2 |
| C | 0 | 13934 | 2 |
| D | 0 | 18118 | 2 |
| Mode SS | |||
|---|---|---|---|
| Quadrant | BADHDUFLAG | Total packets | Discarded packets |
| A | 0 | 136 | 0 |
| B | 0 | 136 | 0 |
| C | 0 | 136 | 0 |
| D | 0 | 136 | 0 |
| Mode M9 | |||
|---|---|---|---|
| Quadrant | BADHDUFLAG | Total packets | Discarded packets |
| A | 0 | 13 | 0 |
| B | 0 | 14 | 0 |
| C | 0 | 14 | 0 |
| D | 0 | 14 | 0 |
| Quadrant | Total seconds | Saturated seconds | Saturation percentage |
|---|---|---|---|
| A | 6662 | 69 | 1.035725% |
| B | 6662 | 122 | 1.831282% |
| C | 6662 | 97 | 1.456019% |
| D | 6662 | 421 | 6.319424% |
Noise dominated data is calculated using 1-second bins in cleaned event files. If a bin has >2000 counts, and if more than 50% of those come from <1% of pixels, then it is considered to be noise-dominated and hence unusable.
| Quadrant | # 1 sec bins | Bins with >0 counts | Bins with >2000 counts | High rate bins dominated by noise | Noise dominated (total time) | Noise dominated (detector-on time) | Marked lightcurve |
|---|---|---|---|---|---|---|---|
| A | 7772 | 6663 | 0 | 0 | 0.00% | 0.00% | 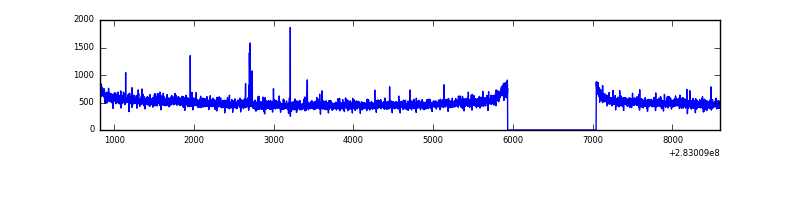 |
| B | 7772 | 6663 | 43 | 43 | 0.55% | 0.65% | 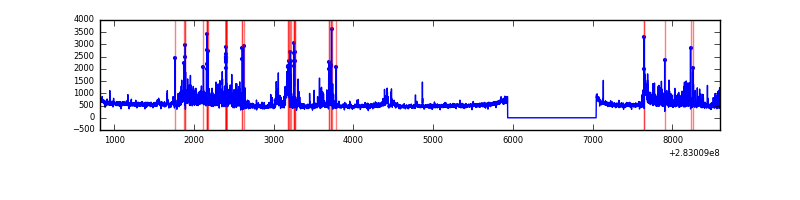 |
| C | 7772 | 6663 | 0 | 0 | 0.00% | 0.00% | 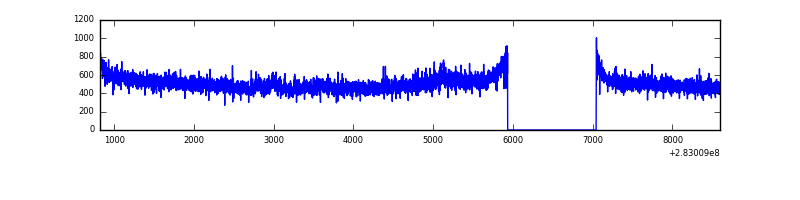 |
| D | 7772 | 6663 | 329 | 329 | 4.23% | 4.94% | 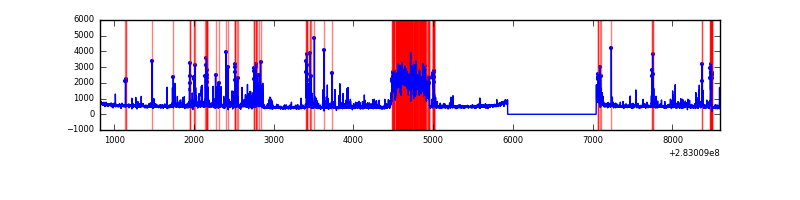 |
Top three noisy pixels from each quadrant. If the there are fewer than three noisy pixels in the level2.evt file, extra rows are filled as -1
| Pixel properties | Quadrant properties | ||||||
|---|---|---|---|---|---|---|---|
| Quadrant | DetID | PixID | Counts | Sigma | Mean | Median | Sigma |
| A | 6 | 16 | 34528 | 200.45 | 846 | 831 | 168.1 |
| A | 0 | 226 | 7694 | 40.83 | 846 | 831 | 168.1 |
| A | 12 | 194 | 6470 | 33.54 | 846 | 831 | 168.1 |
| B | 7 | 220 | 385226 | 2467.74 | 838 | 819 | 155.8 |
| B | 4 | 48 | 168028 | 1073.41 | 838 | 819 | 155.8 |
| B | 15 | 35 | 98548 | 627.38 | 838 | 819 | 155.8 |
| C | 14 | 238 | 126432 | 685.93 | 799 | 804 | 183.1 |
| C | 3 | 233 | 84627 | 457.68 | 799 | 804 | 183.1 |
| C | 7 | 220 | 22936 | 120.84 | 799 | 804 | 183.1 |
| D | 13 | 189 | 882839 | 4547.78 | 805 | 782 | 194.0 |
| D | 13 | 232 | 323256 | 1662.64 | 805 | 782 | 194.0 |
| D | 13 | 168 | 151327 | 776.19 | 805 | 782 | 194.0 |
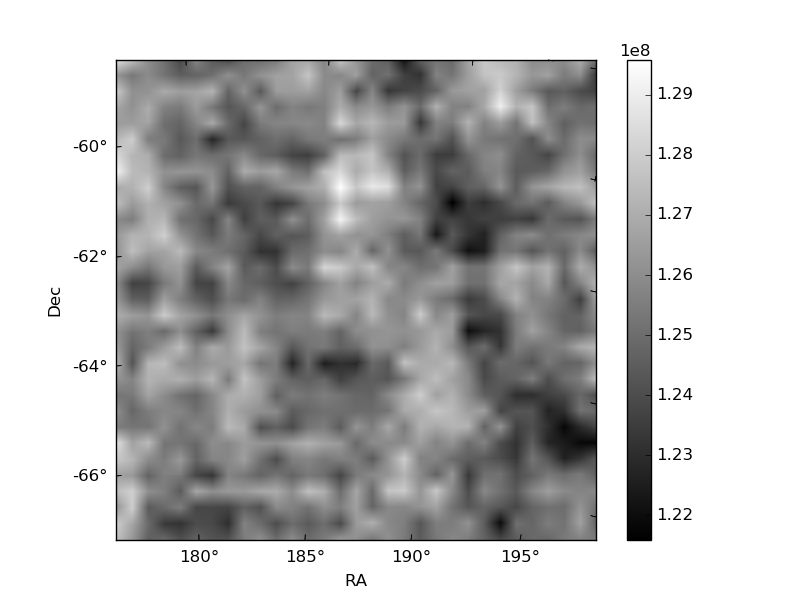
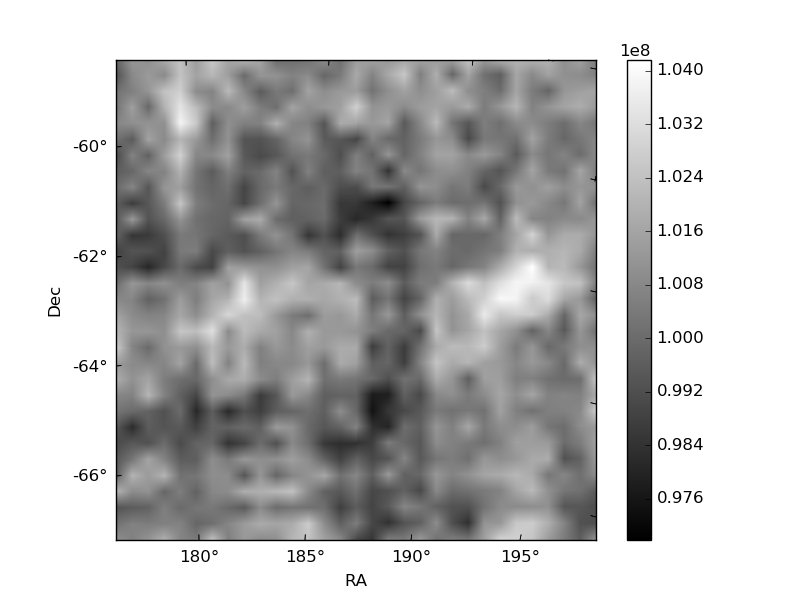
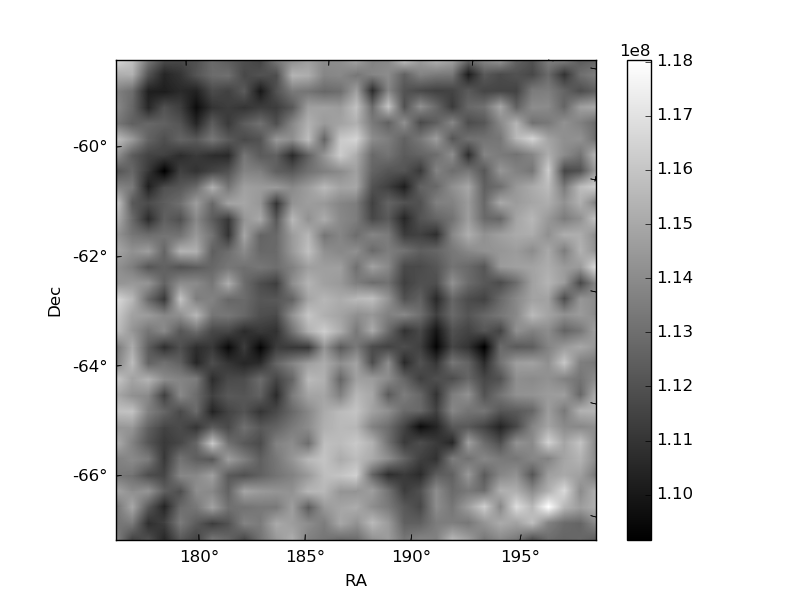
Histogram calculated using DETX and DETY for each event in the final _common_clean file
| Quadrant A | 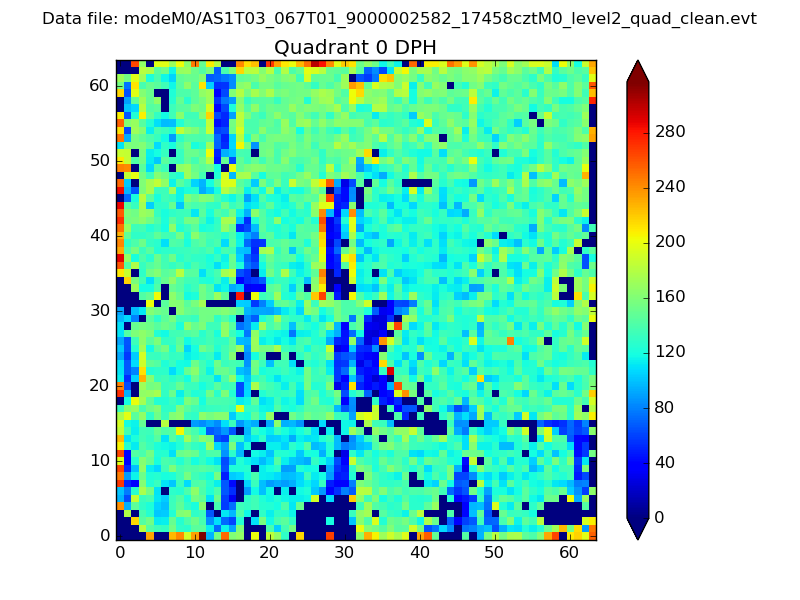 |
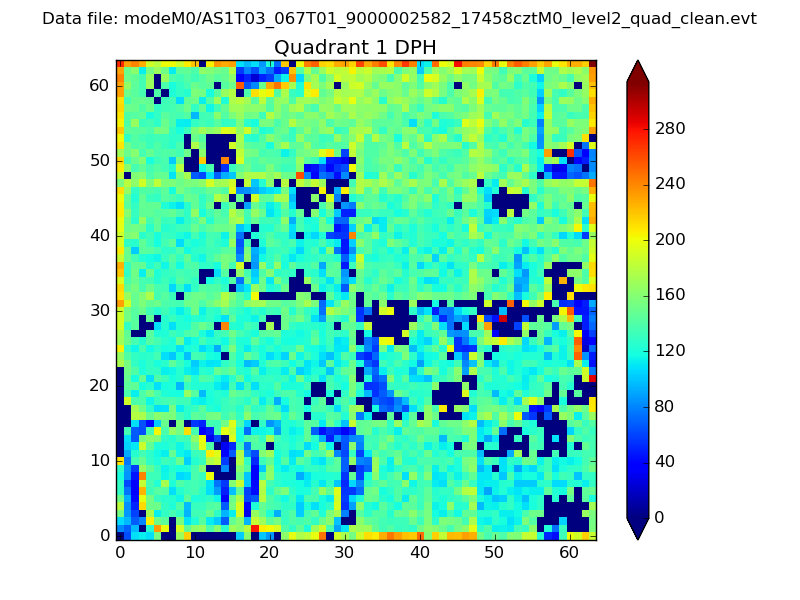 |
Quadrant B |
|---|---|---|---|
| Quadrant D | 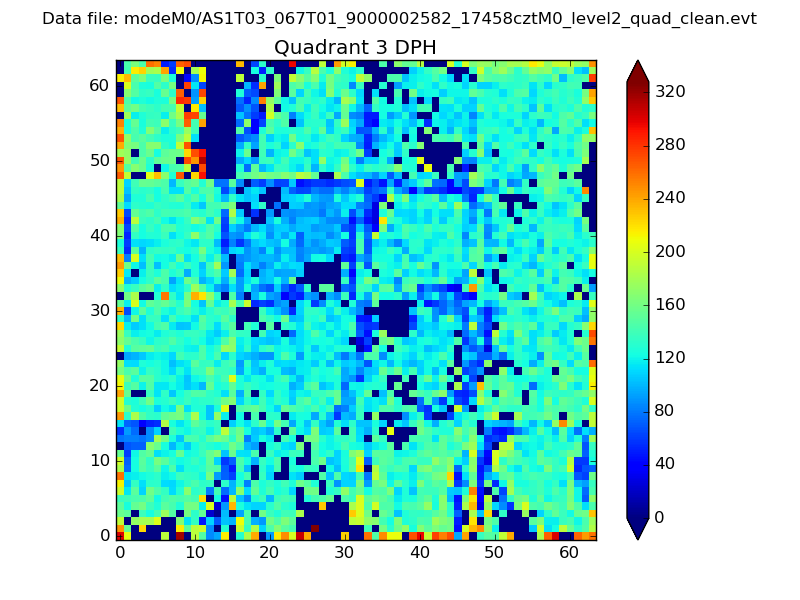 |
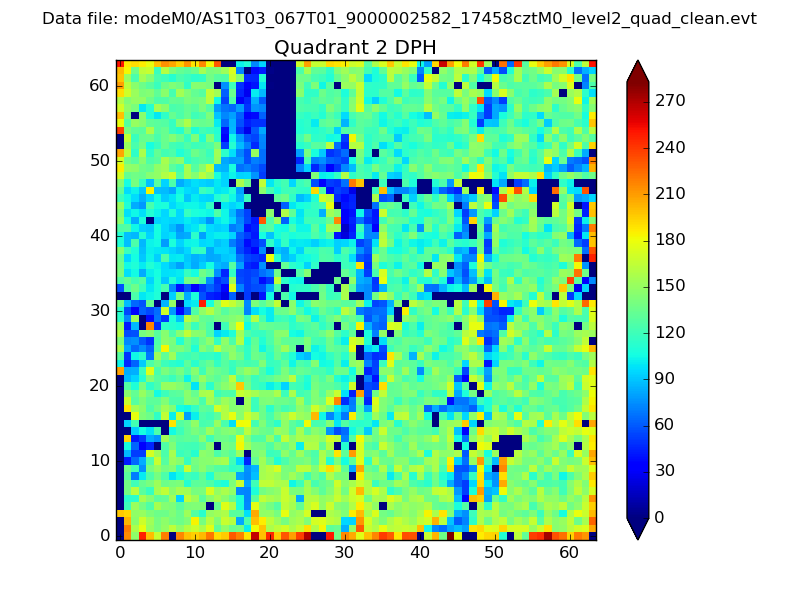 |
Quadrant C |
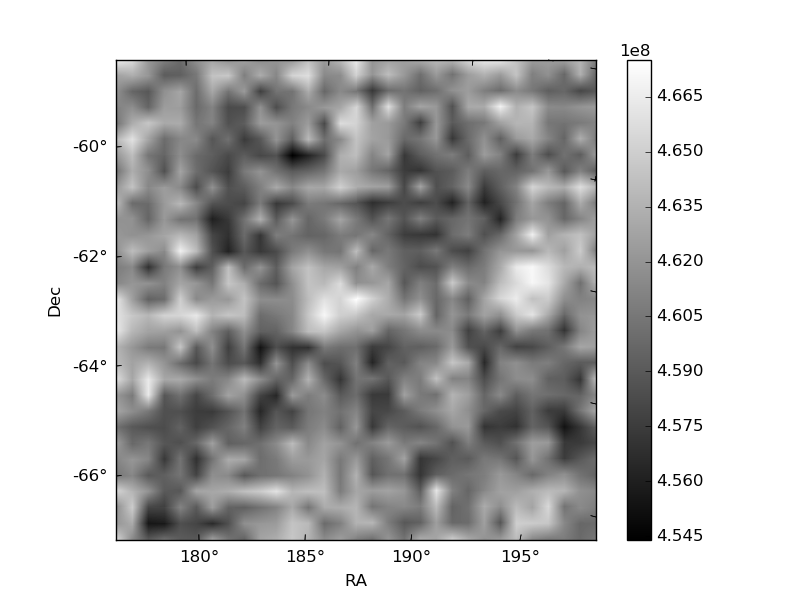
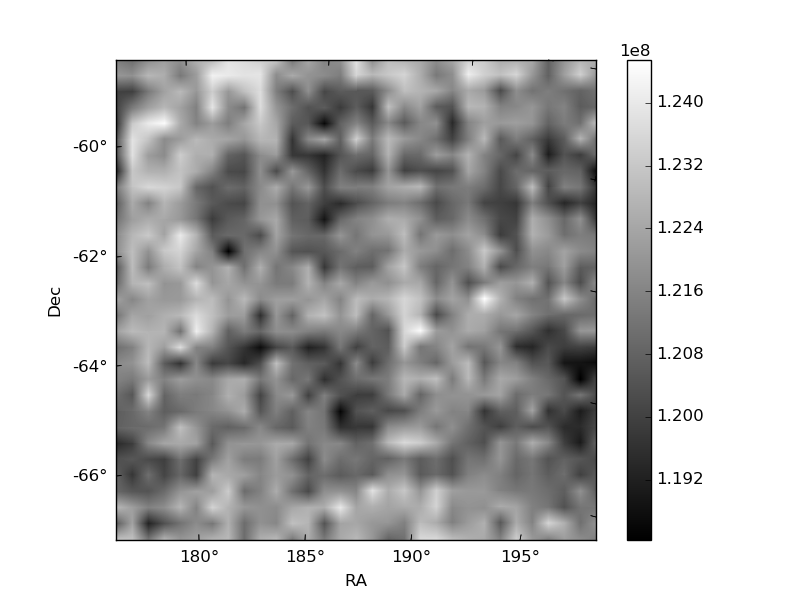
| Plot type | Count rate plots | Images |
|---|---|---|
| Comparison with Poisson distribution Blue bars denote a histogram of data divided into 1 sec bins. Red curve is a Poisson curve with rate = median count rate of data. |
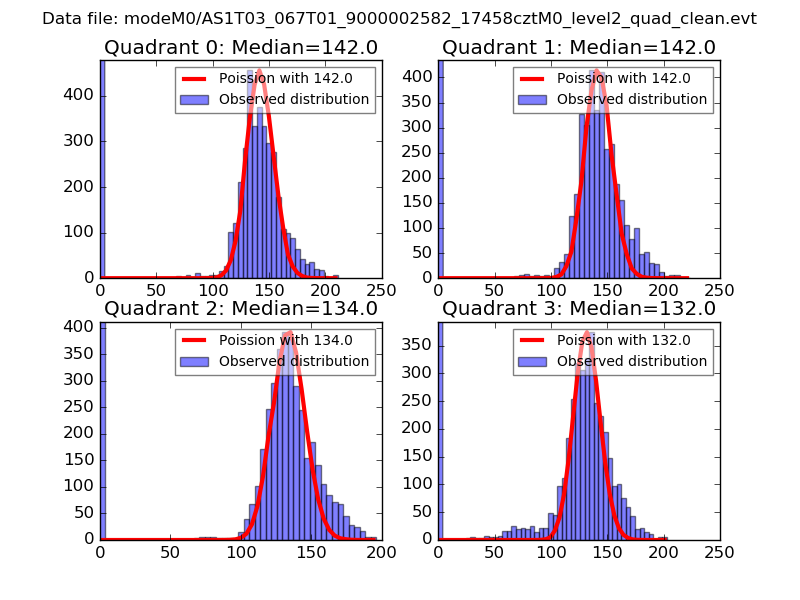 |
 |
| Quadrant-wise count rates Data is divided into 100 sec bins |
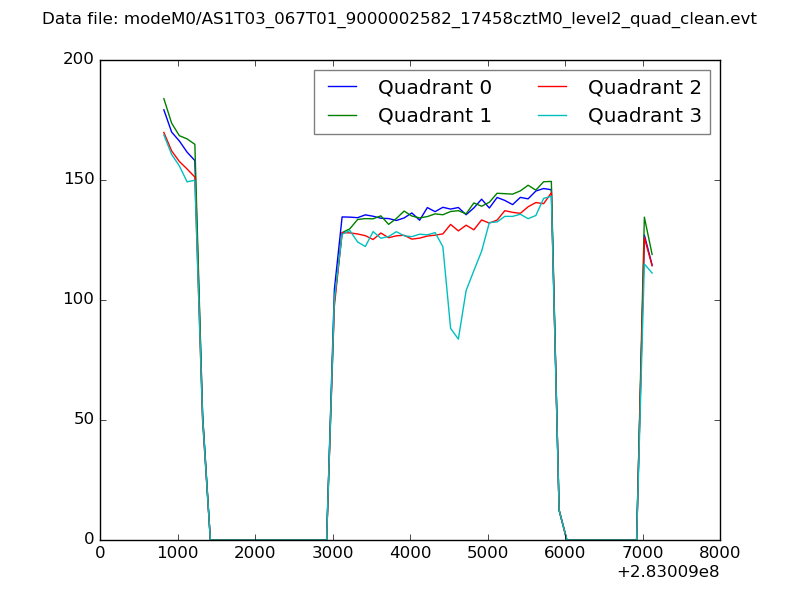 |
|
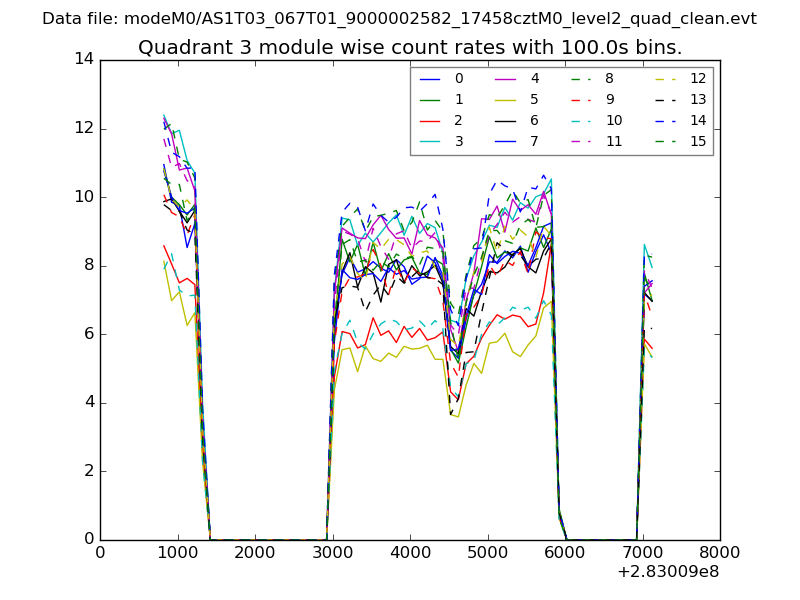
| Module-wise count rates for Quadrant A Data is divided into 100 sec bins |
 |
 |
| Module-wise count rates for Quadrant B Data is divided into 100 sec bins |
 |
 |
| Module-wise count rates for Quadrant C Data is divided into 100 sec bins |
 |
 |
| Module-wise count rates for Quadrant D Data is divided into 100 sec bins |
 |
 |
| Parameter | Plot |
|---|---|
| CZT HV Monitor |  |
| D_VDD | 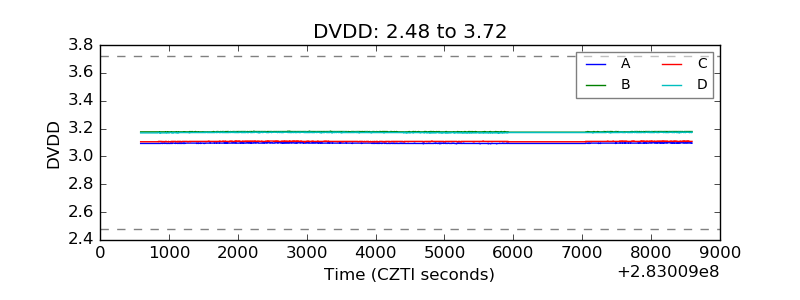 |
| Temperature 1 | 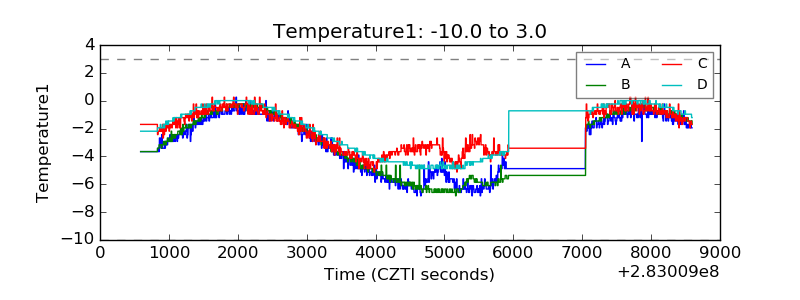 |
| Veto HV Monitor | 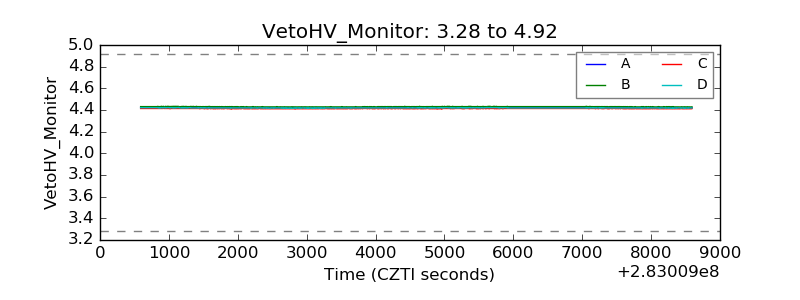 |
| Veto LLD | 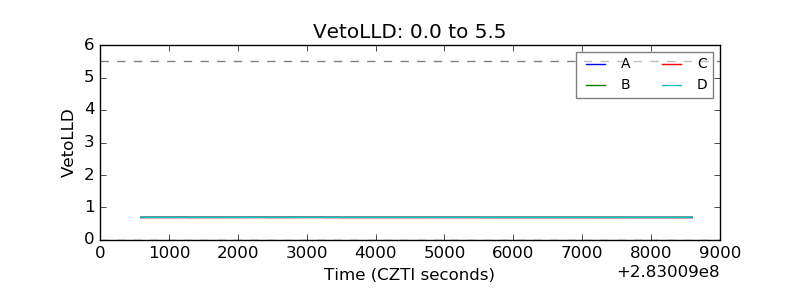 |
| Alpha Counter | 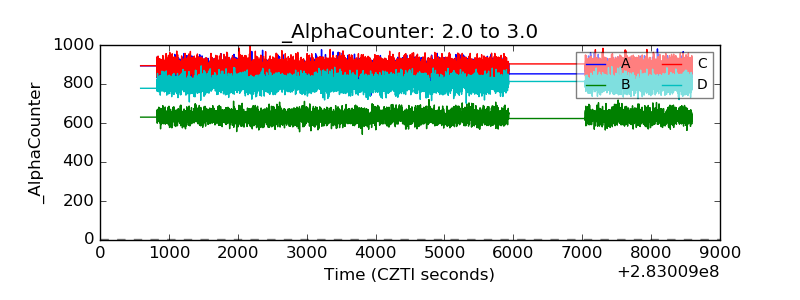 |
| _CPM_Rate | 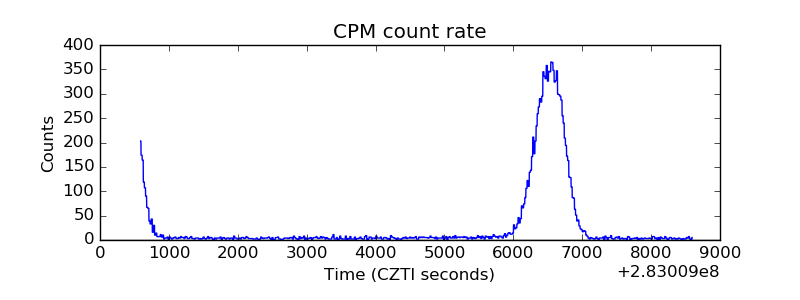 |
| CZT Counter | 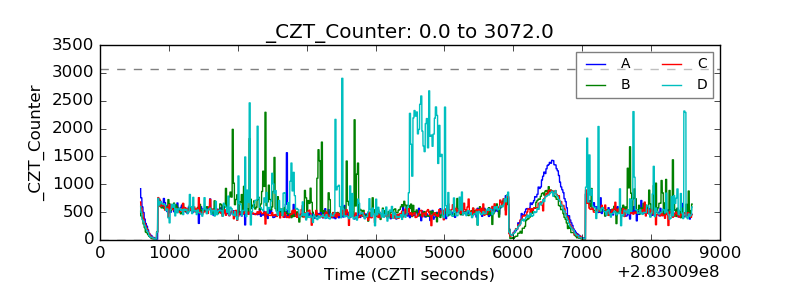 |
| +2.5 Volts monitor |  |
| +5 Volts monitor |  |
| _ROLL_ROT |  |
| _Roll_DEC | 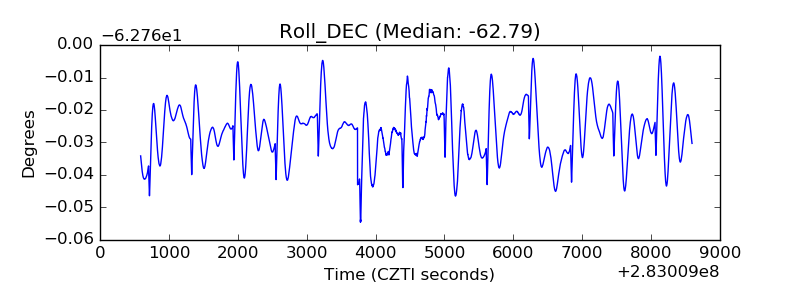 |
| _Roll_RA |  |
| Veto Counter | 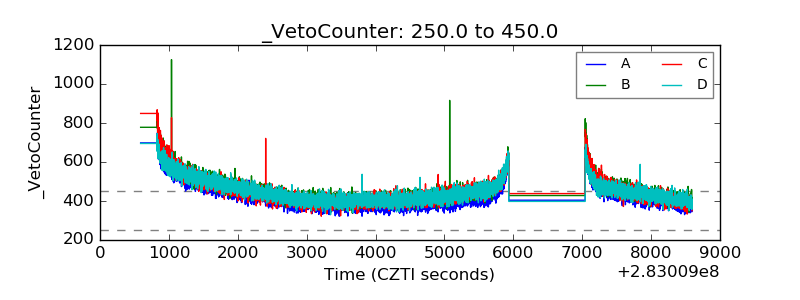 |