| Param | Original file | Final file |
|---|---|---|
| Filename | modeM0/AS1T03_067T01_9000002582_17459cztM0_level2.evt | modeM0/AS1T03_067T01_9000002582_17459cztM0_level2_quad_clean.evt |
| Size (bytes) | 552,769,920 | 78,071,040 |
| Size | 527.2 MB | 74.5 MB |
| Events in quadrant A | 3,144,181 | 490,339 |
| Events in quadrant B | 4,056,389 | 491,080 |
| Events in quadrant C | 3,208,755 | 469,468 |
| Events in quadrant D | 5,879,828 | 449,051 |
| Mode M0 | |||
|---|---|---|---|
| Quadrant | BADHDUFLAG | Total packets | Discarded packets |
| A | 0 | 13695 | 1 |
| B | 0 | 16376 | 1 |
| C | 0 | 13756 | 1 |
| D | 0 | 21987 | 1 |
| Mode SS | |||
|---|---|---|---|
| Quadrant | BADHDUFLAG | Total packets | Discarded packets |
| A | 0 | 136 | 0 |
| B | 0 | 136 | 0 |
| C | 0 | 136 | 0 |
| D | 0 | 136 | 0 |
| Mode M9 | |||
|---|---|---|---|
| Quadrant | BADHDUFLAG | Total packets | Discarded packets |
| A | 0 | 6 | 0 |
| B | 0 | 6 | 0 |
| C | 0 | 6 | 0 |
| D | 0 | 6 | 0 |
| Quadrant | Total seconds | Saturated seconds | Saturation percentage |
|---|---|---|---|
| A | 6651 | 139 | 2.089911% |
| B | 6652 | 275 | 4.134095% |
| C | 6652 | 155 | 2.330126% |
| D | 6652 | 794 | 11.936260% |
Noise dominated data is calculated using 1-second bins in cleaned event files. If a bin has >2000 counts, and if more than 50% of those come from <1% of pixels, then it is considered to be noise-dominated and hence unusable.
| Quadrant | # 1 sec bins | Bins with >0 counts | Bins with >2000 counts | High rate bins dominated by noise | Noise dominated (total time) | Noise dominated (detector-on time) | Marked lightcurve |
|---|---|---|---|---|---|---|---|
| A | 7276 | 6651 | 1 | 1 | 0.01% | 0.02% | 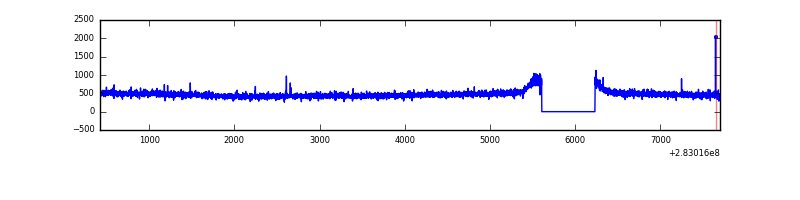 |
| B | 7277 | 6652 | 66 | 66 | 0.91% | 0.99% | 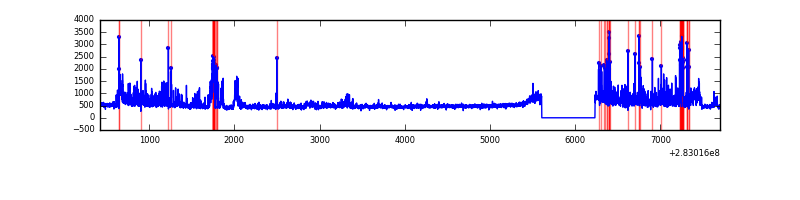 |
| C | 7277 | 6652 | 0 | 0 | 0.00% | 0.00% | 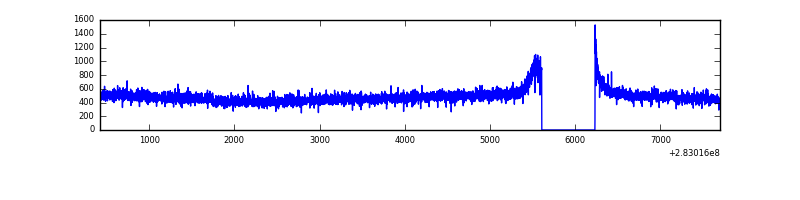 |
| D | 7277 | 6653 | 531 | 531 | 7.30% | 7.98% | 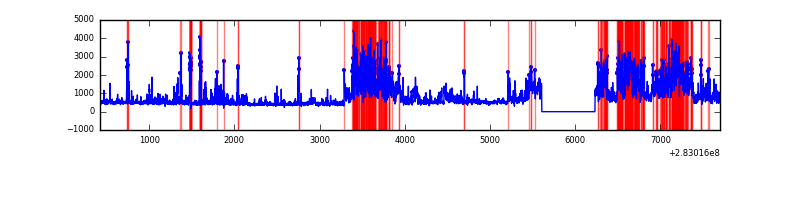 |
Top three noisy pixels from each quadrant. If the there are fewer than three noisy pixels in the level2.evt file, extra rows are filled as -1
| Pixel properties | Quadrant properties | ||||||
|---|---|---|---|---|---|---|---|
| Quadrant | DetID | PixID | Counts | Sigma | Mean | Median | Sigma |
| A | 0 | 226 | 7414 | 40.15 | 814 | 796 | 164.8 |
| A | 15 | 191 | 6617 | 35.32 | 814 | 796 | 164.8 |
| A | 12 | 194 | 6292 | 33.34 | 814 | 796 | 164.8 |
| B | 7 | 220 | 458110 | 2957.9 | 808 | 788 | 154.6 |
| B | 15 | 35 | 192245 | 1238.32 | 808 | 788 | 154.6 |
| B | 4 | 216 | 129601 | 833.15 | 808 | 788 | 154.6 |
| C | 14 | 238 | 119031 | 654.97 | 774 | 777 | 180.5 |
| C | 3 | 233 | 32796 | 177.34 | 774 | 777 | 180.5 |
| C | 5 | 218 | 28465 | 153.35 | 774 | 777 | 180.5 |
| D | 11 | 176 | 1689113 | 9198.18 | 760 | 738 | 183.6 |
| D | 13 | 189 | 742154 | 4039.2 | 760 | 738 | 183.6 |
| D | 13 | 232 | 200959 | 1090.79 | 760 | 738 | 183.6 |
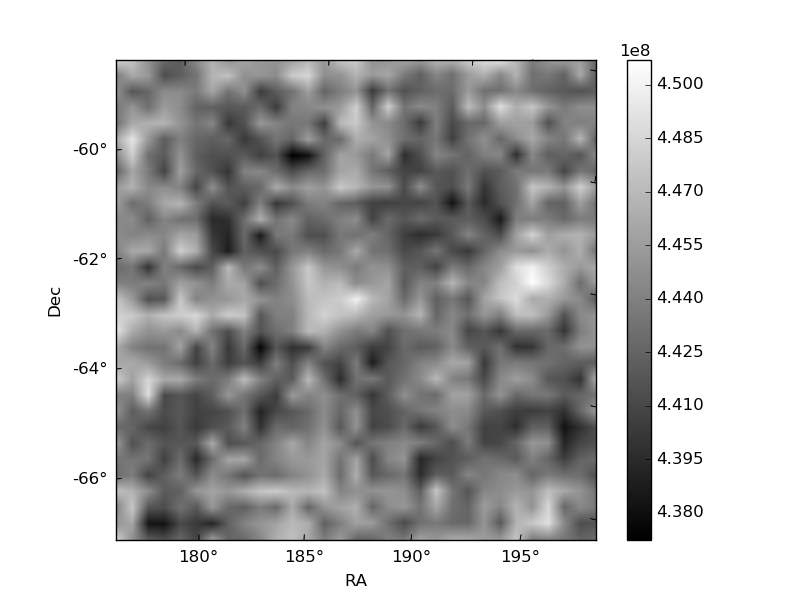
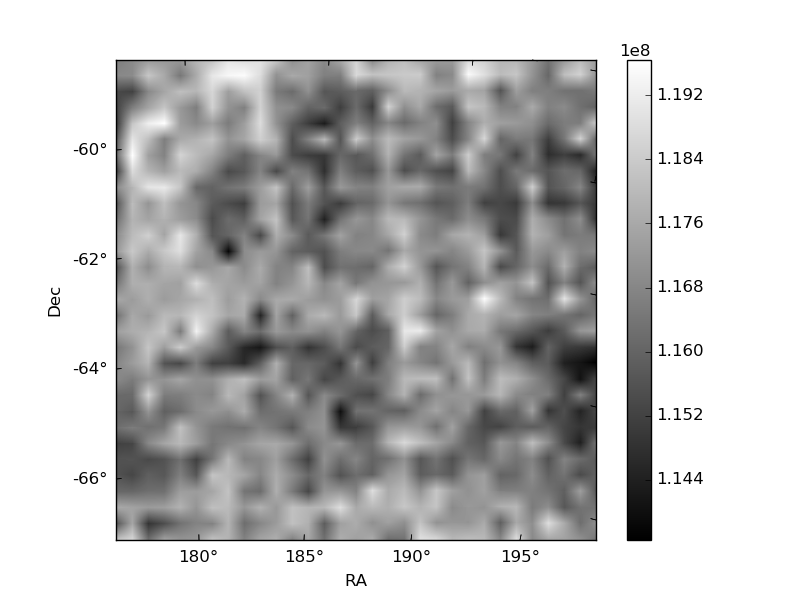
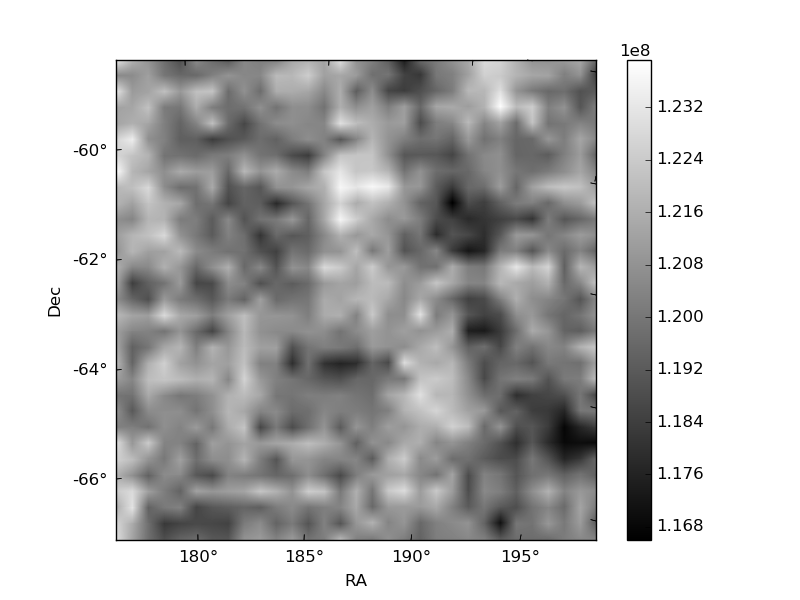
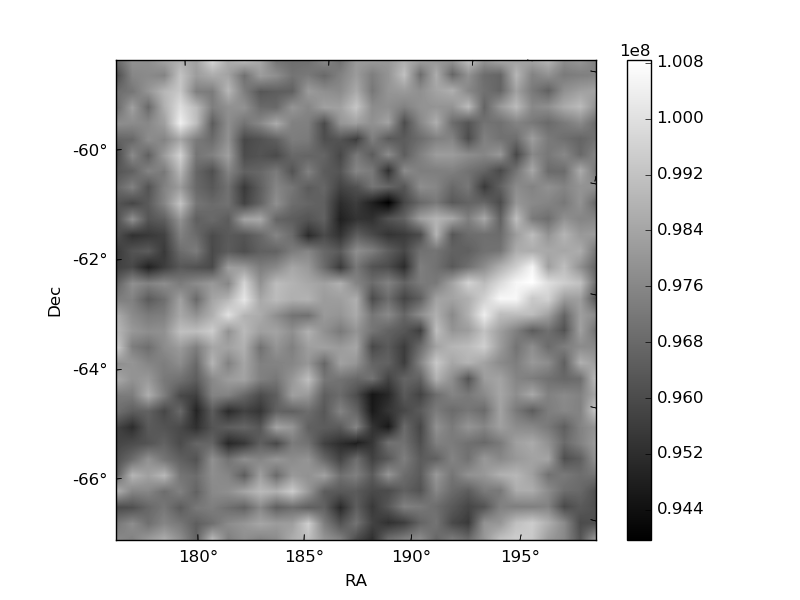
Histogram calculated using DETX and DETY for each event in the final _common_clean file
| Quadrant A | 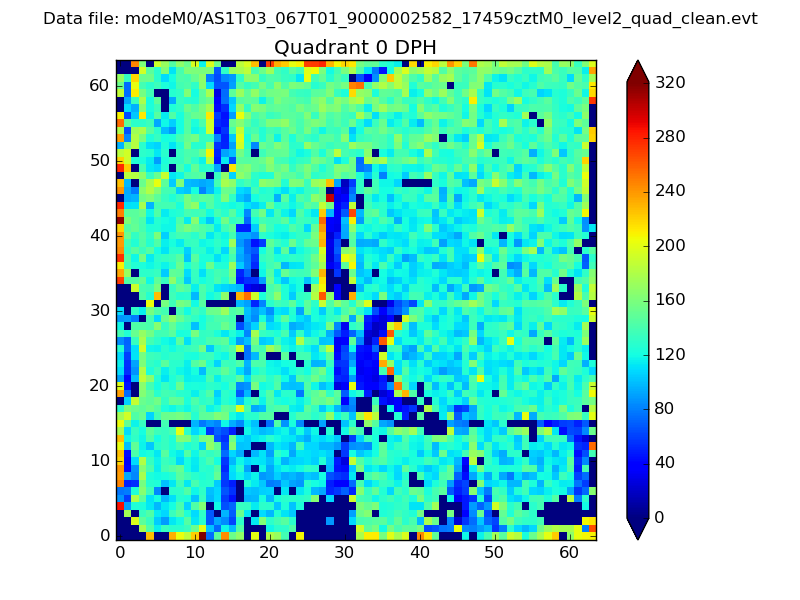 |
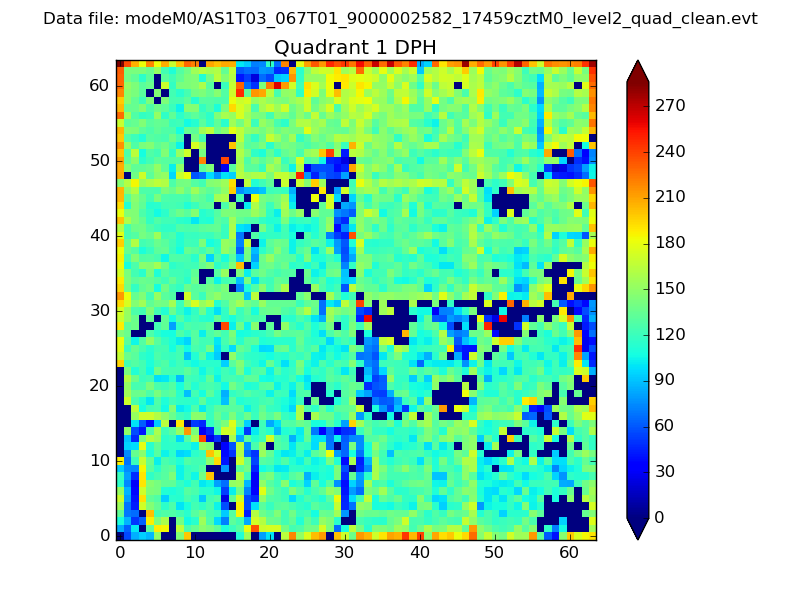 |
Quadrant B |
|---|---|---|---|
| Quadrant D |  |
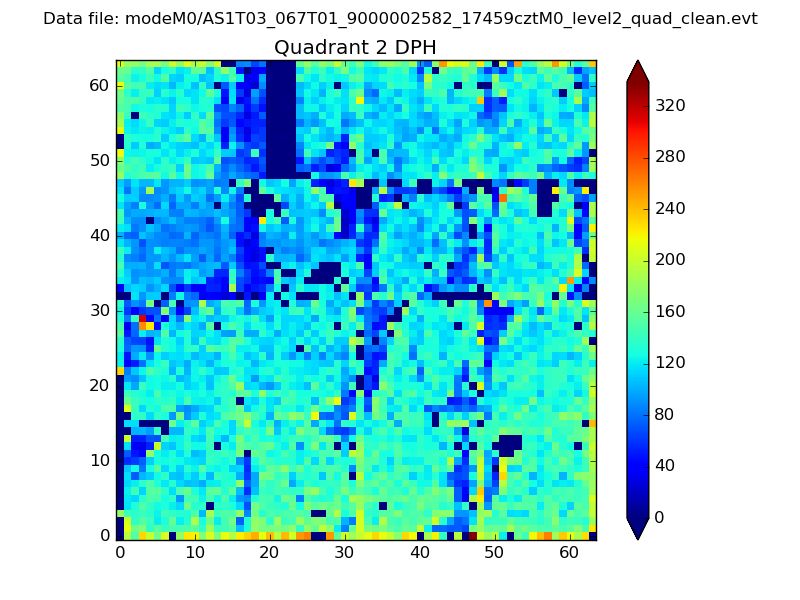 |
Quadrant C |
| Plot type | Count rate plots | Images |
|---|---|---|
| Comparison with Poisson distribution Blue bars denote a histogram of data divided into 1 sec bins. Red curve is a Poisson curve with rate = median count rate of data. |
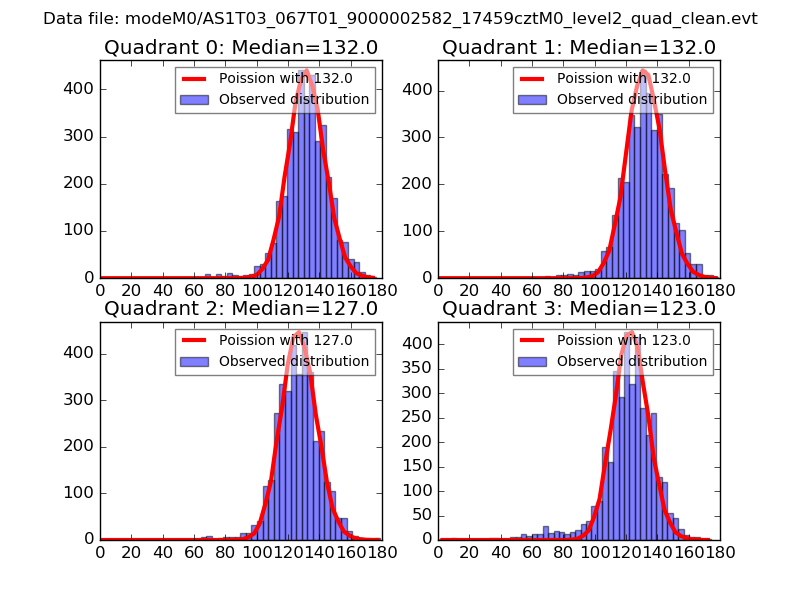 |
 |
| Quadrant-wise count rates Data is divided into 100 sec bins |
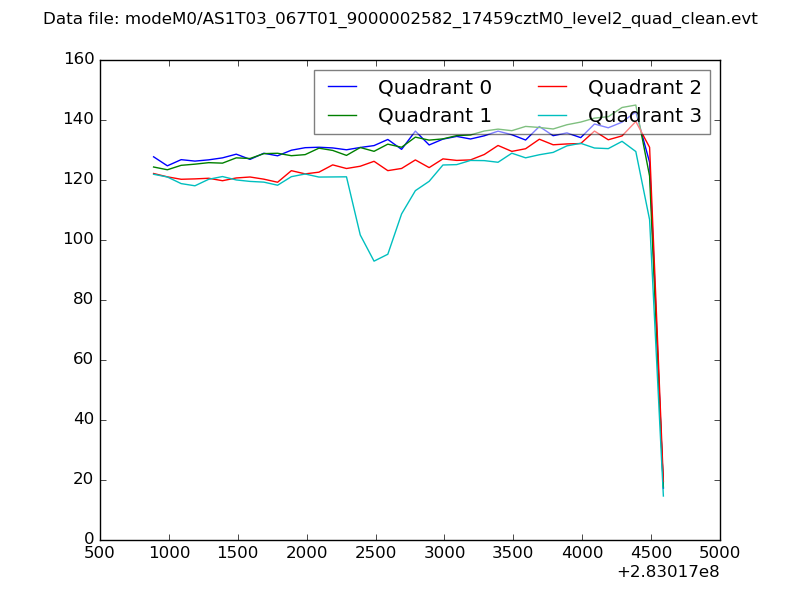 |
|
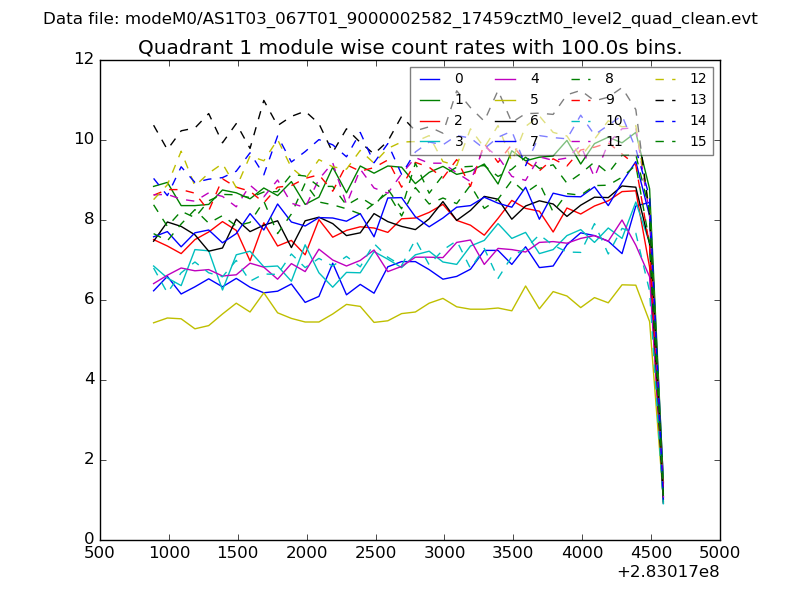
| Module-wise count rates for Quadrant A Data is divided into 100 sec bins |
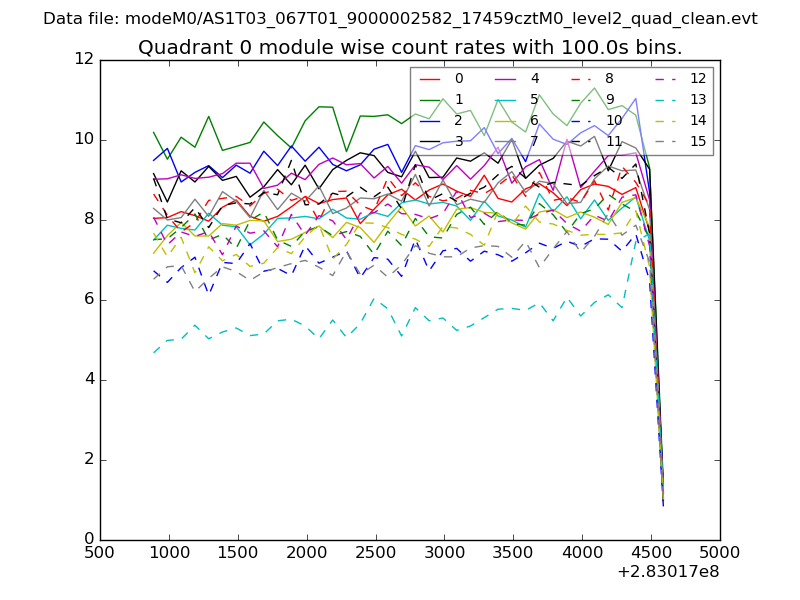 |
 |
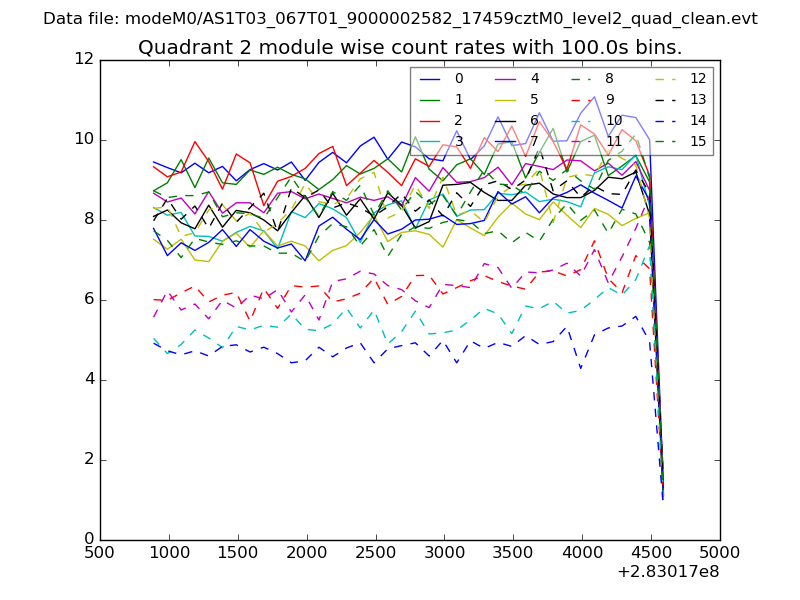
| Module-wise count rates for Quadrant B Data is divided into 100 sec bins |
 |
 |
| Module-wise count rates for Quadrant C Data is divided into 100 sec bins |
 |
 |
| Module-wise count rates for Quadrant D Data is divided into 100 sec bins |
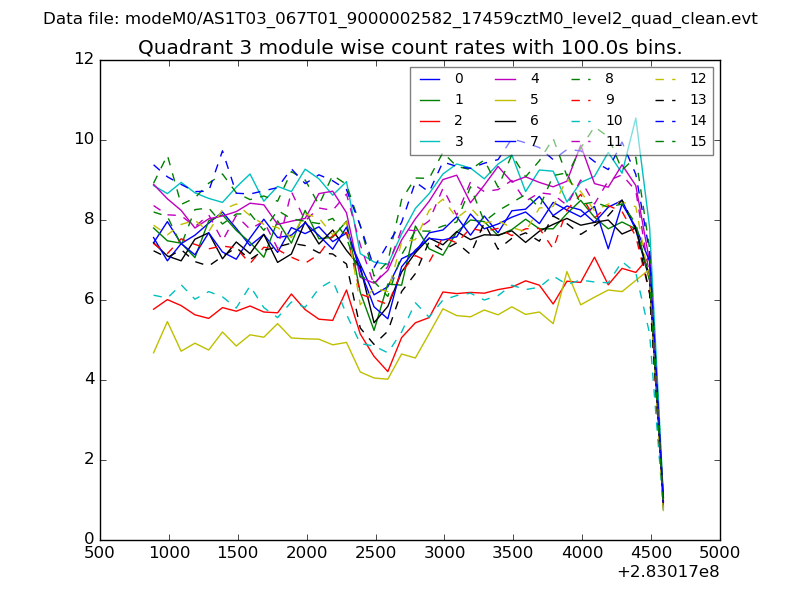 |
 |
| Parameter | Plot |
|---|---|
| CZT HV Monitor | 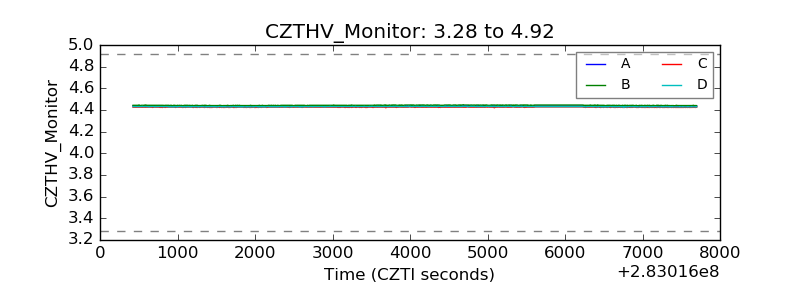 |
| D_VDD | 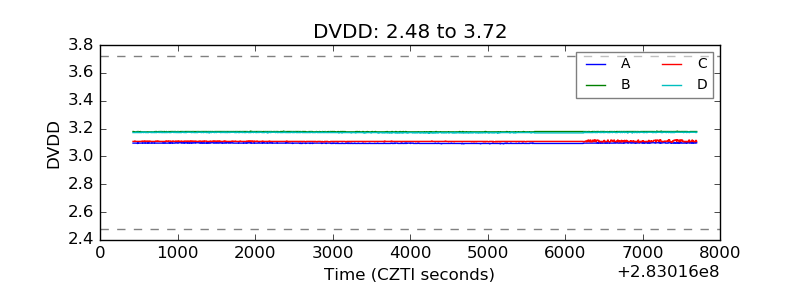 |
| Temperature 1 | 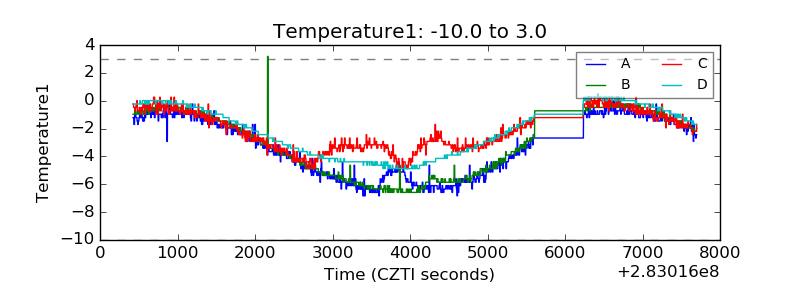 |
| Veto HV Monitor | 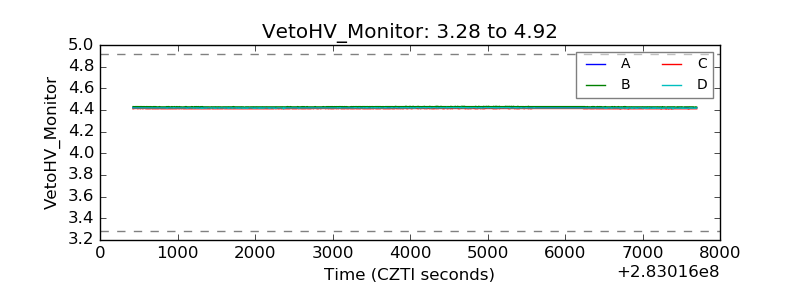 |
| Veto LLD | 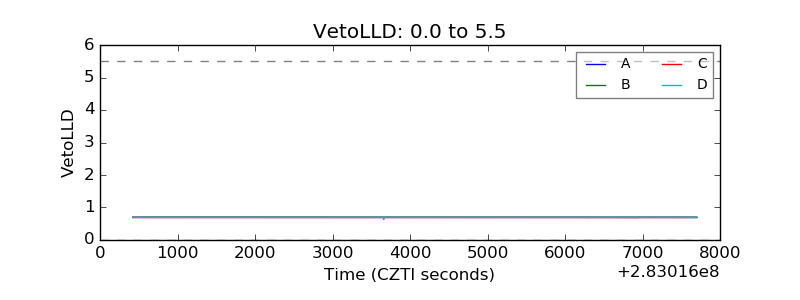 |
| Alpha Counter | 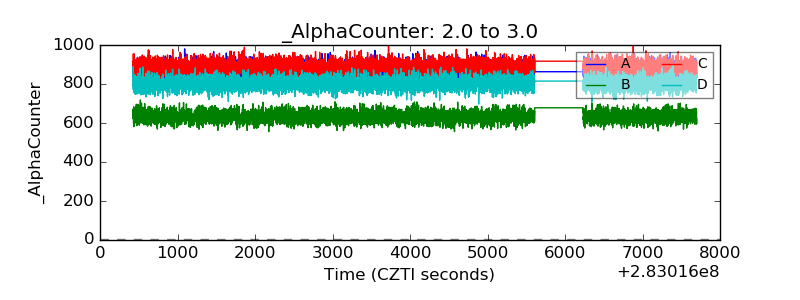 |
| _CPM_Rate | 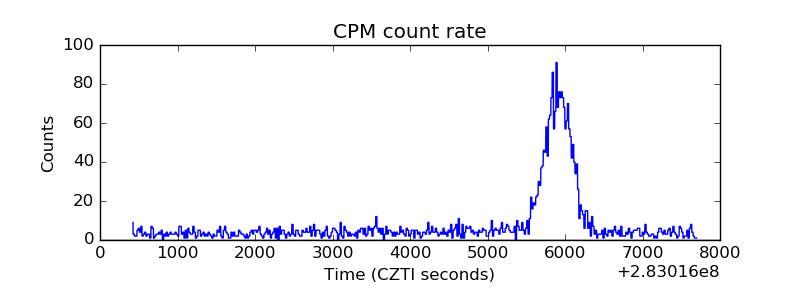 |
| CZT Counter |  |
| +2.5 Volts monitor |  |
| +5 Volts monitor |  |
| _ROLL_ROT | 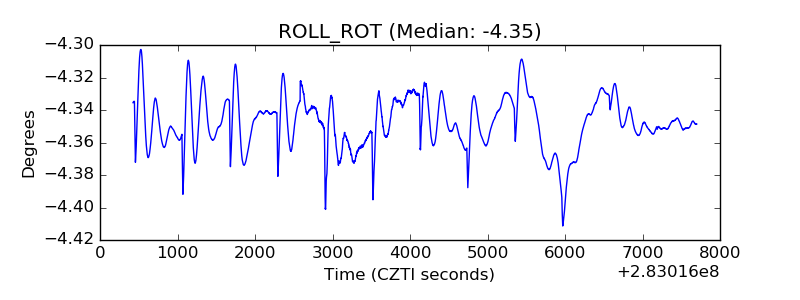 |
| _Roll_DEC | 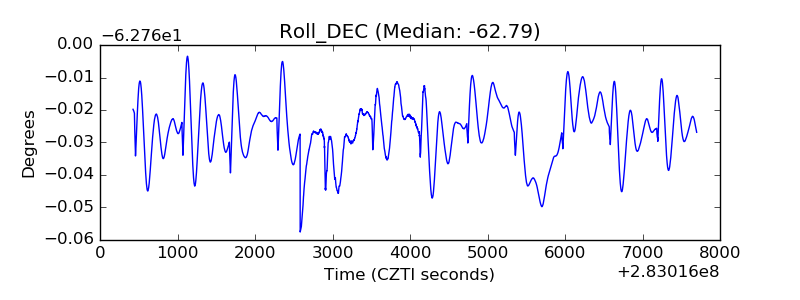 |
| _Roll_RA | 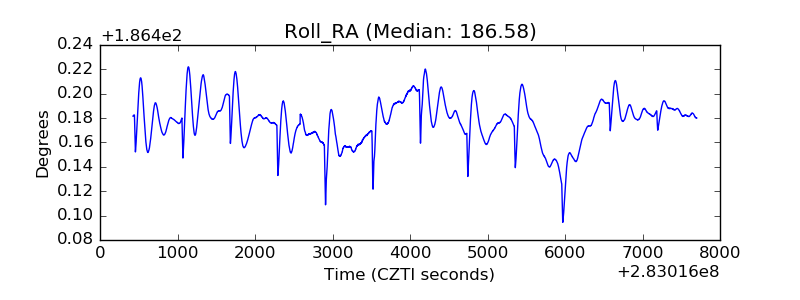 |
| Veto Counter |  |