| Param | Original file | Final file |
|---|---|---|
| Filename | modeM0/AS1T03_067T01_9000002582_17460cztM0_level2.evt | modeM0/AS1T03_067T01_9000002582_17460cztM0_level2_quad_clean.evt |
| Size (bytes) | 566,786,880 | 91,658,880 |
| Size | 540.5 MB | 87.4 MB |
| Events in quadrant A | 3,442,310 | 578,792 |
| Events in quadrant B | 4,268,024 | 579,185 |
| Events in quadrant C | 3,514,478 | 555,164 |
| Events in quadrant D | 5,438,652 | 547,811 |
| Mode M0 | |||
|---|---|---|---|
| Quadrant | BADHDUFLAG | Total packets | Discarded packets |
| A | 0 | 15218 | 2 |
| B | 0 | 17586 | 3 |
| C | 0 | 15245 | 2 |
| D | 0 | 21199 | 2 |
| Mode SS | |||
|---|---|---|---|
| Quadrant | BADHDUFLAG | Total packets | Discarded packets |
| A | 0 | 152 | 0 |
| B | 0 | 152 | 0 |
| C | 0 | 152 | 0 |
| D | 0 | 152 | 0 |
| Mode M9 | |||
|---|---|---|---|
| Quadrant | BADHDUFLAG | Total packets | Discarded packets |
| A | 0 | 3 | 0 |
| B | 0 | 3 | 0 |
| C | 0 | 3 | 0 |
| D | 0 | 3 | 0 |
| Quadrant | Total seconds | Saturated seconds | Saturation percentage |
|---|---|---|---|
| A | 7389 | 65 | 0.879686% |
| B | 7389 | 203 | 2.747327% |
| C | 7389 | 86 | 1.163892% |
| D | 7389 | 495 | 6.699147% |
Noise dominated data is calculated using 1-second bins in cleaned event files. If a bin has >2000 counts, and if more than 50% of those come from <1% of pixels, then it is considered to be noise-dominated and hence unusable.
| Quadrant | # 1 sec bins | Bins with >0 counts | Bins with >2000 counts | High rate bins dominated by noise | Noise dominated (total time) | Noise dominated (detector-on time) | Marked lightcurve |
|---|---|---|---|---|---|---|---|
| A | 7704 | 7391 | 1 | 1 | 0.01% | 0.01% | 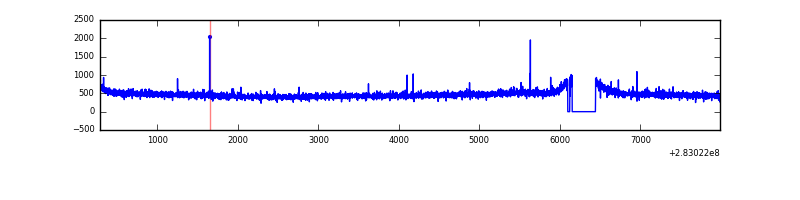 |
| B | 7704 | 7391 | 51 | 51 | 0.66% | 0.69% | 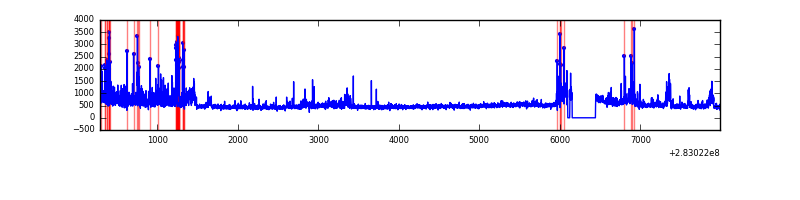 |
| C | 7704 | 7391 | 0 | 0 | 0.00% | 0.00% | 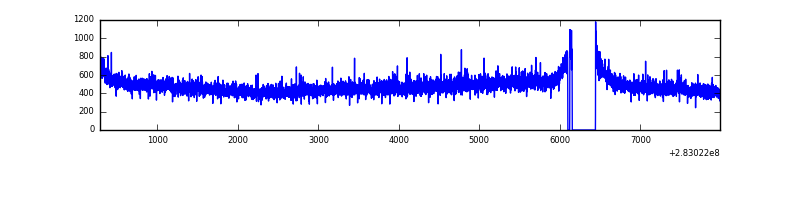 |
| D | 7704 | 7391 | 383 | 383 | 4.97% | 5.18% | 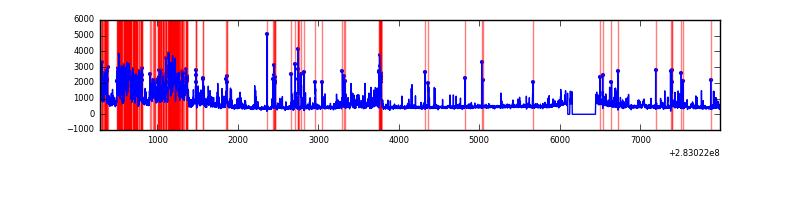 |
Top three noisy pixels from each quadrant. If the there are fewer than three noisy pixels in the level2.evt file, extra rows are filled as -1
| Pixel properties | Quadrant properties | ||||||
|---|---|---|---|---|---|---|---|
| Quadrant | DetID | PixID | Counts | Sigma | Mean | Median | Sigma |
| A | 0 | 226 | 7861 | 38.26 | 892 | 870 | 182.7 |
| A | 4 | 2 | 7348 | 35.45 | 892 | 870 | 182.7 |
| A | 12 | 194 | 6697 | 31.89 | 892 | 870 | 182.7 |
| B | 7 | 220 | 313196 | 1849.08 | 886 | 865 | 168.9 |
| B | 4 | 216 | 214570 | 1265.19 | 886 | 865 | 168.9 |
| B | 0 | 189 | 76444 | 447.45 | 886 | 865 | 168.9 |
| C | 14 | 238 | 128802 | 650.34 | 846 | 852 | 196.7 |
| C | 3 | 233 | 36025 | 178.78 | 846 | 852 | 196.7 |
| C | 5 | 218 | 25082 | 123.16 | 846 | 852 | 196.7 |
| D | 11 | 176 | 1370836 | 6696.61 | 847 | 824 | 204.6 |
| D | 13 | 189 | 279754 | 1363.41 | 847 | 824 | 204.6 |
| D | 13 | 232 | 198813 | 967.77 | 847 | 824 | 204.6 |
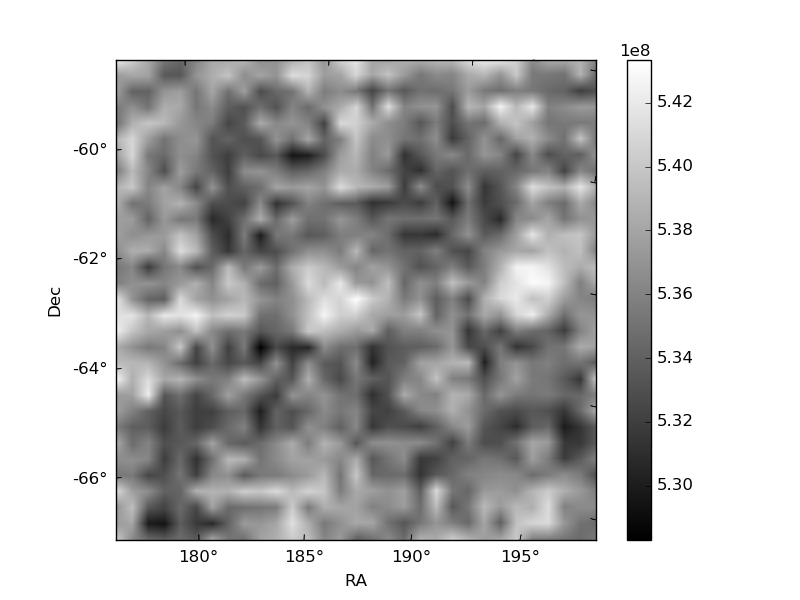
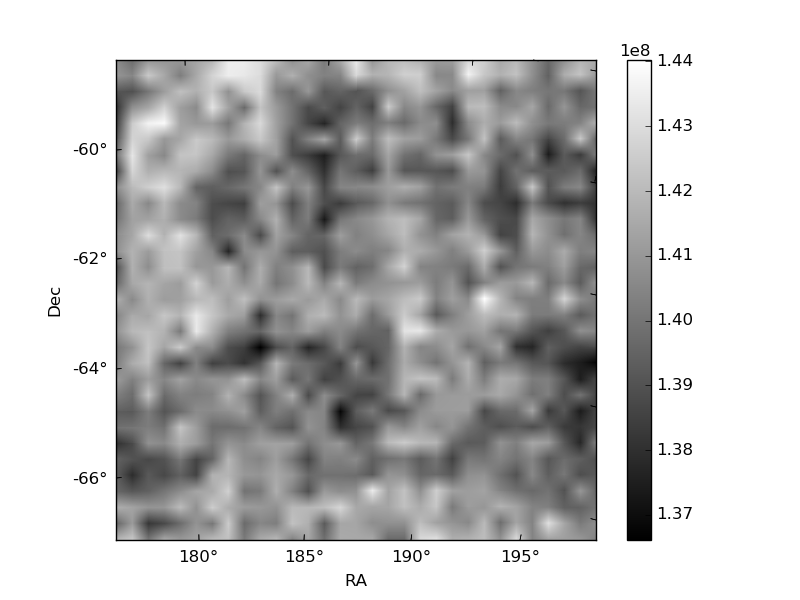
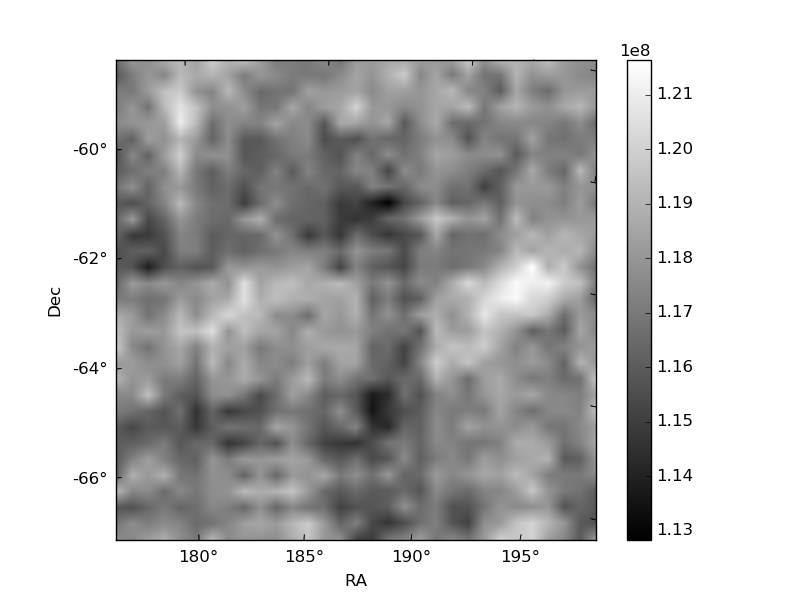
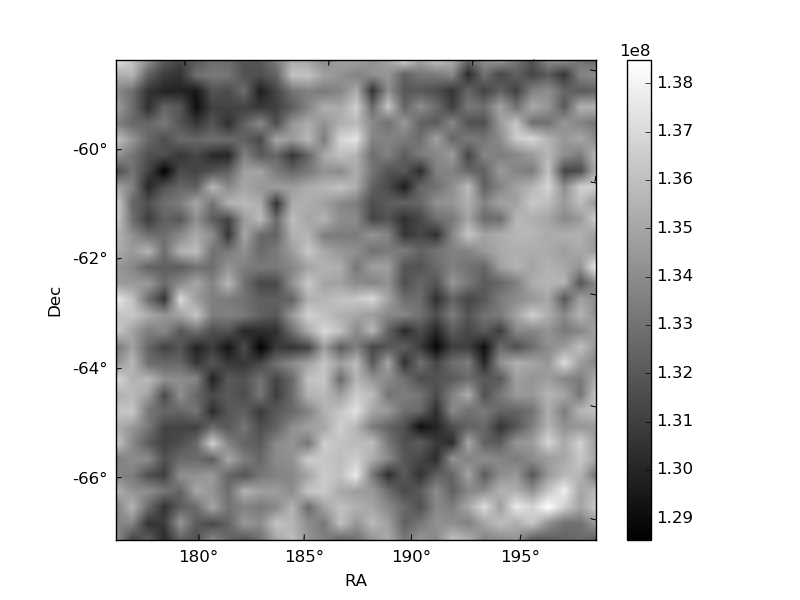
Histogram calculated using DETX and DETY for each event in the final _common_clean file
| Quadrant A | 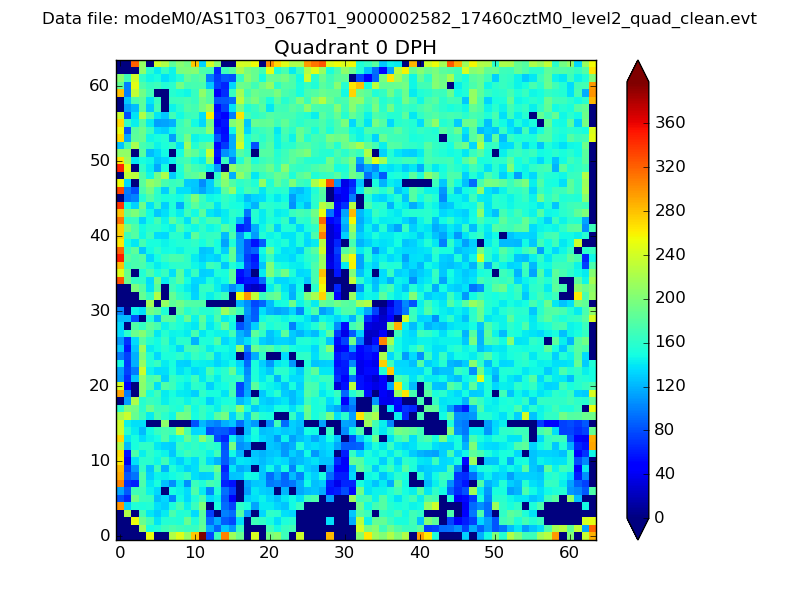 |
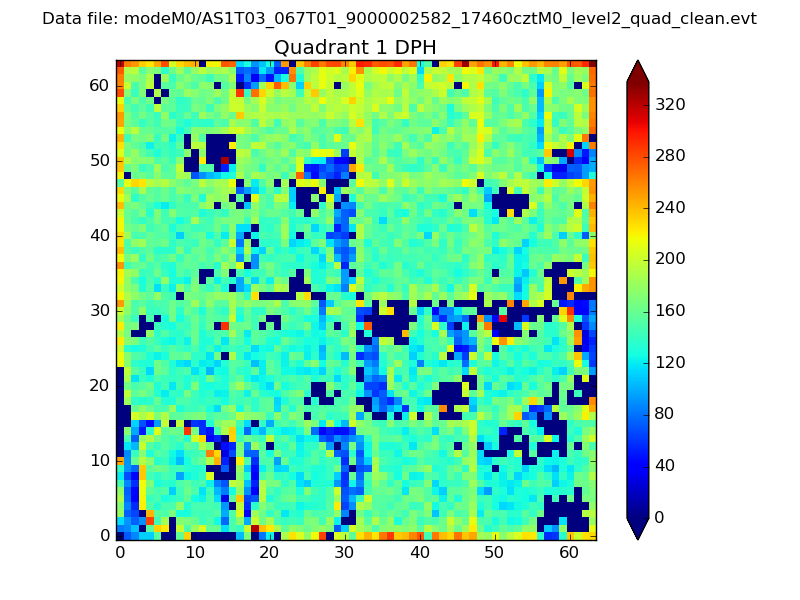 |
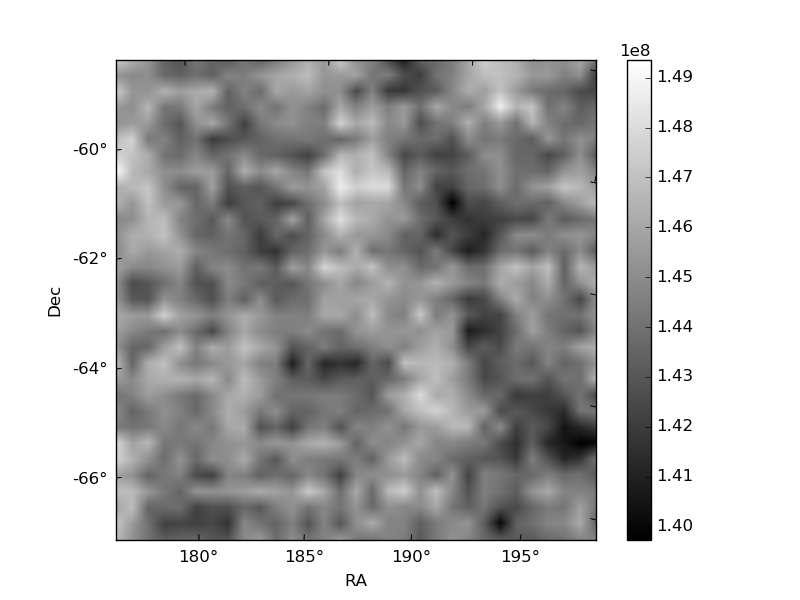
Quadrant B |
|---|---|---|---|
| Quadrant D | 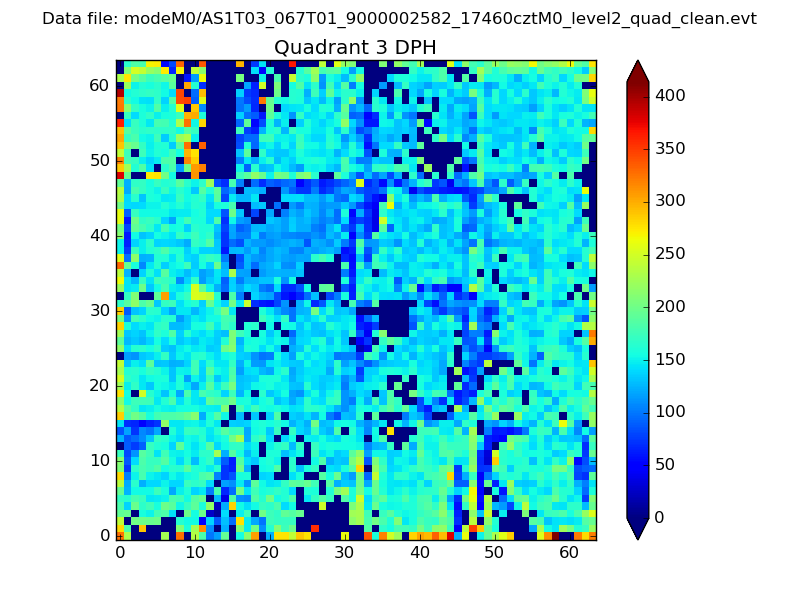 |
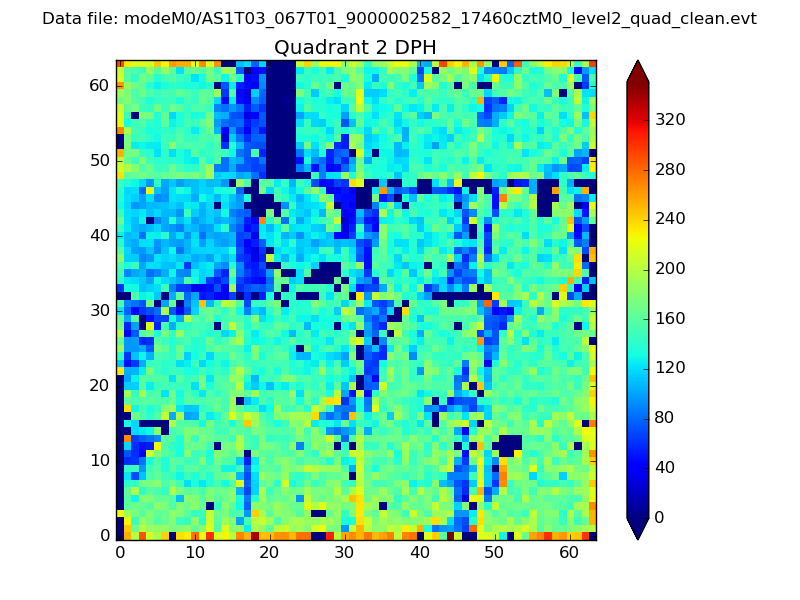 |
Quadrant C |
| Plot type | Count rate plots | Images |
|---|---|---|
| Comparison with Poisson distribution Blue bars denote a histogram of data divided into 1 sec bins. Red curve is a Poisson curve with rate = median count rate of data. |
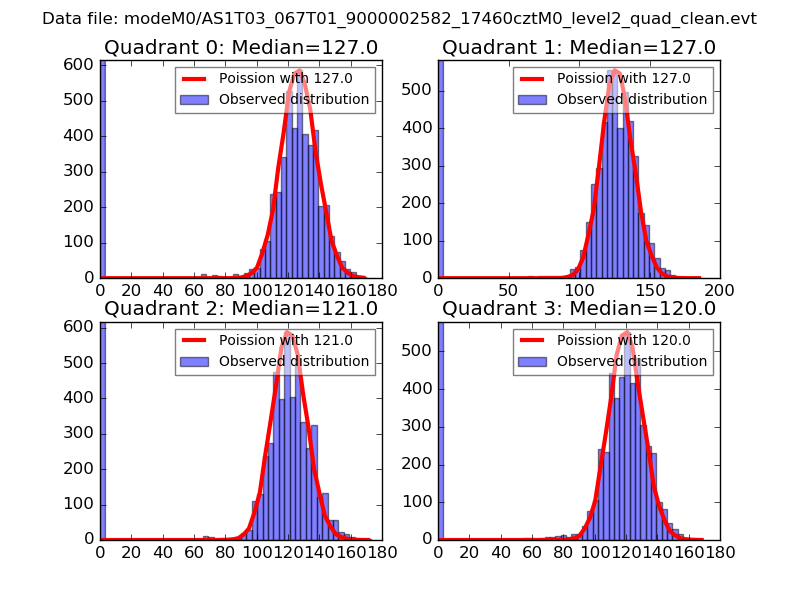 |
 |
| Quadrant-wise count rates Data is divided into 100 sec bins |
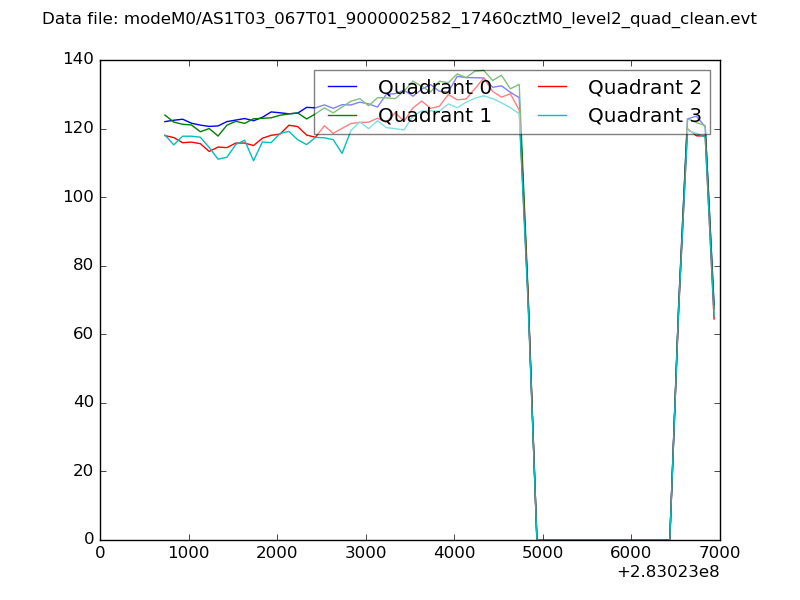 |
|
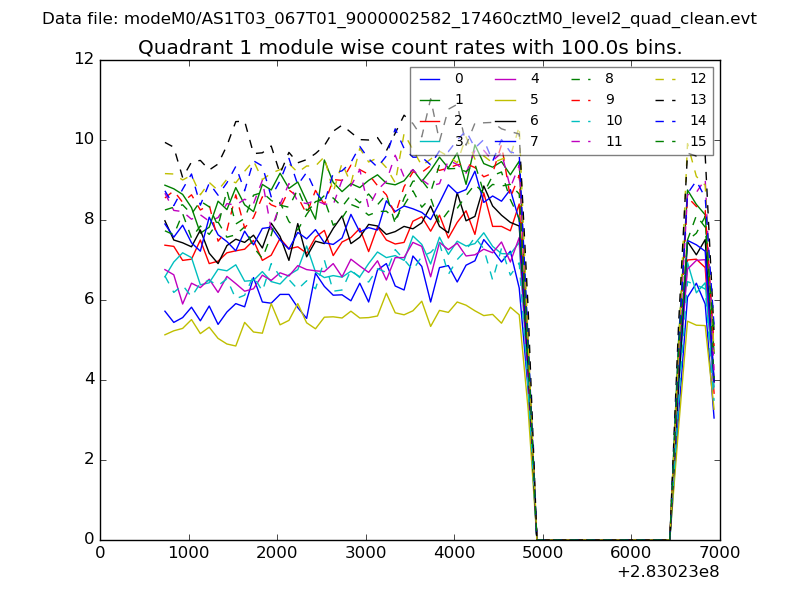
| Module-wise count rates for Quadrant A Data is divided into 100 sec bins |
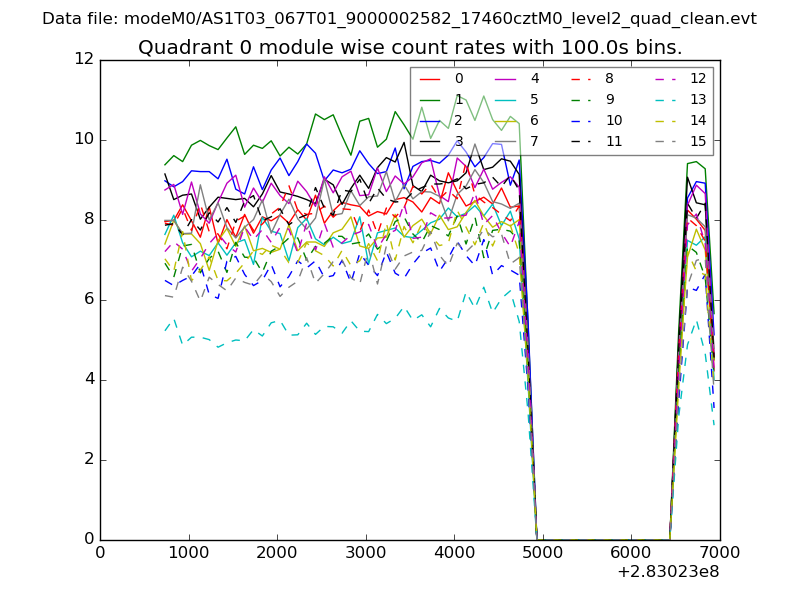 |
 |
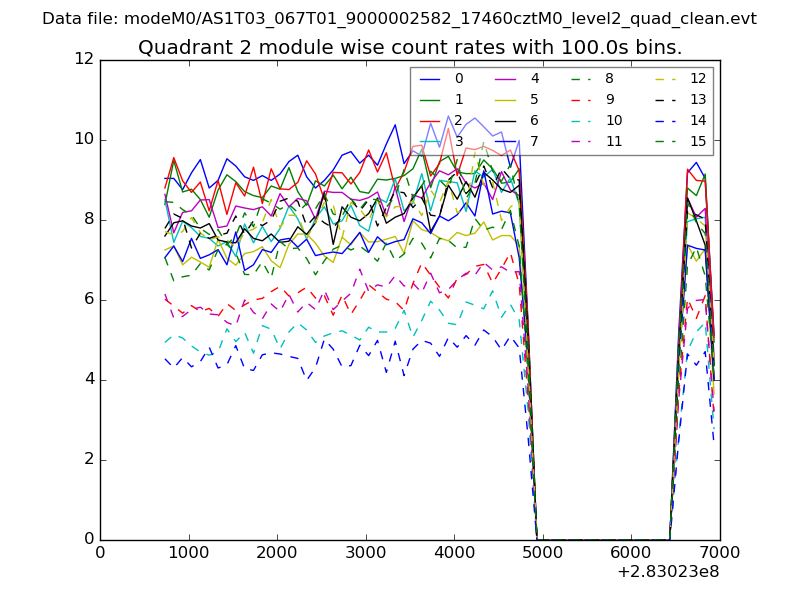
| Module-wise count rates for Quadrant B Data is divided into 100 sec bins |
 |
 |
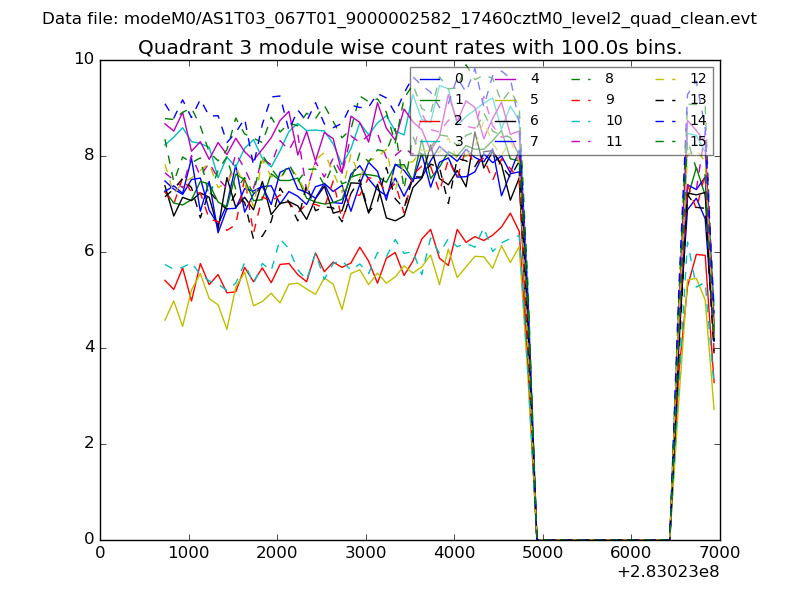
| Module-wise count rates for Quadrant C Data is divided into 100 sec bins |
 |
 |
| Module-wise count rates for Quadrant D Data is divided into 100 sec bins |
 |
 |
| Parameter | Plot |
|---|---|
| CZT HV Monitor | 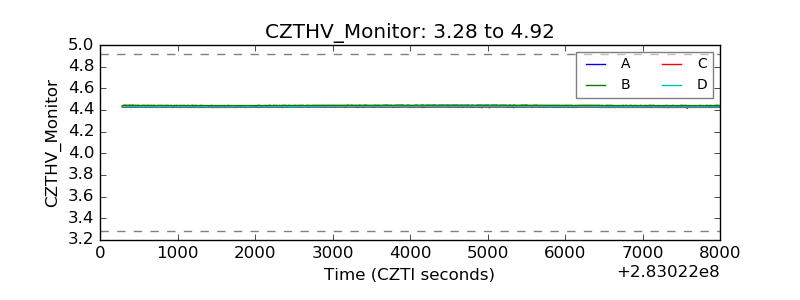 |
| D_VDD | 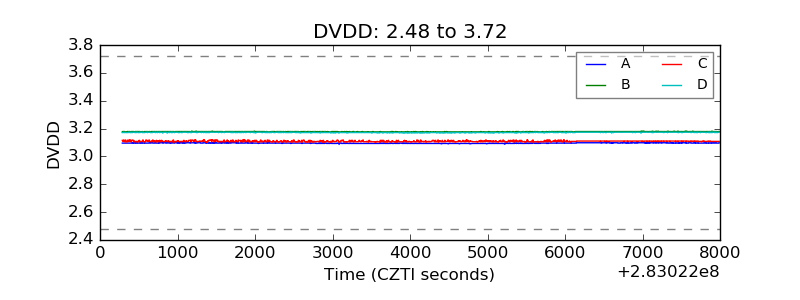 |
| Temperature 1 | 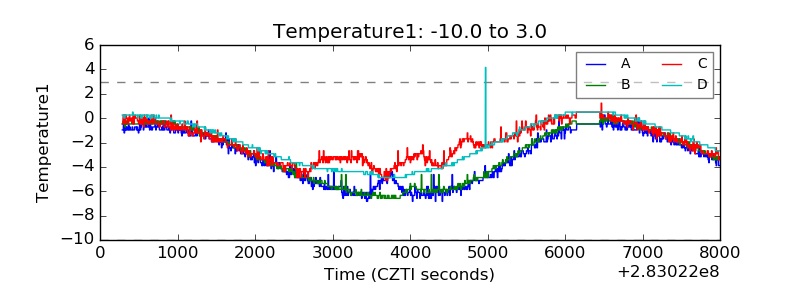 |
| Veto HV Monitor | 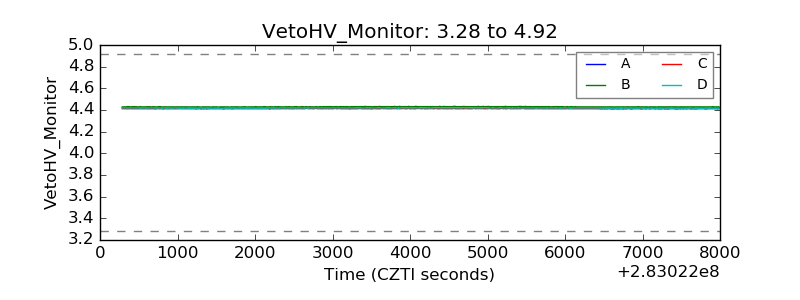 |
| Veto LLD | 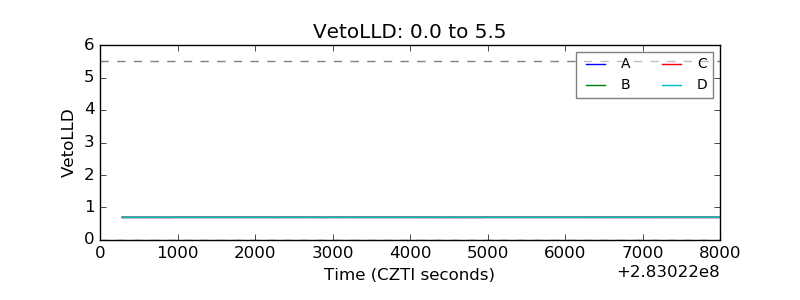 |
| Alpha Counter | 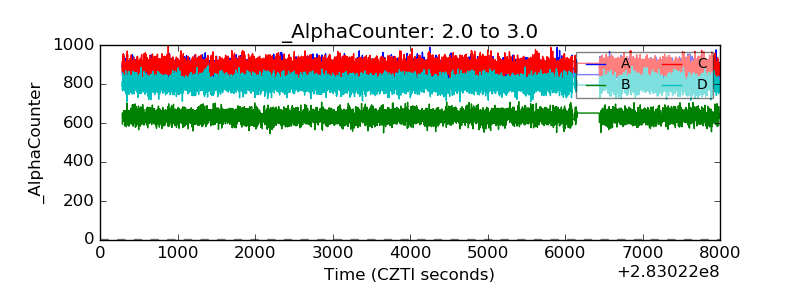 |
| _CPM_Rate | 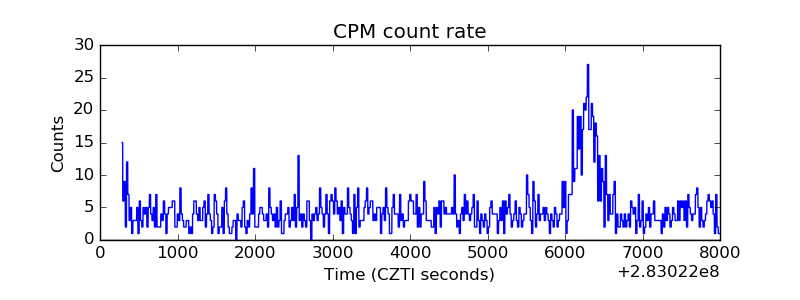 |
| CZT Counter | 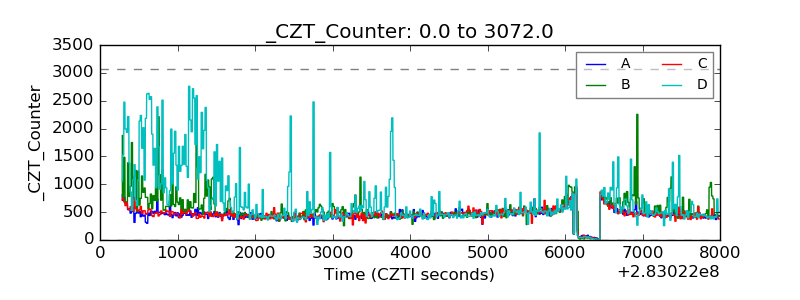 |
| +2.5 Volts monitor |  |
| +5 Volts monitor | 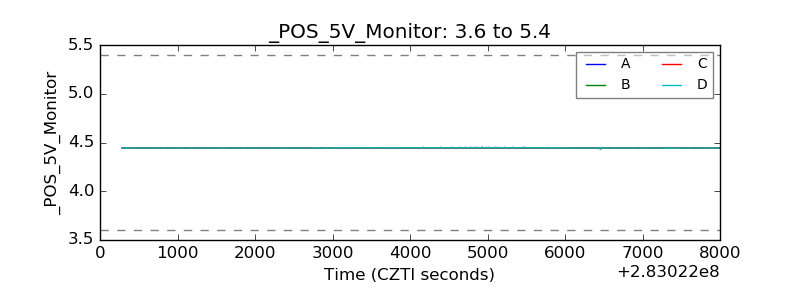 |
| _ROLL_ROT | 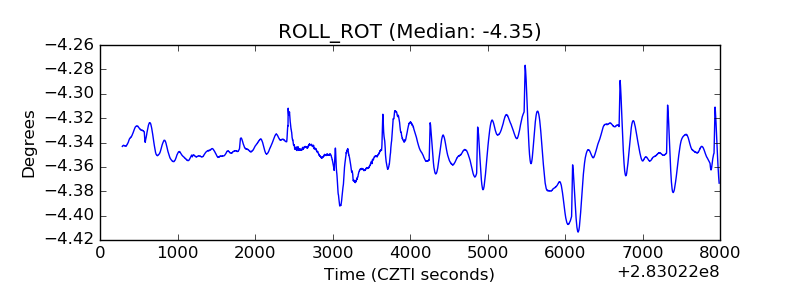 |
| _Roll_DEC | 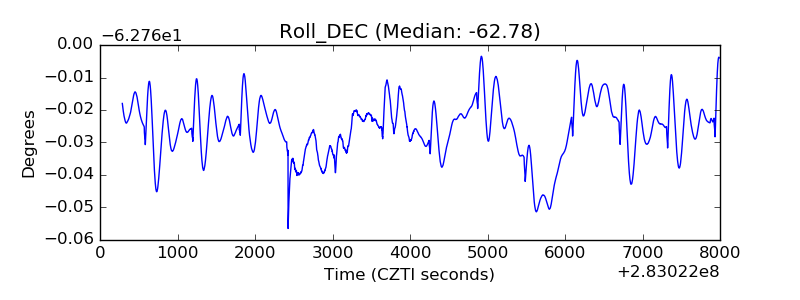 |
| _Roll_RA | 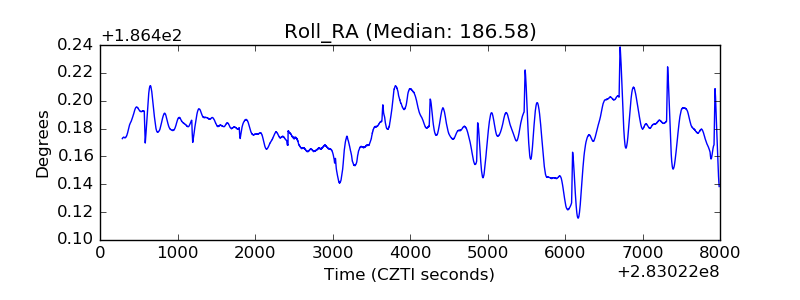 |
| Veto Counter | 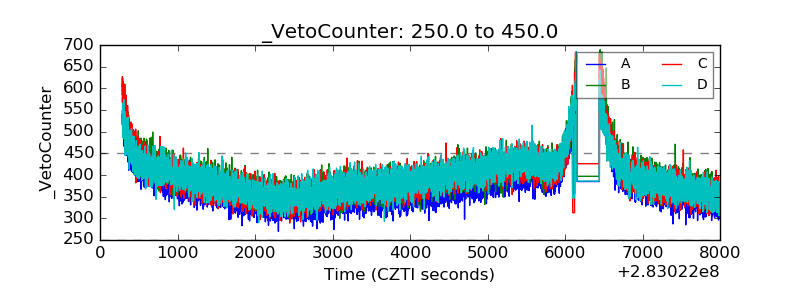 |