| Param | Original file | Final file |
|---|---|---|
| Filename | modeM0/AS1T03_067T01_9000002582_17461cztM0_level2.evt | modeM0/AS1T03_067T01_9000002582_17461cztM0_level2_quad_clean.evt |
| Size (bytes) | 559,776,960 | 99,515,520 |
| Size | 533.8 MB | 94.9 MB |
| Events in quadrant A | 3,706,462 | 631,116 |
| Events in quadrant B | 4,462,284 | 631,923 |
| Events in quadrant C | 3,695,934 | 607,635 |
| Events in quadrant D | 4,554,903 | 596,730 |
| Mode M0 | |||
|---|---|---|---|
| Quadrant | BADHDUFLAG | Total packets | Discarded packets |
| A | 0 | 16353 | 2 |
| B | 0 | 18566 | 2 |
| C | 0 | 16269 | 2 |
| D | 0 | 18864 | 2 |
| Mode SS | |||
|---|---|---|---|
| Quadrant | BADHDUFLAG | Total packets | Discarded packets |
| A | 0 | 162 | 0 |
| B | 0 | 162 | 0 |
| C | 0 | 162 | 0 |
| D | 0 | 162 | 0 |
| Mode M9 | |||
|---|---|---|---|
| Quadrant | BADHDUFLAG | Total packets | Discarded packets |
| A | 0 | 5 | 0 |
| B | 0 | 5 | 0 |
| C | 0 | 5 | 0 |
| D | 0 | 5 | 0 |
| Quadrant | Total seconds | Saturated seconds | Saturation percentage |
|---|---|---|---|
| A | 7855 | 102 | 1.298536% |
| B | 7856 | 269 | 3.424134% |
| C | 7856 | 127 | 1.616599% |
| D | 7856 | 139 | 1.769348% |
Noise dominated data is calculated using 1-second bins in cleaned event files. If a bin has >2000 counts, and if more than 50% of those come from <1% of pixels, then it is considered to be noise-dominated and hence unusable.
| Quadrant | # 1 sec bins | Bins with >0 counts | Bins with >2000 counts | High rate bins dominated by noise | Noise dominated (total time) | Noise dominated (detector-on time) | Marked lightcurve |
|---|---|---|---|---|---|---|---|
| A | 8415 | 7859 | 5 | 5 | 0.06% | 0.06% | 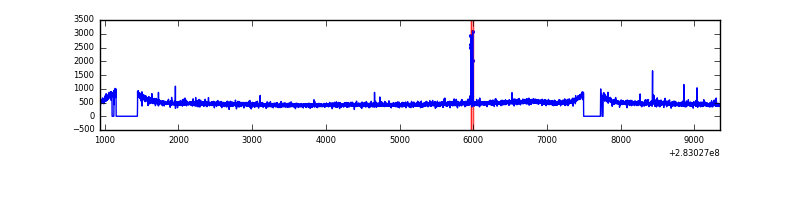 |
| B | 8416 | 7860 | 51 | 51 | 0.61% | 0.65% | 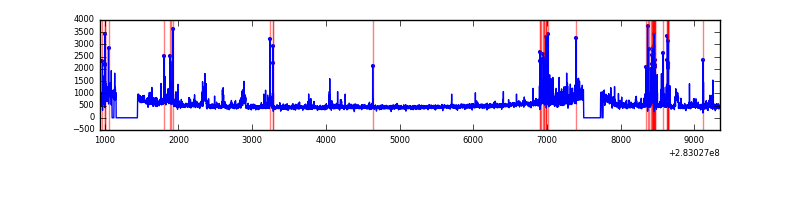 |
| C | 8416 | 7860 | 0 | 0 | 0.00% | 0.00% | 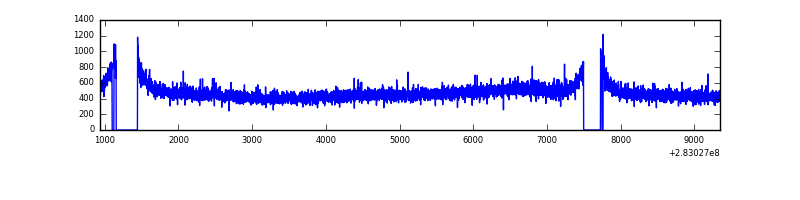 |
| D | 8416 | 7860 | 61 | 61 | 0.72% | 0.78% | 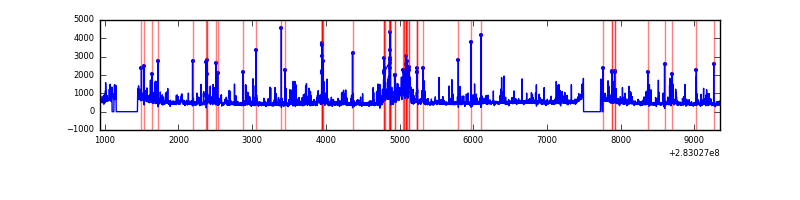 |
Top three noisy pixels from each quadrant. If the there are fewer than three noisy pixels in the level2.evt file, extra rows are filled as -1
| Pixel properties | Quadrant properties | ||||||
|---|---|---|---|---|---|---|---|
| Quadrant | DetID | PixID | Counts | Sigma | Mean | Median | Sigma |
| A | 15 | 174 | 28308 | 141.05 | 951 | 930 | 194.1 |
| A | 12 | 96 | 16796 | 81.74 | 951 | 930 | 194.1 |
| A | 0 | 226 | 8526 | 39.14 | 951 | 930 | 194.1 |
| B | 7 | 220 | 263350 | 1464.52 | 946 | 923 | 179.2 |
| B | 4 | 216 | 164683 | 913.89 | 946 | 923 | 179.2 |
| B | 15 | 35 | 122302 | 677.38 | 946 | 923 | 179.2 |
| C | 14 | 238 | 137481 | 646.25 | 902 | 905 | 211.3 |
| C | 3 | 233 | 23727 | 107.99 | 902 | 905 | 211.3 |
| C | 5 | 218 | 8783 | 37.28 | 902 | 905 | 211.3 |
| D | 13 | 189 | 466560 | 2092.74 | 917 | 888 | 222.5 |
| D | 13 | 232 | 264152 | 1183.11 | 917 | 888 | 222.5 |
| D | 13 | 168 | 127061 | 567.02 | 917 | 888 | 222.5 |
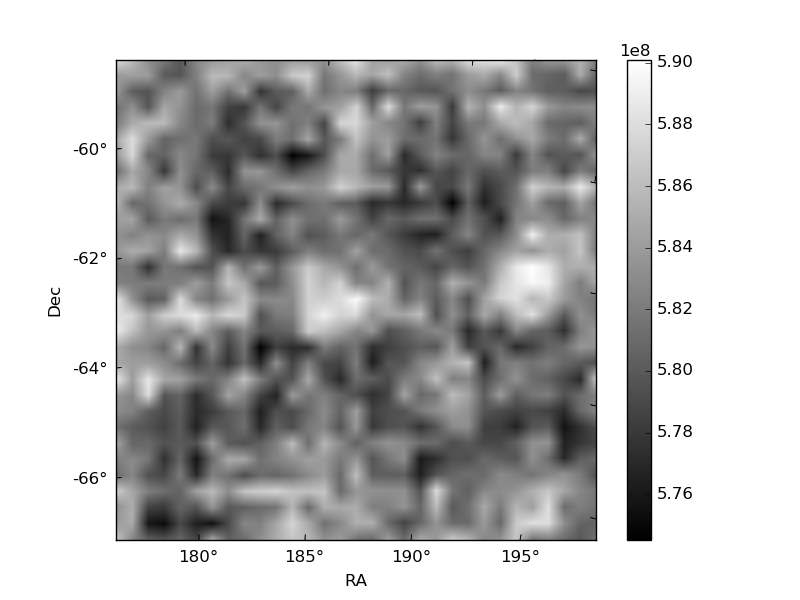
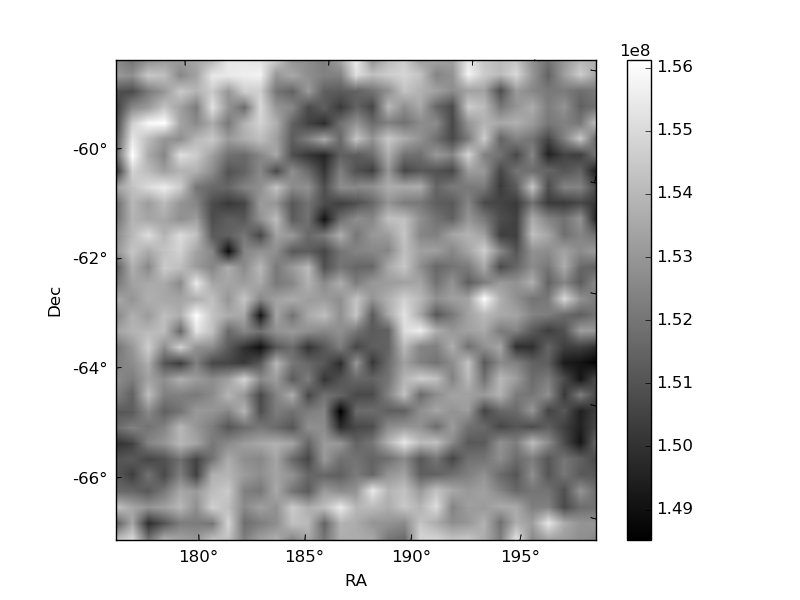
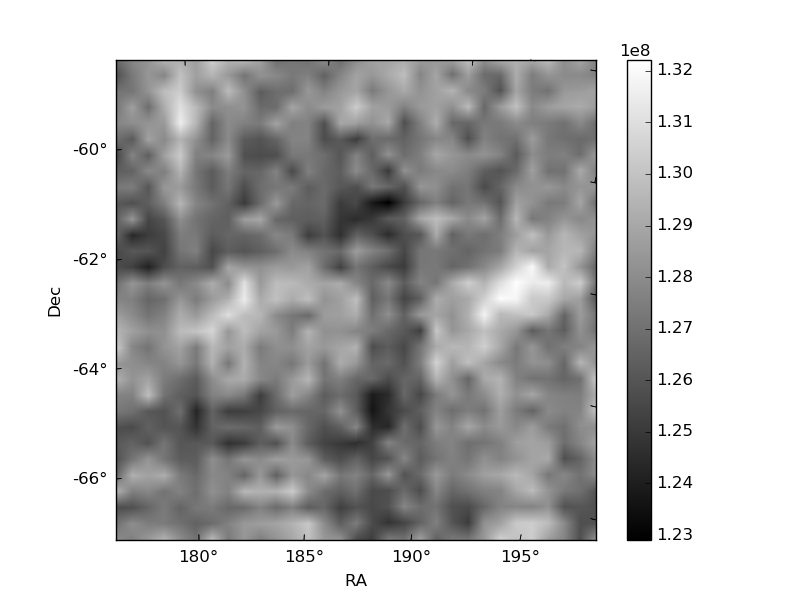
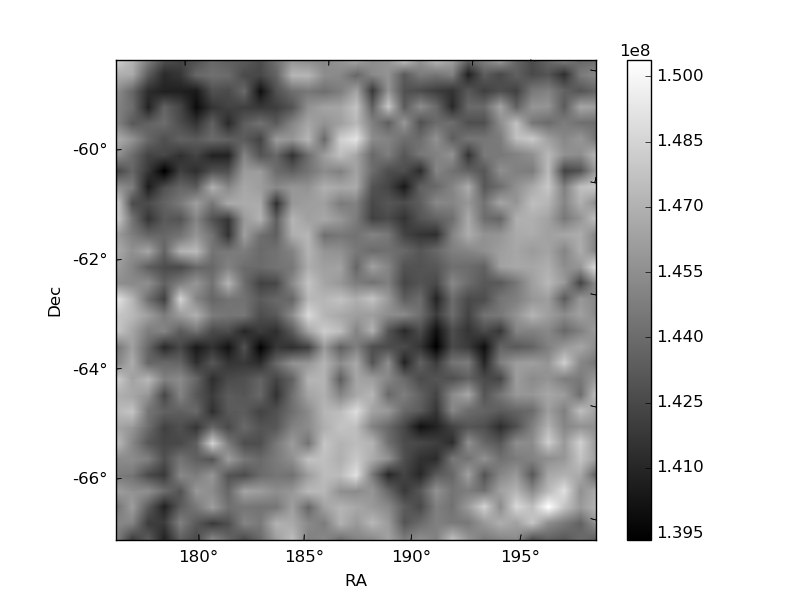
Histogram calculated using DETX and DETY for each event in the final _common_clean file
| Quadrant A | 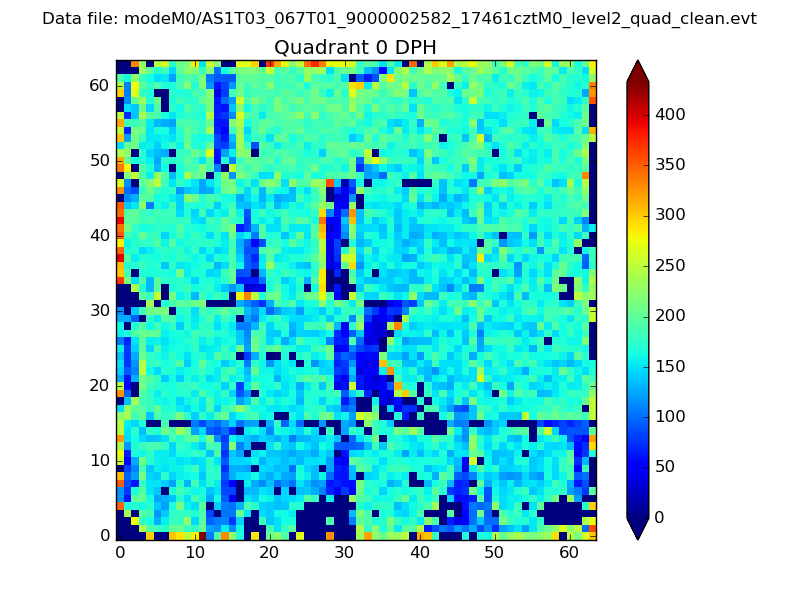 |
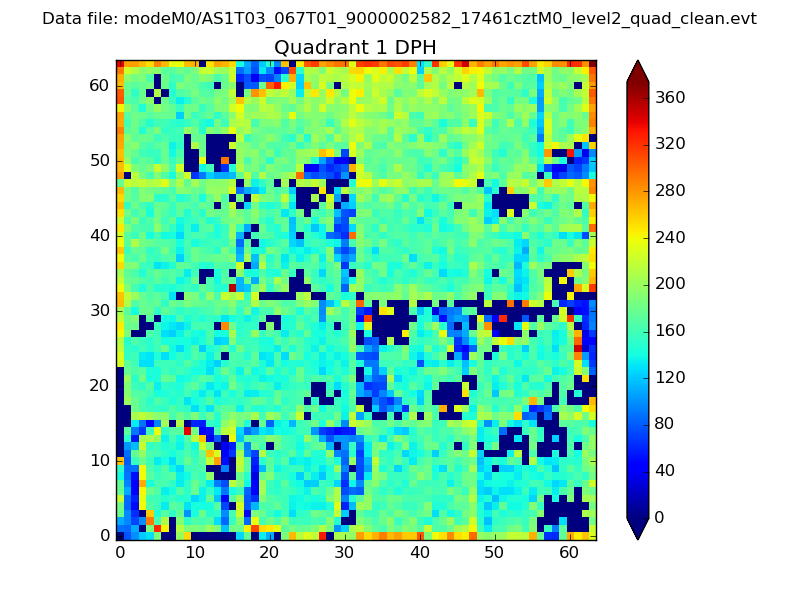 |
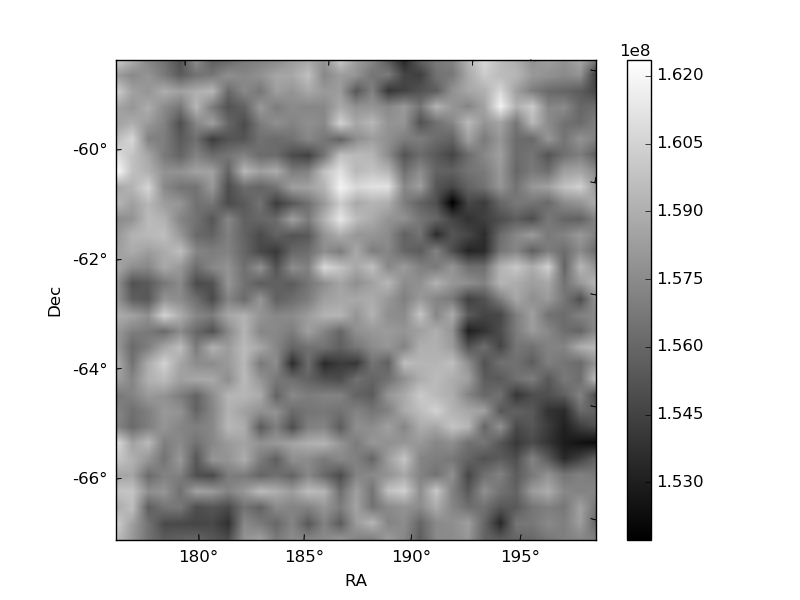
Quadrant B |
|---|---|---|---|
| Quadrant D | 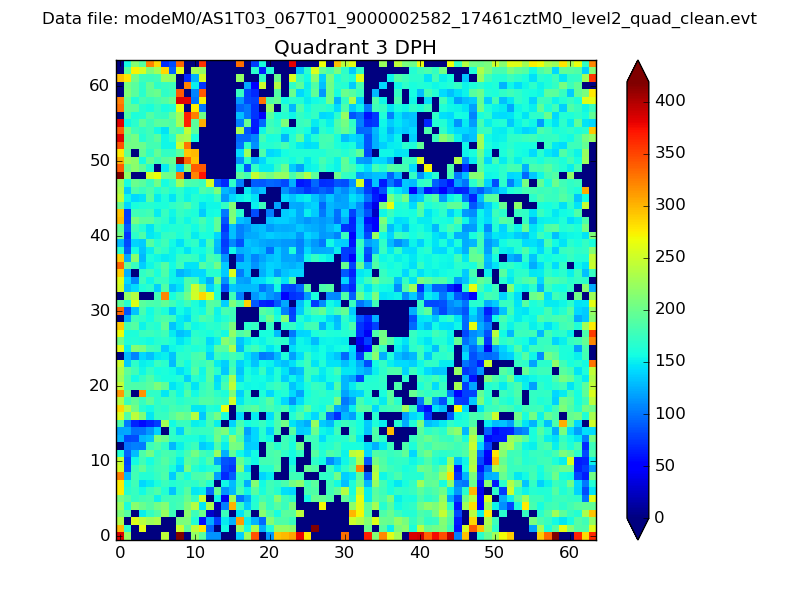 |
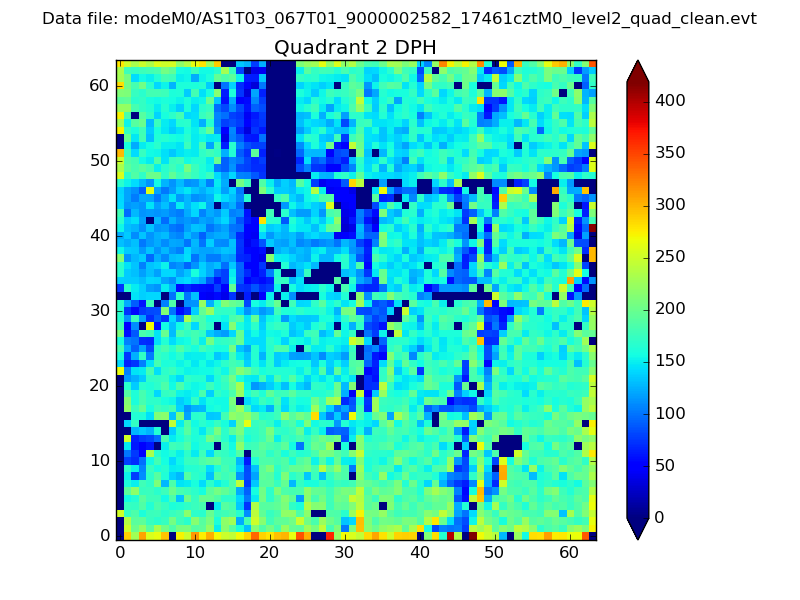 |
Quadrant C |
| Plot type | Count rate plots | Images |
|---|---|---|
| Comparison with Poisson distribution Blue bars denote a histogram of data divided into 1 sec bins. Red curve is a Poisson curve with rate = median count rate of data. |
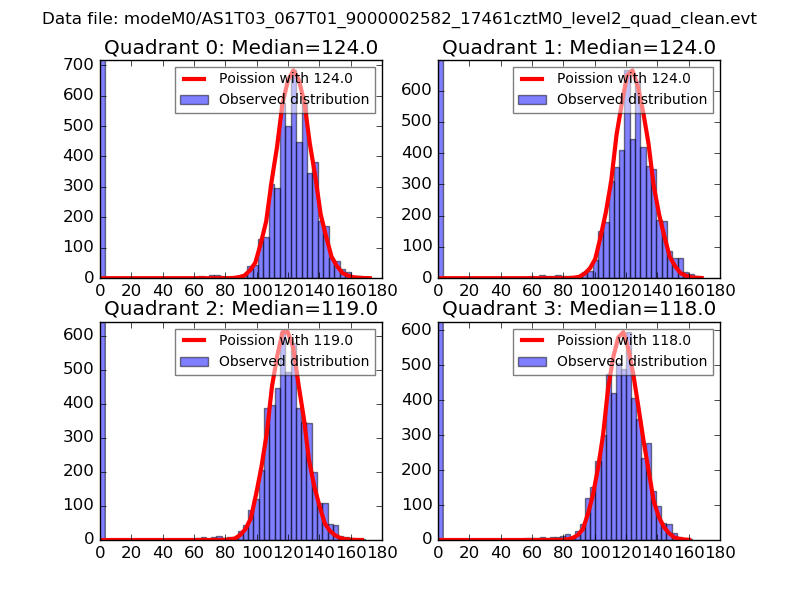 |
 |
| Quadrant-wise count rates Data is divided into 100 sec bins |
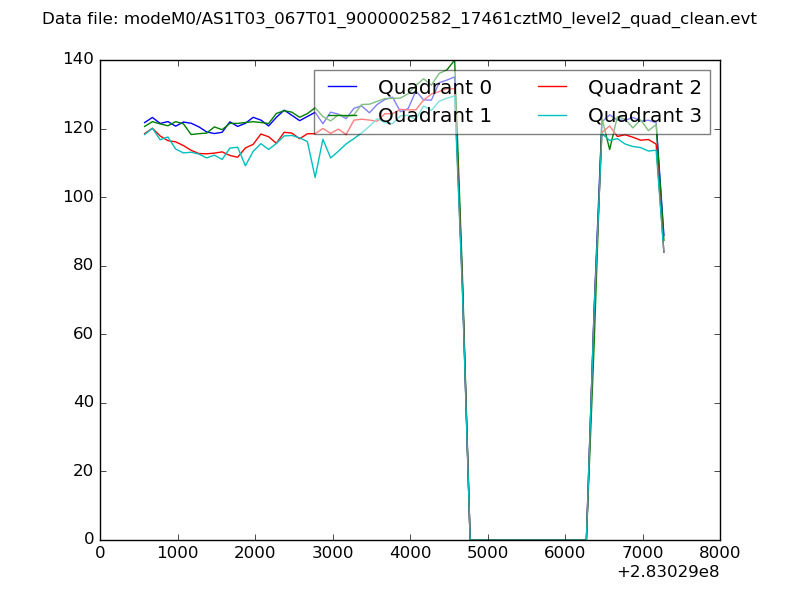 |
|
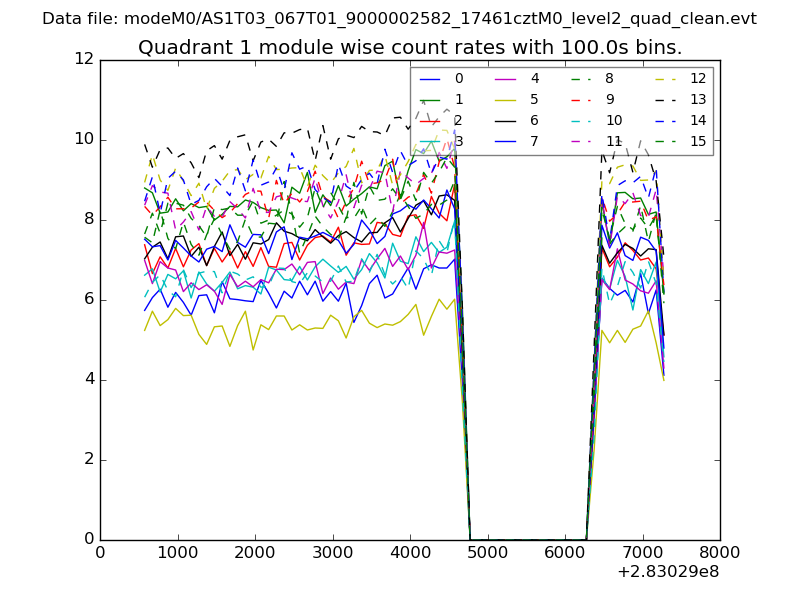
| Module-wise count rates for Quadrant A Data is divided into 100 sec bins |
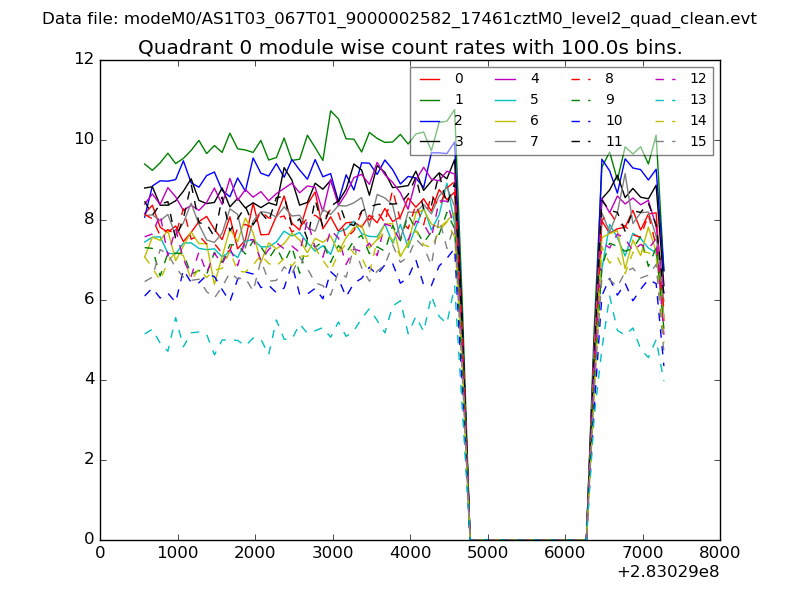 |
 |
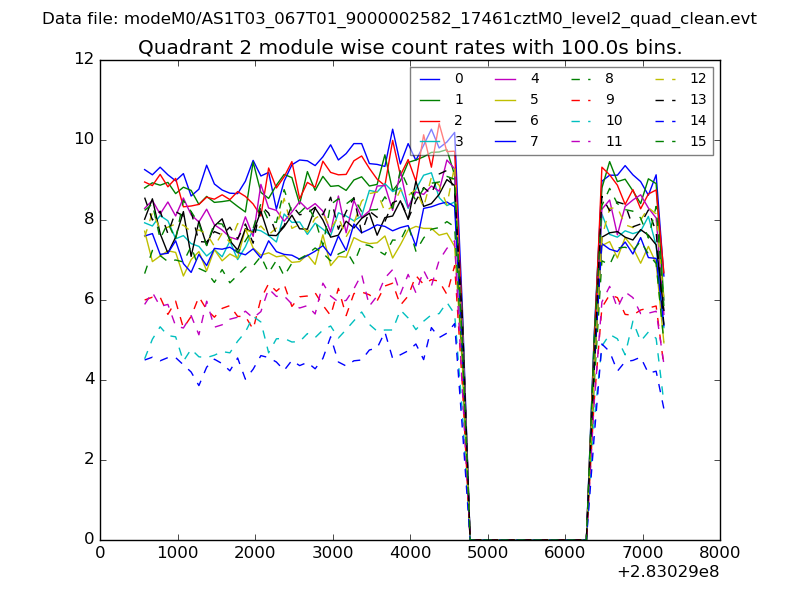
| Module-wise count rates for Quadrant B Data is divided into 100 sec bins |
 |
 |
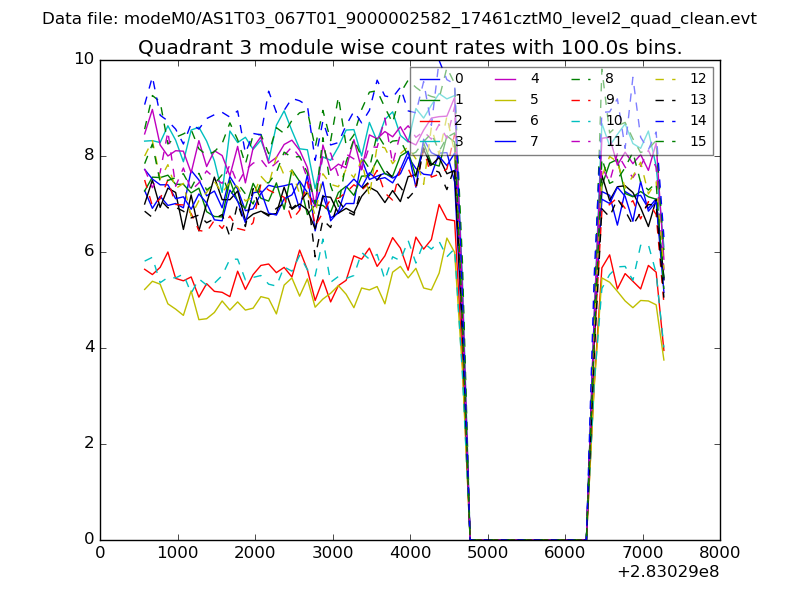
| Module-wise count rates for Quadrant C Data is divided into 100 sec bins |
 |
 |
| Module-wise count rates for Quadrant D Data is divided into 100 sec bins |
 |
 |
| Parameter | Plot |
|---|---|
| CZT HV Monitor | 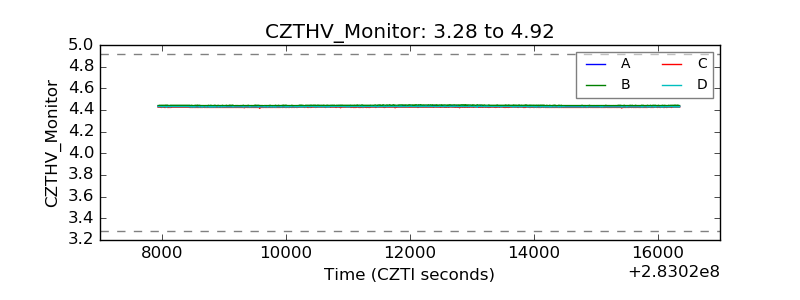 |
| D_VDD | 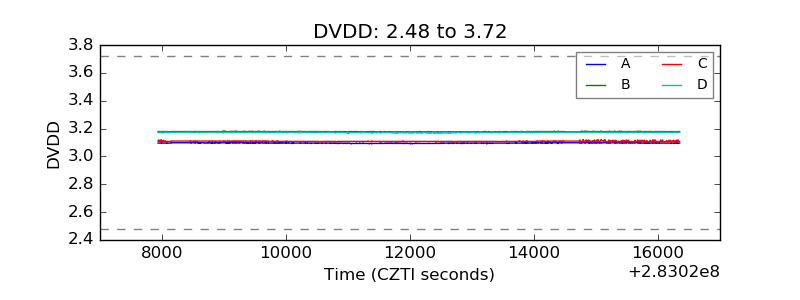 |
| Temperature 1 | 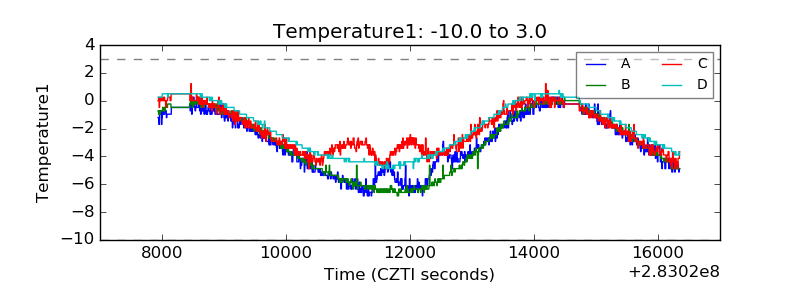 |
| Veto HV Monitor | 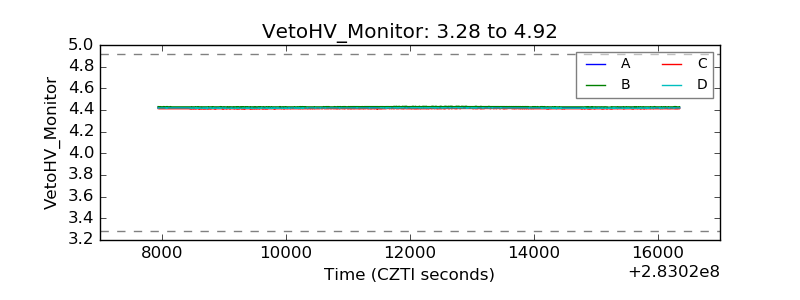 |
| Veto LLD | 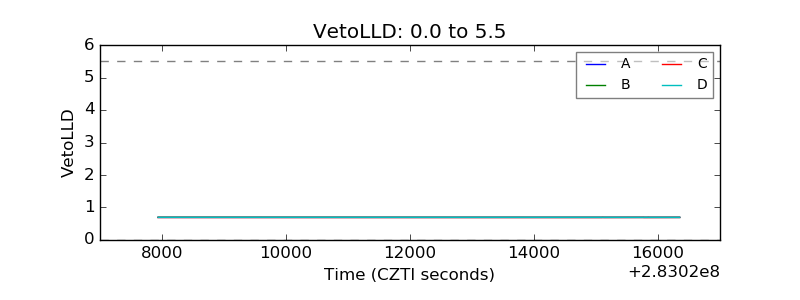 |
| Alpha Counter | 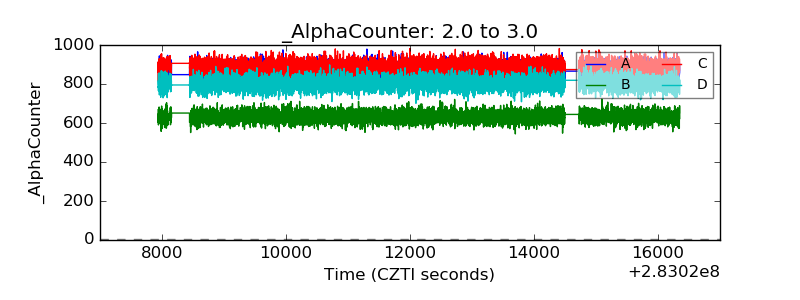 |
| _CPM_Rate | 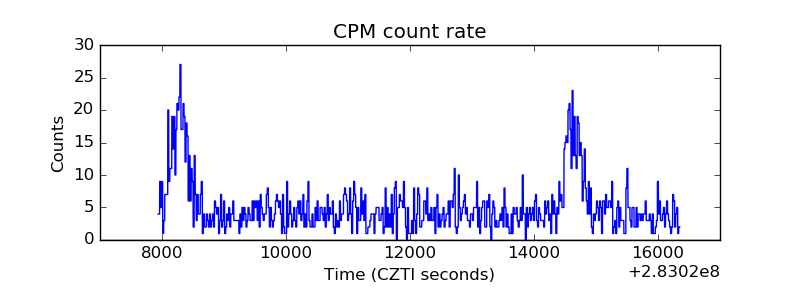 |
| CZT Counter | 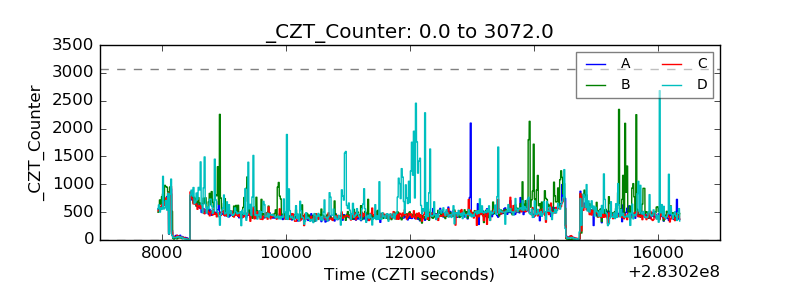 |
| +2.5 Volts monitor |  |
| +5 Volts monitor |  |
| _ROLL_ROT | 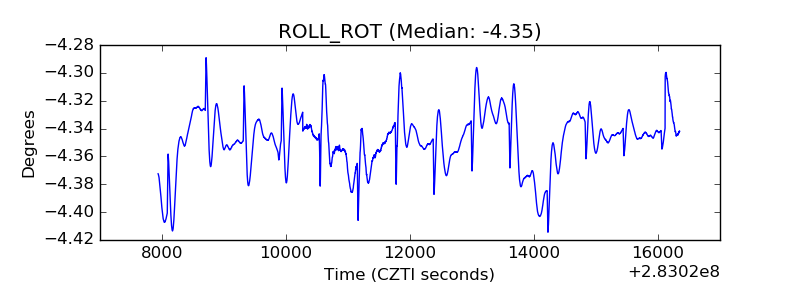 |
| _Roll_DEC | 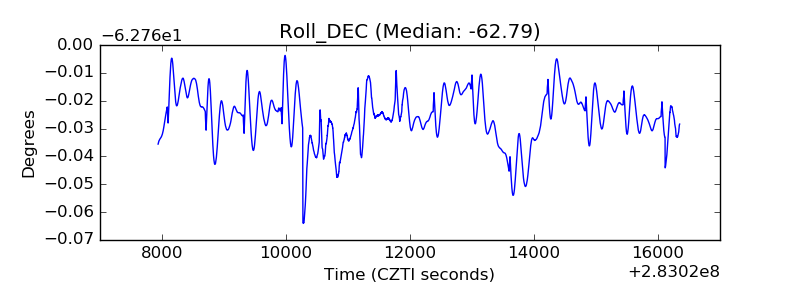 |
| _Roll_RA | 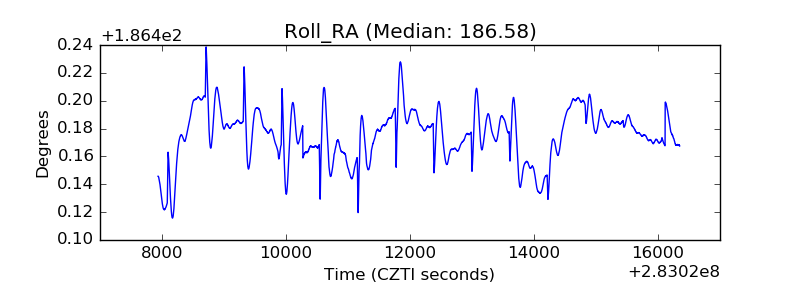 |
| Veto Counter | 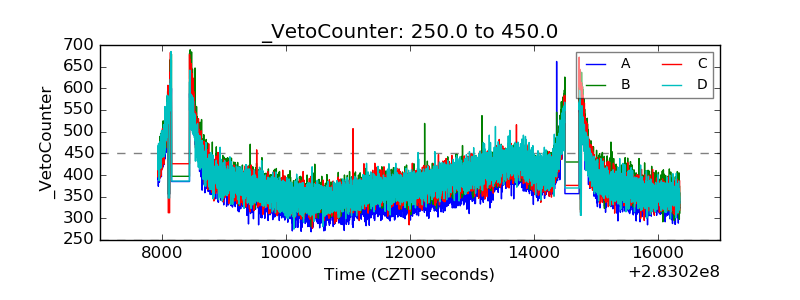 |