| Param | Original file | Final file |
|---|---|---|
| Filename | modeM0/AS1T03_067T01_9000002582_17462cztM0_level2.evt | modeM0/AS1T03_067T01_9000002582_17462cztM0_level2_quad_clean.evt |
| Size (bytes) | 508,898,880 | 106,015,680 |
| Size | 485.3 MB | 101.1 MB |
| Events in quadrant A | 3,334,782 | 691,647 |
| Events in quadrant B | 3,989,896 | 691,326 |
| Events in quadrant C | 3,360,585 | 665,452 |
| Events in quadrant D | 4,230,571 | 653,729 |
| Mode M0 | |||
|---|---|---|---|
| Quadrant | BADHDUFLAG | Total packets | Discarded packets |
| A | 0 | 14894 | 1 |
| B | 0 | 16787 | 1 |
| C | 0 | 14863 | 1 |
| D | 0 | 17647 | 1 |
| Mode SS | |||
|---|---|---|---|
| Quadrant | BADHDUFLAG | Total packets | Discarded packets |
| A | 0 | 146 | 0 |
| B | 0 | 146 | 0 |
| C | 0 | 146 | 0 |
| D | 0 | 146 | 0 |
| Mode M9 | |||
|---|---|---|---|
| Quadrant | BADHDUFLAG | Total packets | Discarded packets |
| A | 0 | 5 | 0 |
| B | 0 | 5 | 0 |
| C | 0 | 5 | 0 |
| D | 0 | 5 | 0 |
| Quadrant | Total seconds | Saturated seconds | Saturation percentage |
|---|---|---|---|
| A | 7313 | 23 | 0.314508% |
| B | 7313 | 134 | 1.832353% |
| C | 7313 | 31 | 0.423903% |
| D | 7314 | 116 | 1.585999% |
Noise dominated data is calculated using 1-second bins in cleaned event files. If a bin has >2000 counts, and if more than 50% of those come from <1% of pixels, then it is considered to be noise-dominated and hence unusable.
| Quadrant | # 1 sec bins | Bins with >0 counts | Bins with >2000 counts | High rate bins dominated by noise | Noise dominated (total time) | Noise dominated (detector-on time) | Marked lightcurve |
|---|---|---|---|---|---|---|---|
| A | 7723 | 7314 | 2 | 2 | 0.03% | 0.03% | 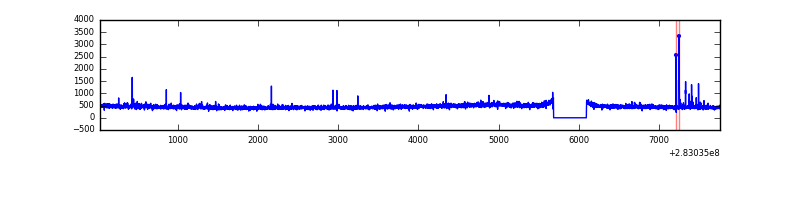 |
| B | 7723 | 7314 | 48 | 48 | 0.62% | 0.66% | 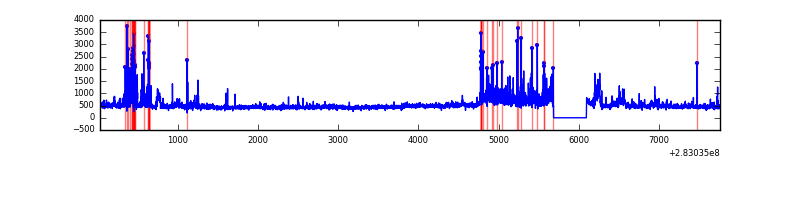 |
| C | 7723 | 7314 | 0 | 0 | 0.00% | 0.00% | 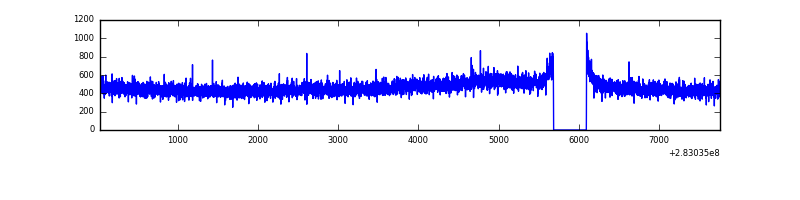 |
| D | 7724 | 7315 | 88 | 88 | 1.14% | 1.20% | 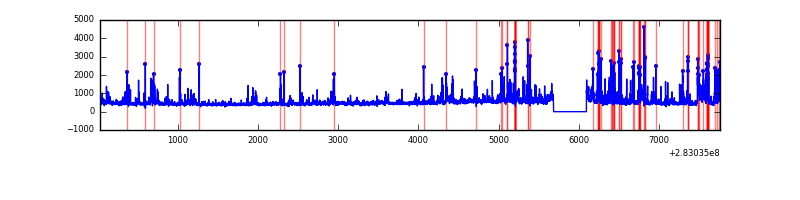 |
Top three noisy pixels from each quadrant. If the there are fewer than three noisy pixels in the level2.evt file, extra rows are filled as -1
| Pixel properties | Quadrant properties | ||||||
|---|---|---|---|---|---|---|---|
| Quadrant | DetID | PixID | Counts | Sigma | Mean | Median | Sigma |
| A | 12 | 96 | 44448 | 250.94 | 854 | 834 | 173.8 |
| A | 0 | 226 | 7576 | 38.79 | 854 | 834 | 173.8 |
| A | 12 | 194 | 6373 | 31.87 | 854 | 834 | 173.8 |
| B | 7 | 220 | 328460 | 2039.31 | 851 | 829 | 160.7 |
| B | 15 | 35 | 114434 | 707.12 | 851 | 829 | 160.7 |
| B | 4 | 216 | 38133 | 232.2 | 851 | 829 | 160.7 |
| C | 14 | 238 | 125115 | 653.6 | 812 | 816 | 190.2 |
| C | 3 | 233 | 45472 | 234.81 | 812 | 816 | 190.2 |
| C | 8 | 128 | 8259 | 39.14 | 812 | 816 | 190.2 |
| D | 13 | 189 | 239044 | 1197.74 | 821 | 799 | 198.9 |
| D | 13 | 232 | 222685 | 1115.5 | 821 | 799 | 198.9 |
| D | 6 | 234 | 111334 | 555.7 | 821 | 799 | 198.9 |
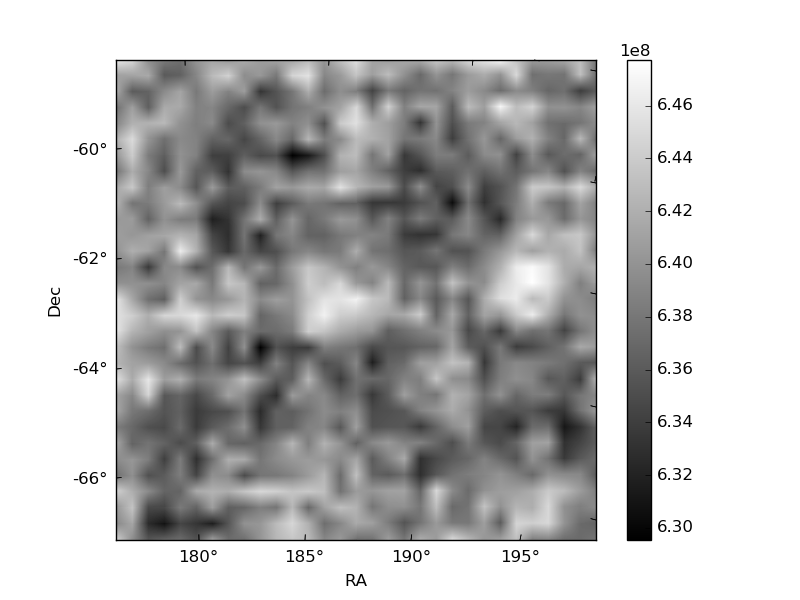
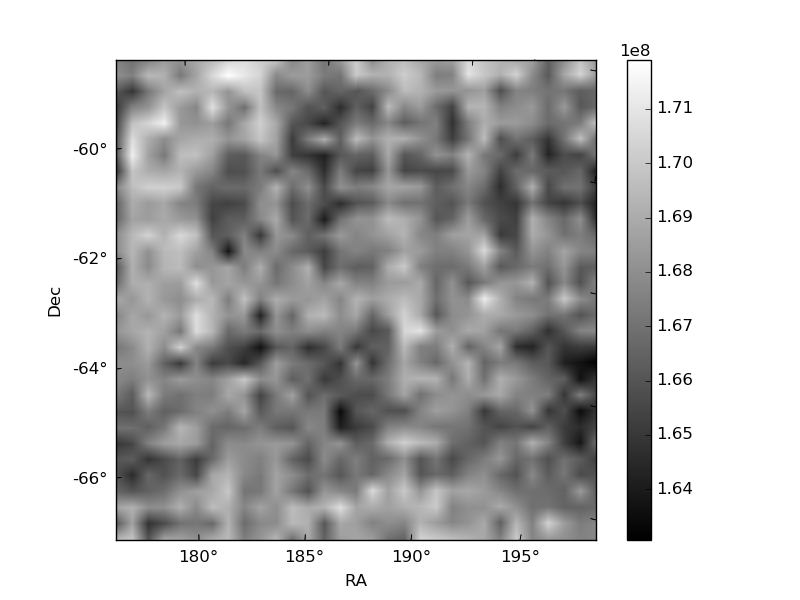
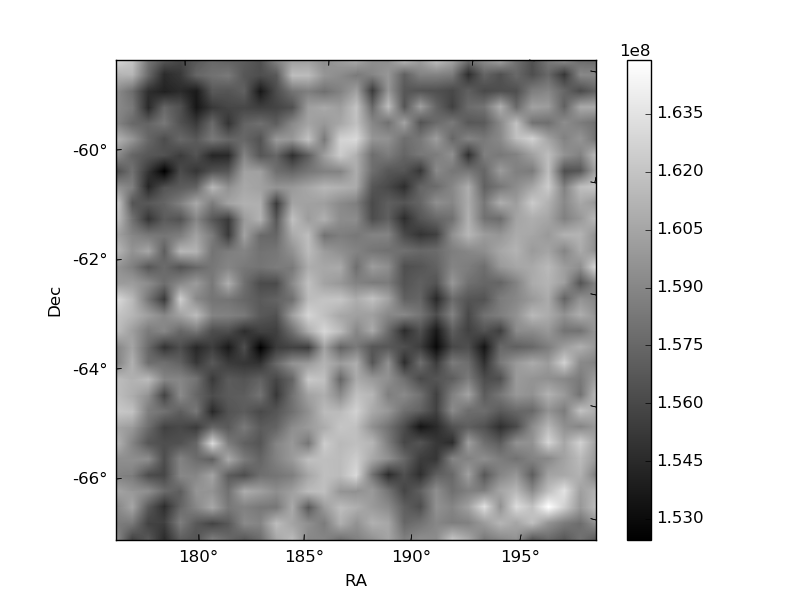
Histogram calculated using DETX and DETY for each event in the final _common_clean file
| Quadrant A | 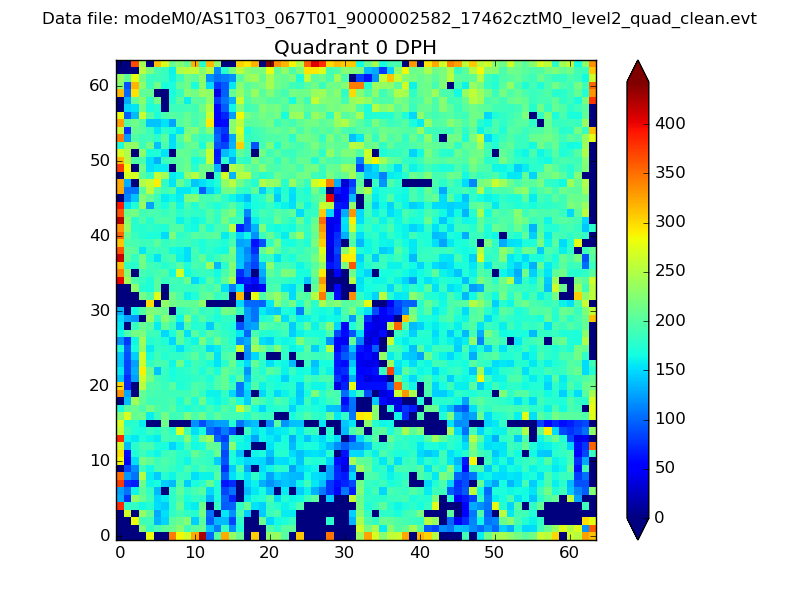 |
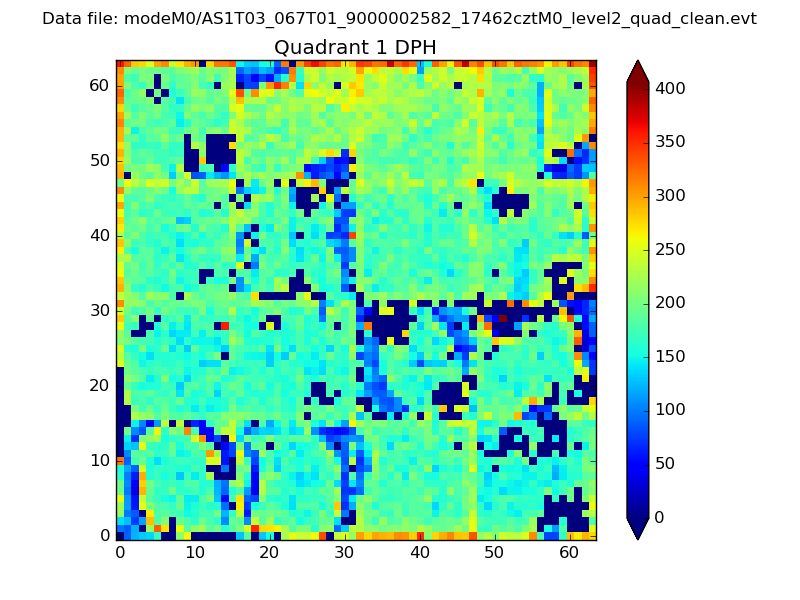 |
Quadrant B |
|---|---|---|---|
| Quadrant D | 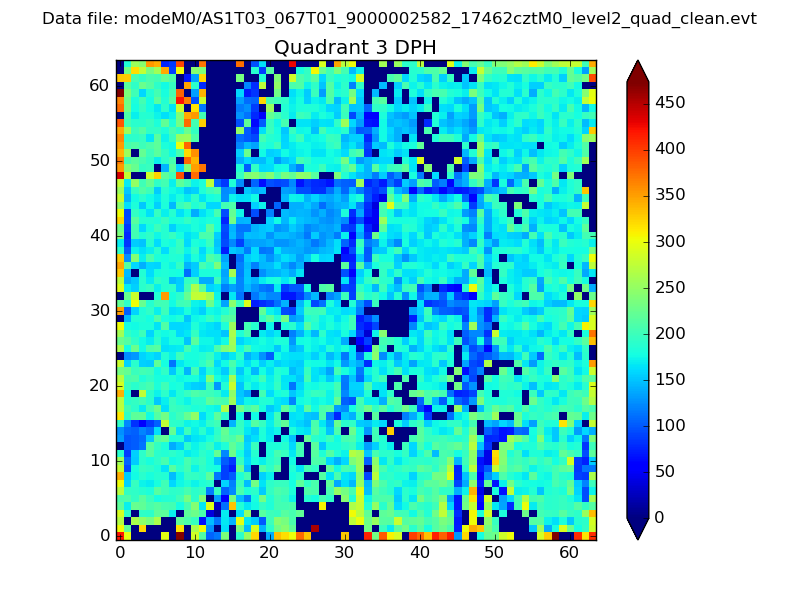 |
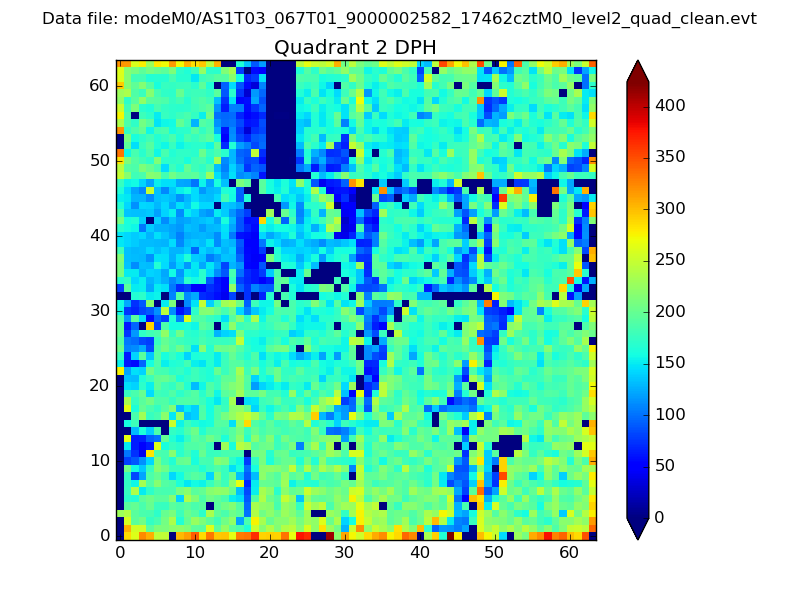 |
Quadrant C |
| Plot type | Count rate plots | Images |
|---|---|---|
| Comparison with Poisson distribution Blue bars denote a histogram of data divided into 1 sec bins. Red curve is a Poisson curve with rate = median count rate of data. |
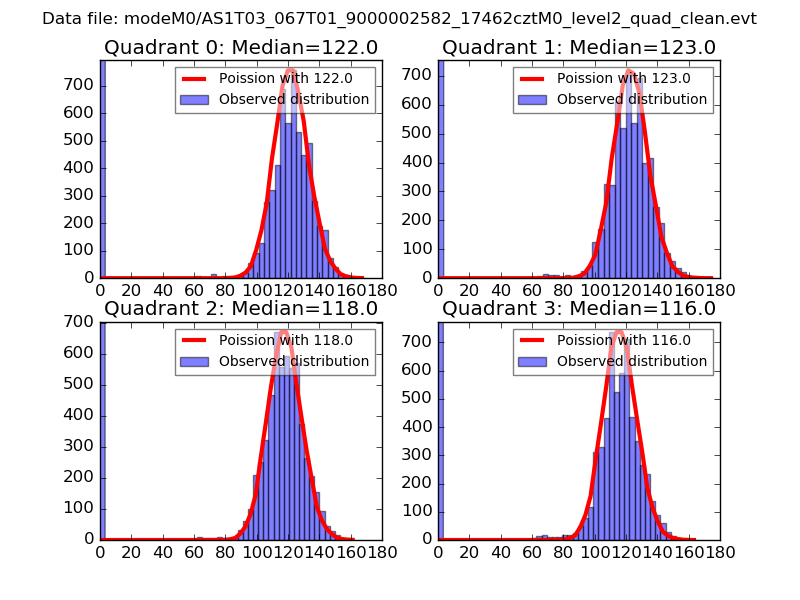 |
 |
| Quadrant-wise count rates Data is divided into 100 sec bins |
 |
|
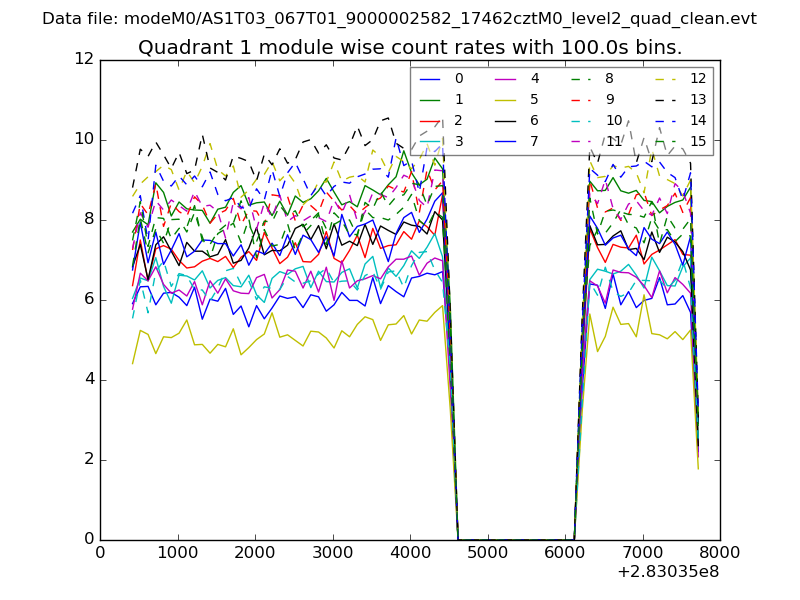
| Module-wise count rates for Quadrant A Data is divided into 100 sec bins |
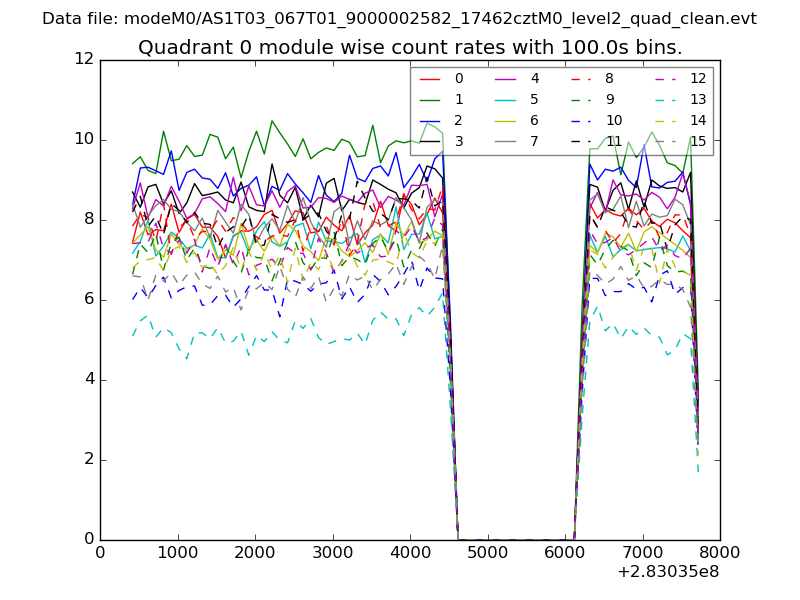 |
 |
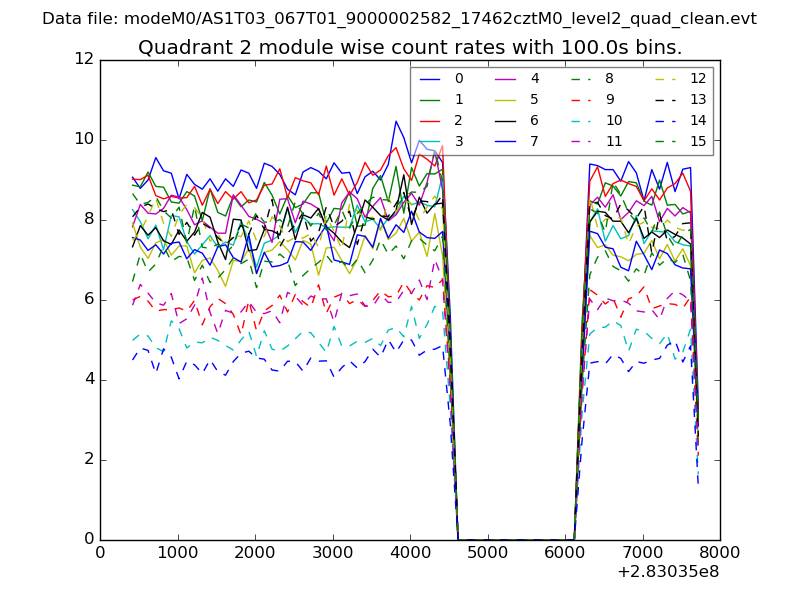
| Module-wise count rates for Quadrant B Data is divided into 100 sec bins |
 |
 |
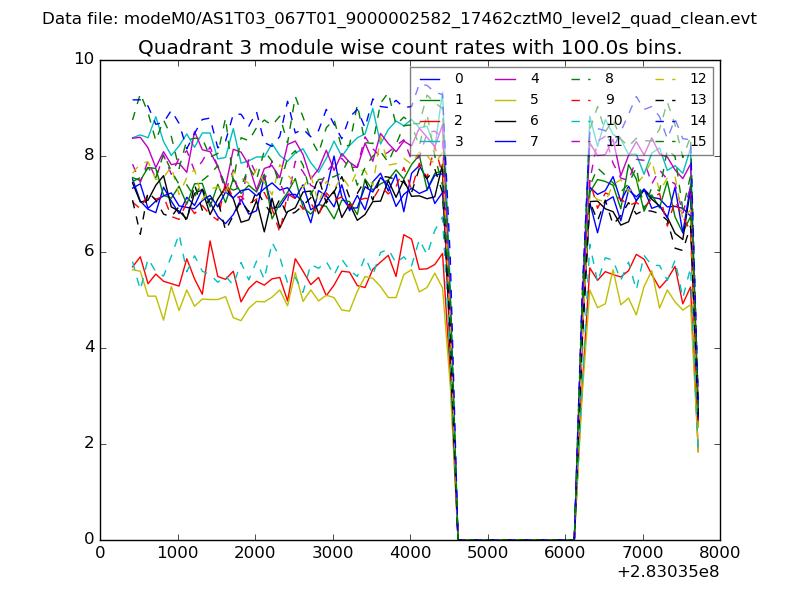
| Module-wise count rates for Quadrant C Data is divided into 100 sec bins |
 |
 |
| Module-wise count rates for Quadrant D Data is divided into 100 sec bins |
 |
 |
| Parameter | Plot |
|---|---|
| CZT HV Monitor | 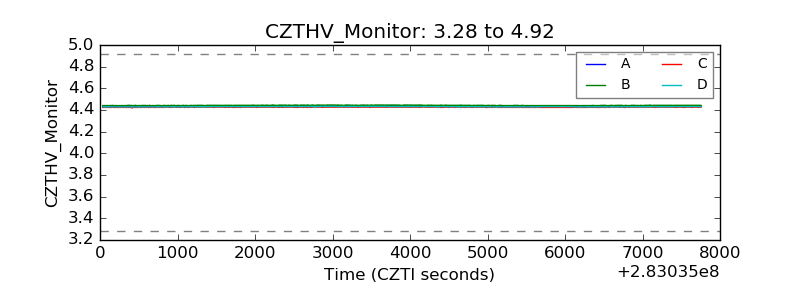 |
| D_VDD | 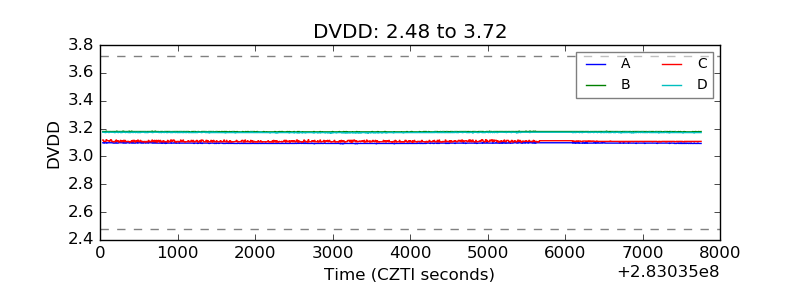 |
| Temperature 1 | 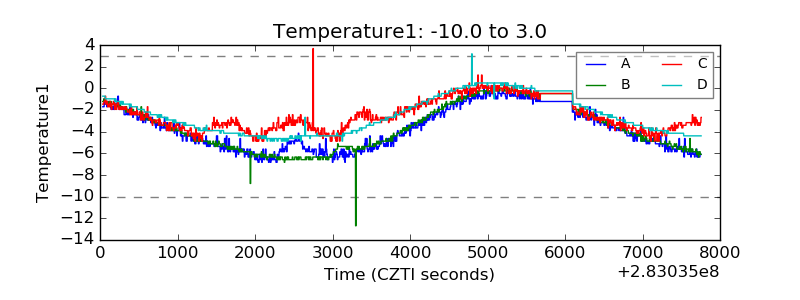 |
| Veto HV Monitor | 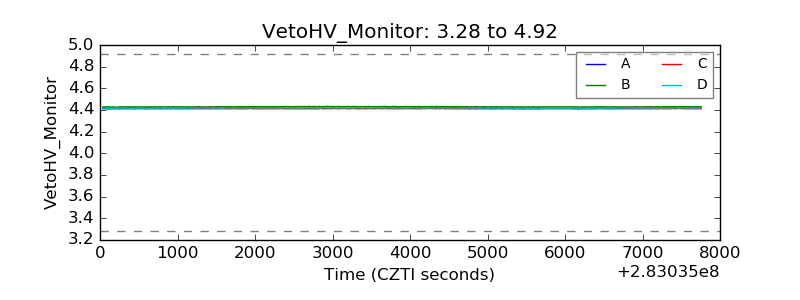 |
| Veto LLD | 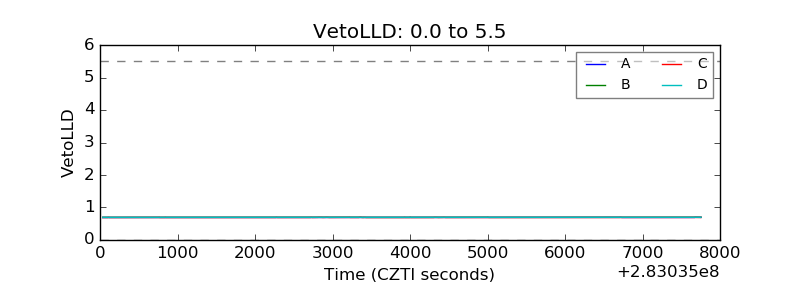 |
| Alpha Counter |  |
| _CPM_Rate | 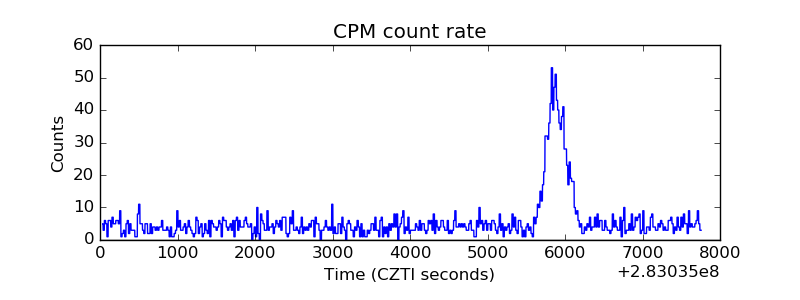 |
| CZT Counter | 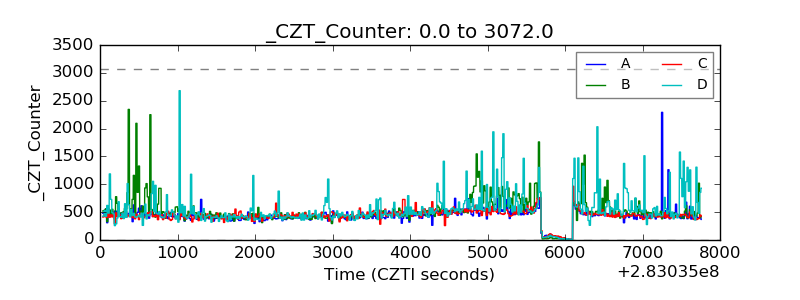 |
| +2.5 Volts monitor | 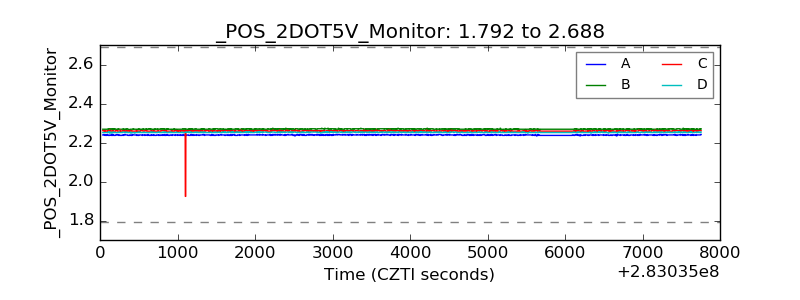 |
| +5 Volts monitor |  |
| _ROLL_ROT | 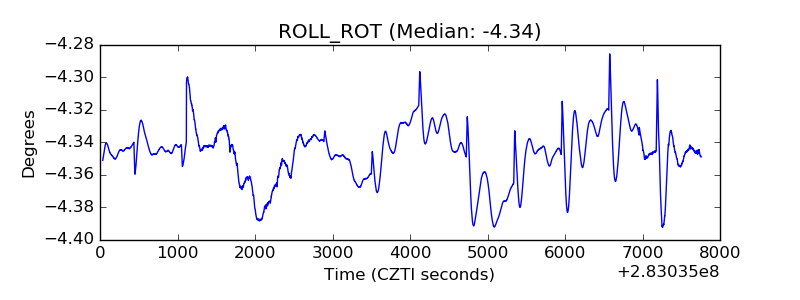 |
| _Roll_DEC | 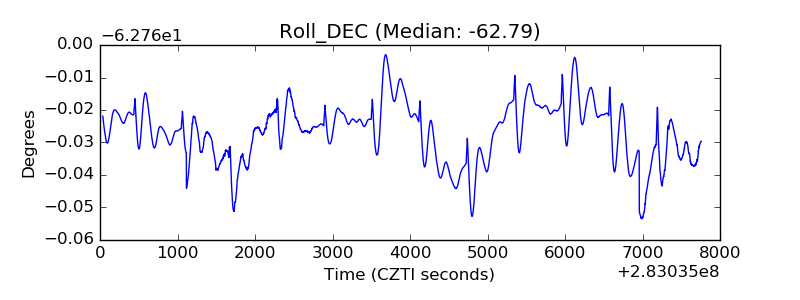 |
| _Roll_RA | 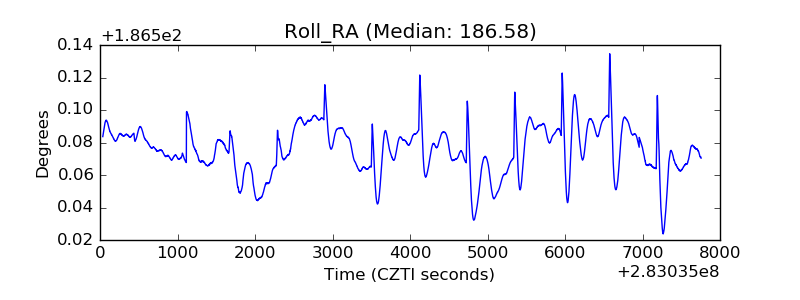 |
| Veto Counter | 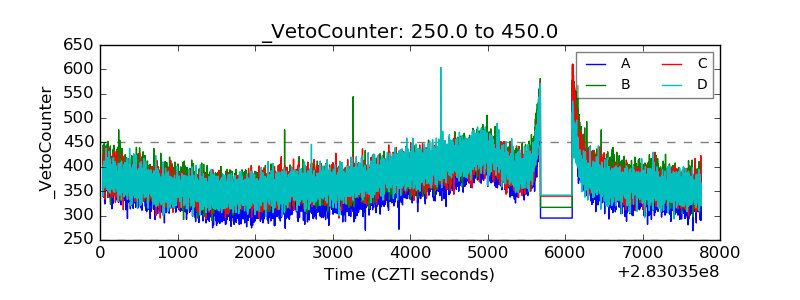 |