| Param | Original file | Final file |
|---|---|---|
| Filename | modeM0/AS1T03_067T01_9000002582_17466cztM0_level2.evt | modeM0/AS1T03_067T01_9000002582_17466cztM0_level2_quad_clean.evt |
| Size (bytes) | 1,443,024,000 | 278,475,840 |
| Size | 1.3 GB | 265.6 MB |
| Events in quadrant A | 9,116,170 | 1,797,710 |
| Events in quadrant B | 10,213,659 | 1,820,409 |
| Events in quadrant C | 9,200,133 | 1,755,248 |
| Events in quadrant D | 13,828,125 | 1,691,094 |
| Mode M0 | |||
|---|---|---|---|
| Quadrant | BADHDUFLAG | Total packets | Discarded packets |
| A | 0 | 40635 | 4 |
| B | 0 | 43670 | 4 |
| C | 0 | 40325 | 4 |
| D | 0 | 54886 | 4 |
| Mode SS | |||
|---|---|---|---|
| Quadrant | BADHDUFLAG | Total packets | Discarded packets |
| A | 0 | 402 | 0 |
| B | 0 | 402 | 0 |
| C | 0 | 402 | 0 |
| D | 0 | 402 | 0 |
| Mode M9 | |||
|---|---|---|---|
| Quadrant | BADHDUFLAG | Total packets | Discarded packets |
| A | 0 | 24 | 0 |
| B | 0 | 25 | 0 |
| C | 0 | 25 | 0 |
| D | 0 | 25 | 0 |
| Quadrant | Total seconds | Saturated seconds | Saturation percentage |
|---|---|---|---|
| A | 19901 | 64 | 0.321592% |
| B | 19901 | 210 | 1.055223% |
| C | 19901 | 123 | 0.618059% |
| D | 19901 | 920 | 4.622883% |
Noise dominated data is calculated using 1-second bins in cleaned event files. If a bin has >2000 counts, and if more than 50% of those come from <1% of pixels, then it is considered to be noise-dominated and hence unusable.
| Quadrant | # 1 sec bins | Bins with >0 counts | Bins with >2000 counts | High rate bins dominated by noise | Noise dominated (total time) | Noise dominated (detector-on time) | Marked lightcurve |
|---|---|---|---|---|---|---|---|
| A | 22171 | 19904 | 9 | 9 | 0.04% | 0.05% | 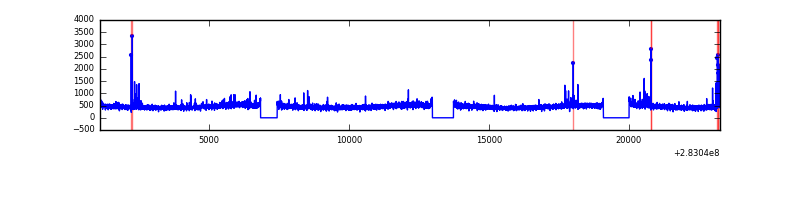 |
| B | 22171 | 19904 | 82 | 82 | 0.37% | 0.41% | 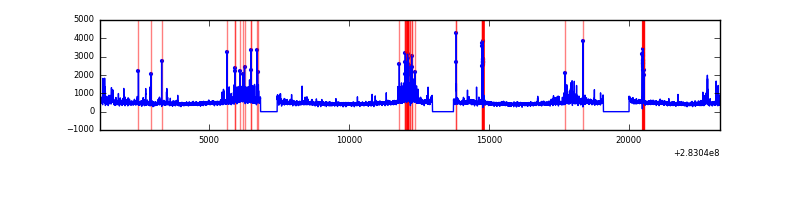 |
| C | 22171 | 19904 | 0 | 0 | 0.00% | 0.00% | 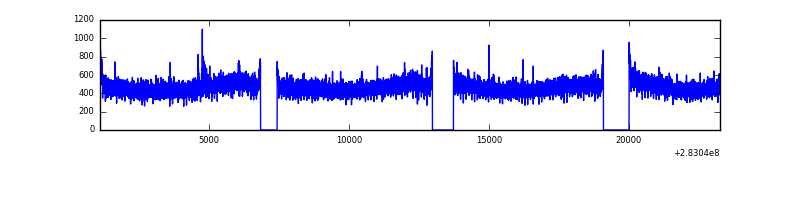 |
| D | 22171 | 19904 | 718 | 718 | 3.24% | 3.61% | 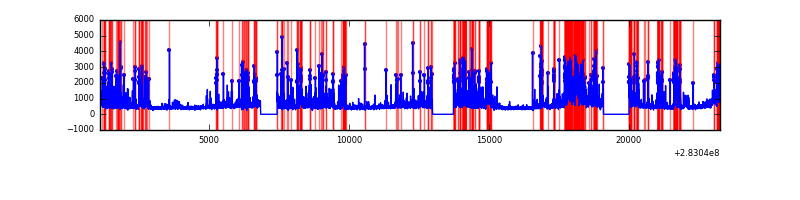 |
Top three noisy pixels from each quadrant. If the there are fewer than three noisy pixels in the level2.evt file, extra rows are filled as -1
| Pixel properties | Quadrant properties | ||||||
|---|---|---|---|---|---|---|---|
| Quadrant | DetID | PixID | Counts | Sigma | Mean | Median | Sigma |
| A | 15 | 174 | 88451 | 183.84 | 2322 | 2270 | 468.8 |
| A | 12 | 96 | 69802 | 144.06 | 2322 | 2270 | 468.8 |
| A | 0 | 226 | 20430 | 38.74 | 2322 | 2270 | 468.8 |
| B | 7 | 220 | 352177 | 804.6 | 2322 | 2263 | 434.9 |
| B | 0 | 230 | 202723 | 460.94 | 2322 | 2263 | 434.9 |
| B | 4 | 216 | 181315 | 411.72 | 2322 | 2263 | 434.9 |
| C | 14 | 238 | 344308 | 651.6 | 2244 | 2263 | 524.9 |
| C | 3 | 233 | 60400 | 110.75 | 2244 | 2263 | 524.9 |
| C | 5 | 218 | 30769 | 54.3 | 2244 | 2263 | 524.9 |
| D | 13 | 189 | 1732465 | 3202.39 | 2236 | 2172 | 540.3 |
| D | 12 | 233 | 1255244 | 2319.16 | 2236 | 2172 | 540.3 |
| D | 11 | 176 | 691231 | 1275.3 | 2236 | 2172 | 540.3 |
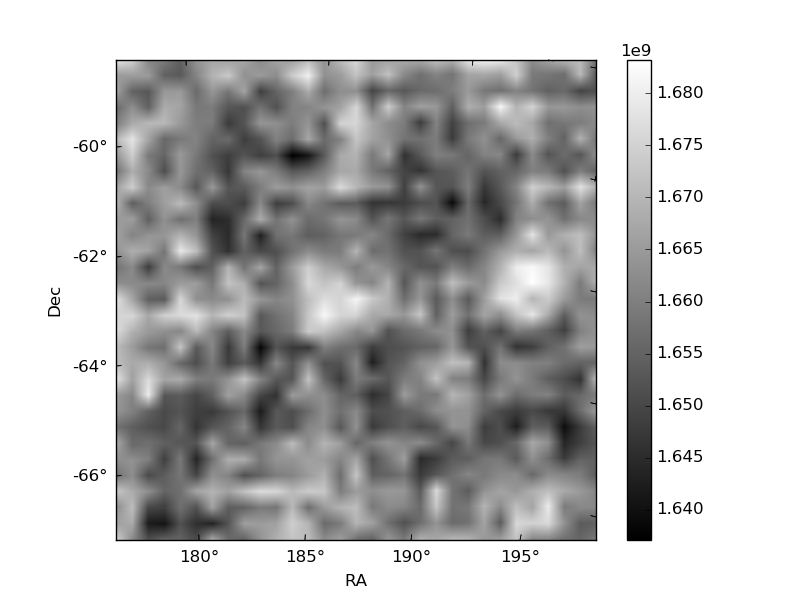
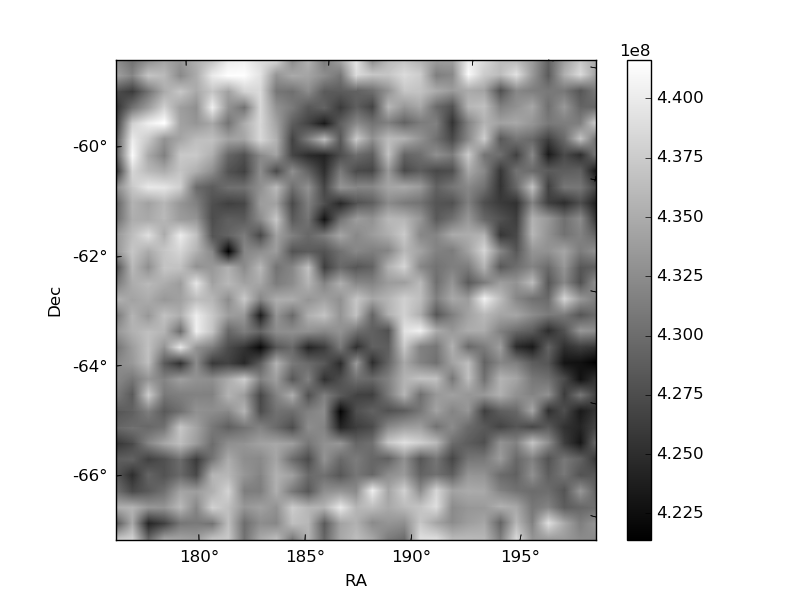
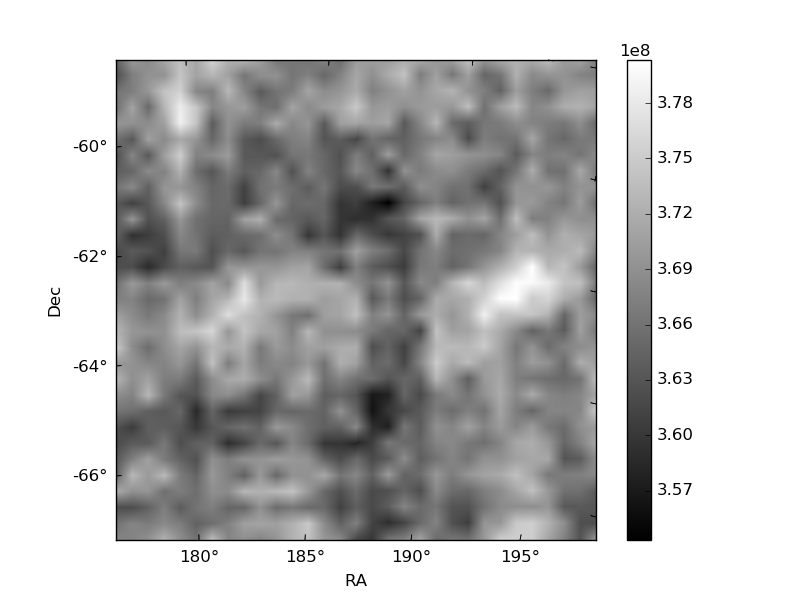
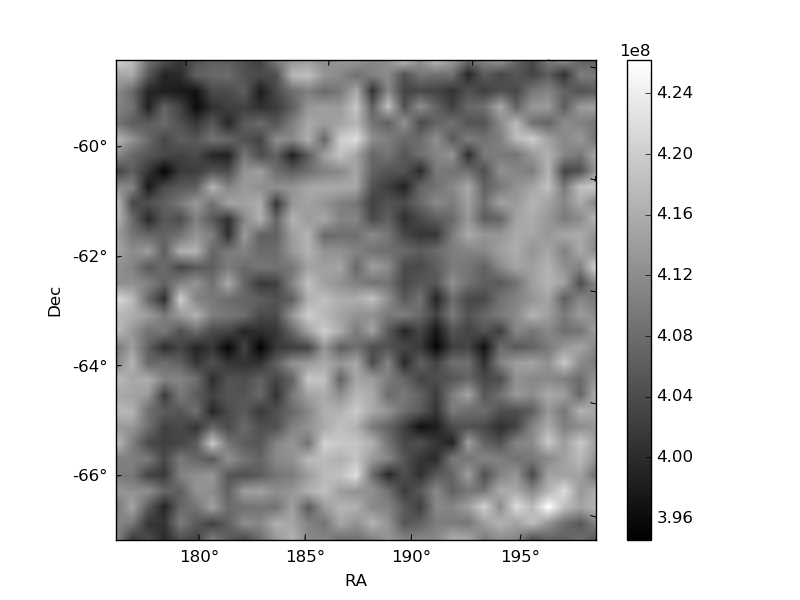
Histogram calculated using DETX and DETY for each event in the final _common_clean file
| Quadrant A | 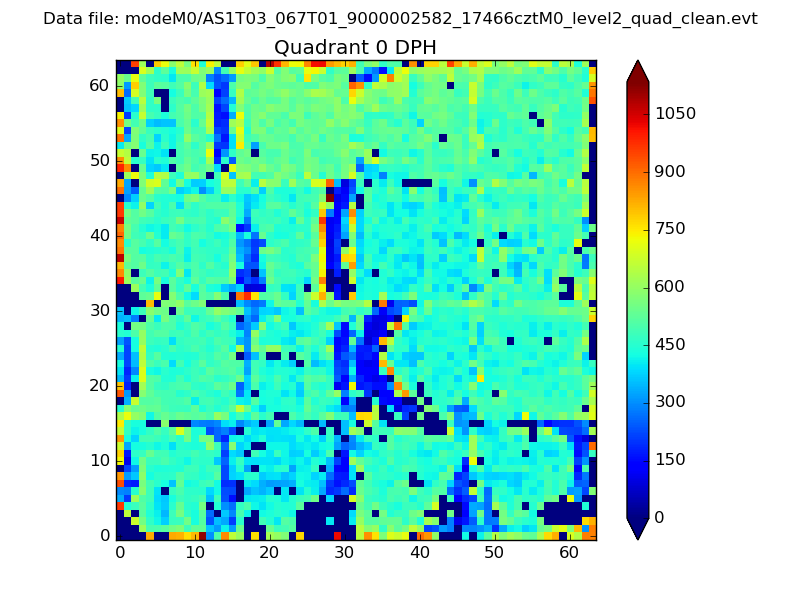 |
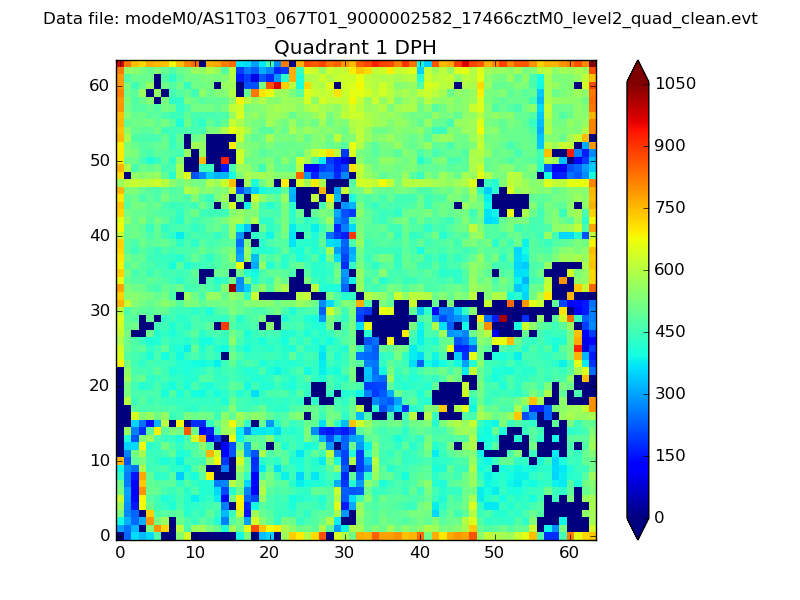 |
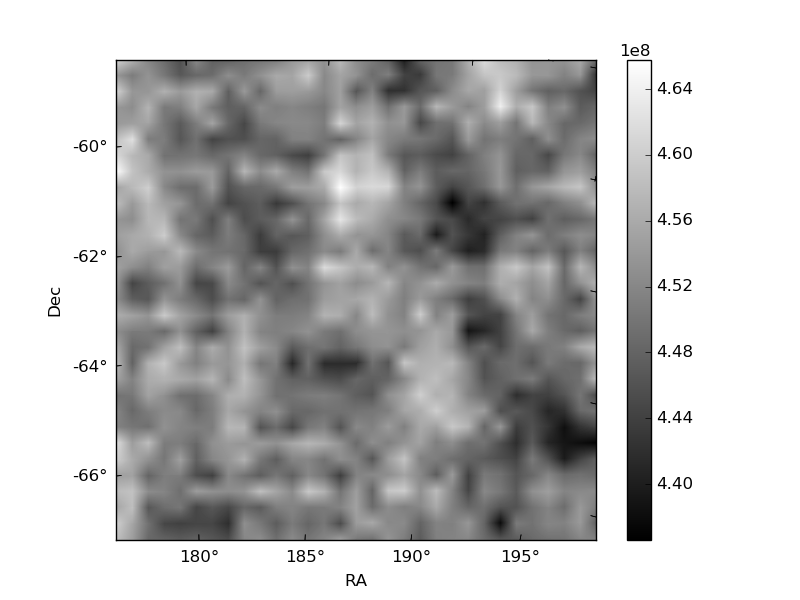
Quadrant B |
|---|---|---|---|
| Quadrant D | 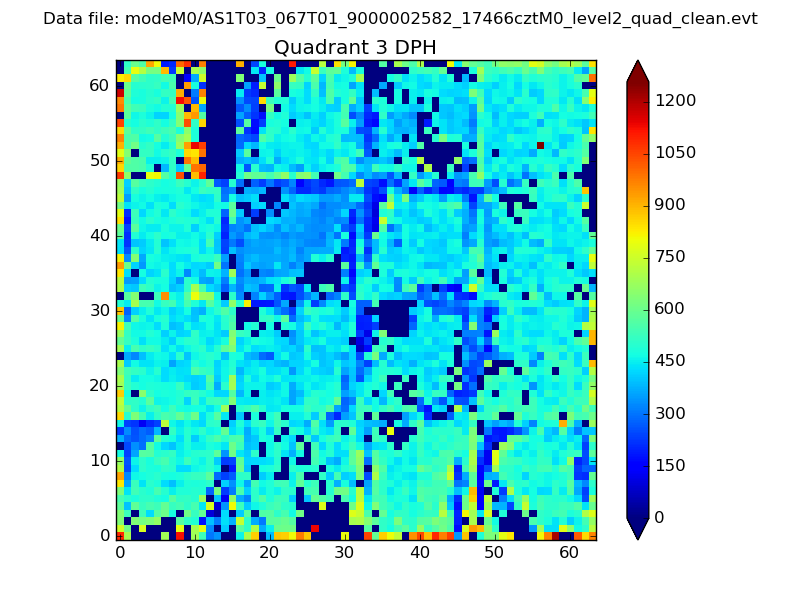 |
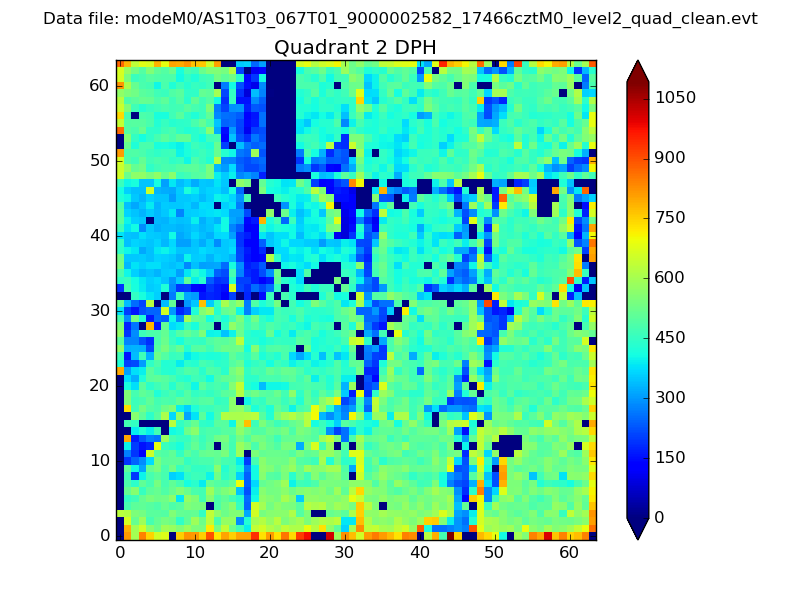 |
Quadrant C |
| Plot type | Count rate plots | Images |
|---|---|---|
| Comparison with Poisson distribution Blue bars denote a histogram of data divided into 1 sec bins. Red curve is a Poisson curve with rate = median count rate of data. |
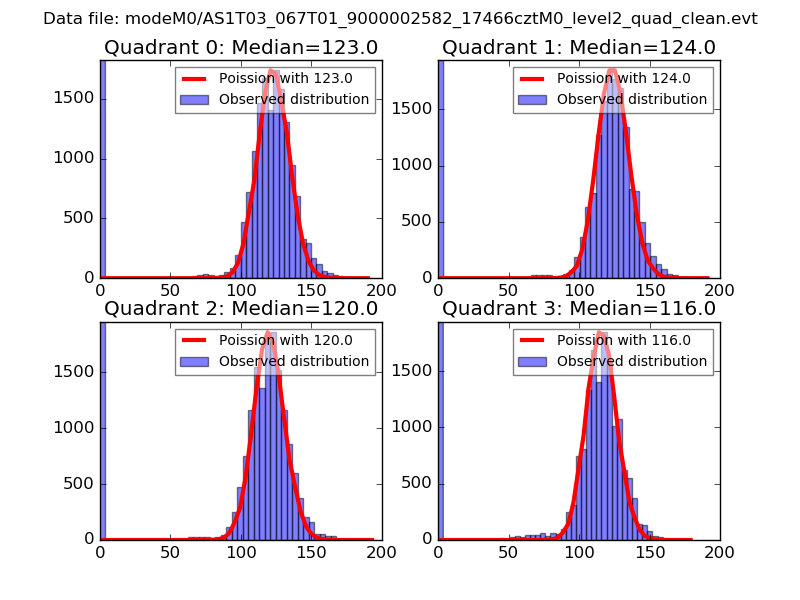 |
 |
| Quadrant-wise count rates Data is divided into 100 sec bins |
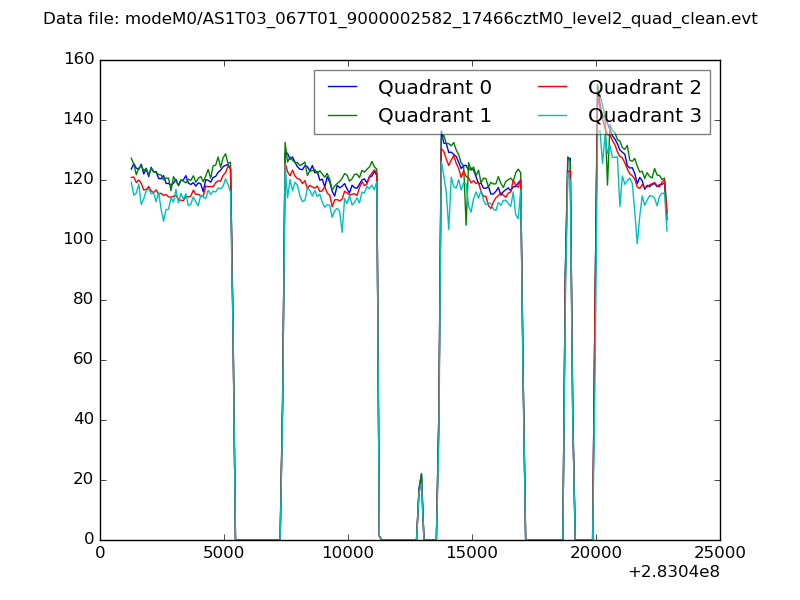 |
|
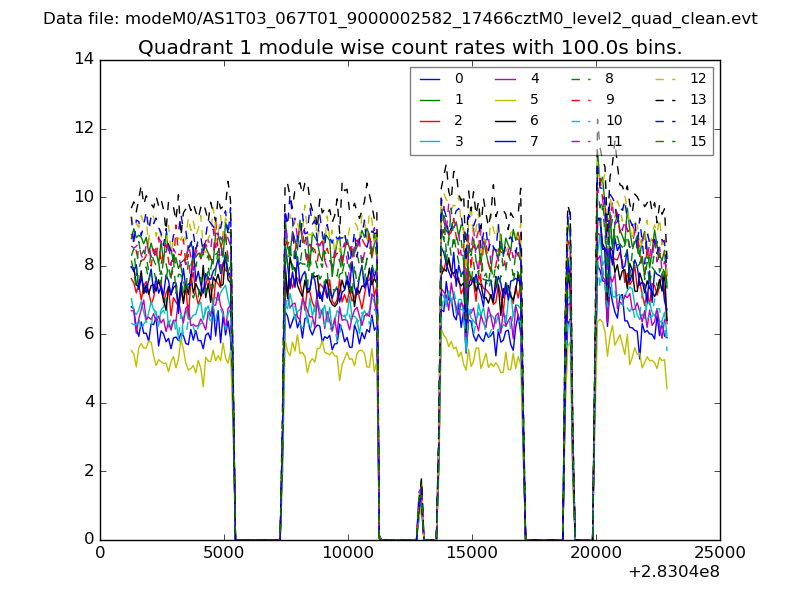
| Module-wise count rates for Quadrant A Data is divided into 100 sec bins |
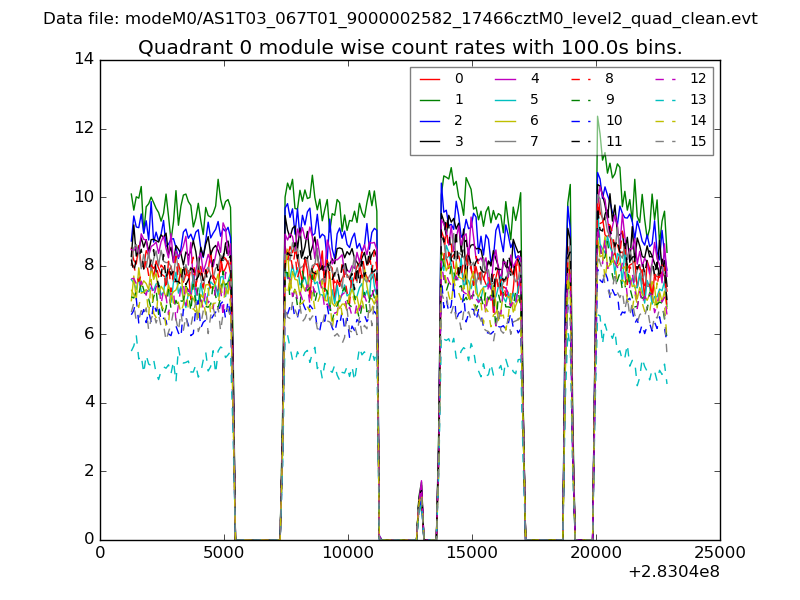 |
 |
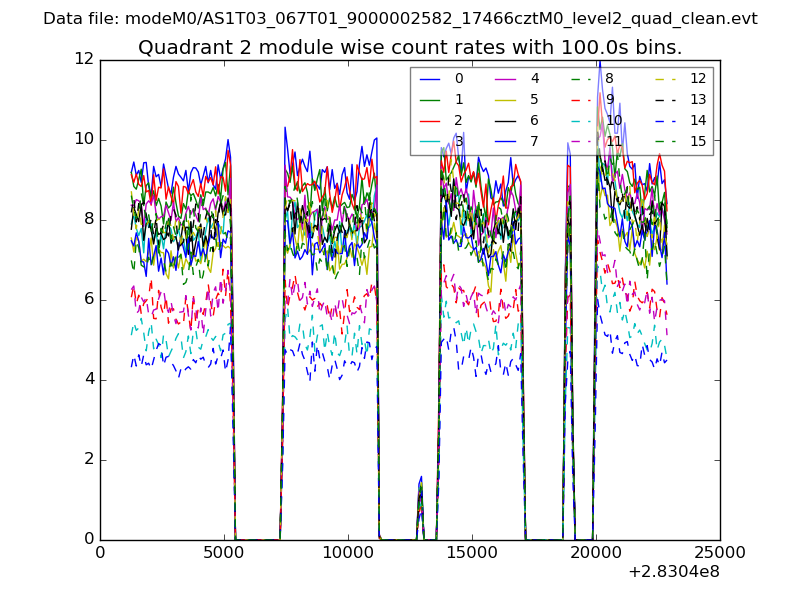
| Module-wise count rates for Quadrant B Data is divided into 100 sec bins |
 |
 |
| Module-wise count rates for Quadrant C Data is divided into 100 sec bins |
 |
 |
| Module-wise count rates for Quadrant D Data is divided into 100 sec bins |
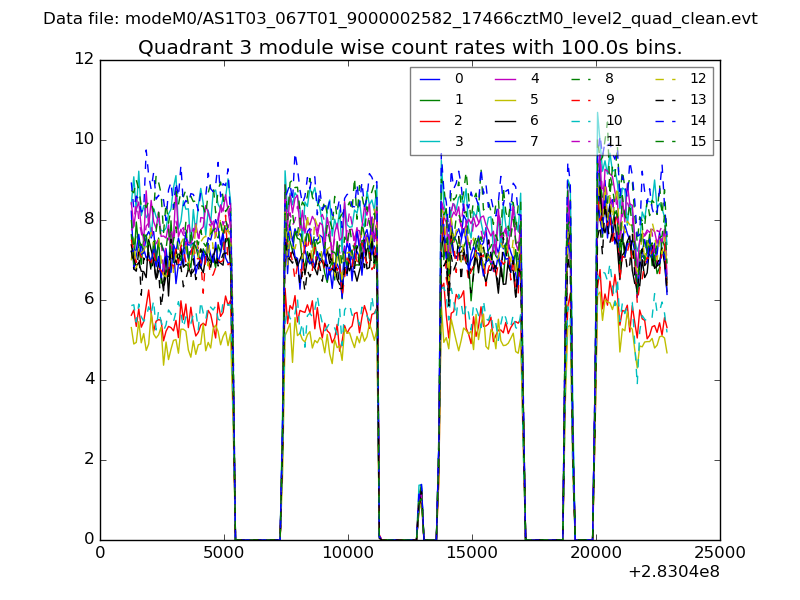 |
 |
| Parameter | Plot |
|---|---|
| CZT HV Monitor | 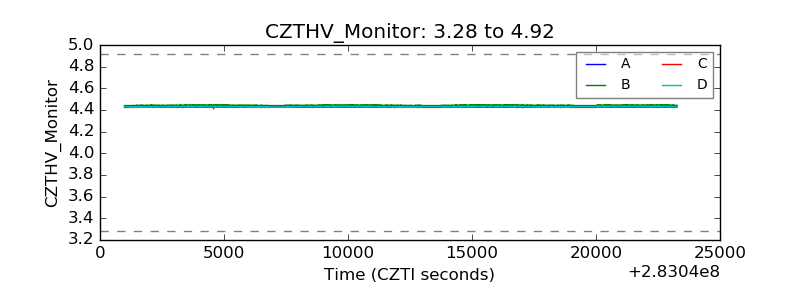 |
| D_VDD |  |
| Temperature 1 | 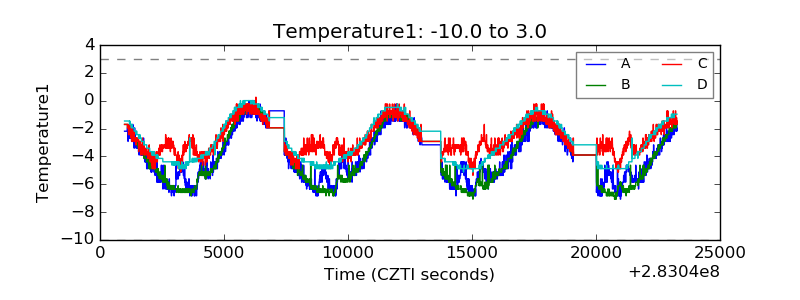 |
| Veto HV Monitor | 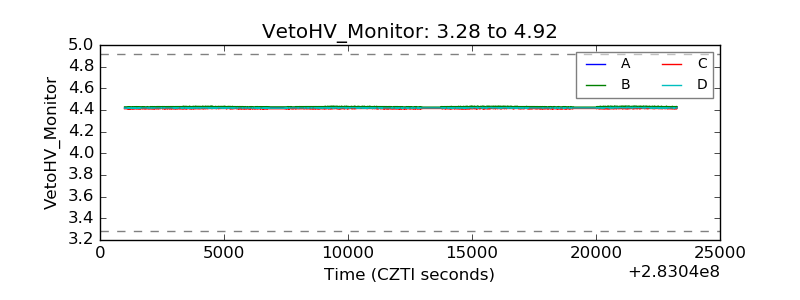 |
| Veto LLD | 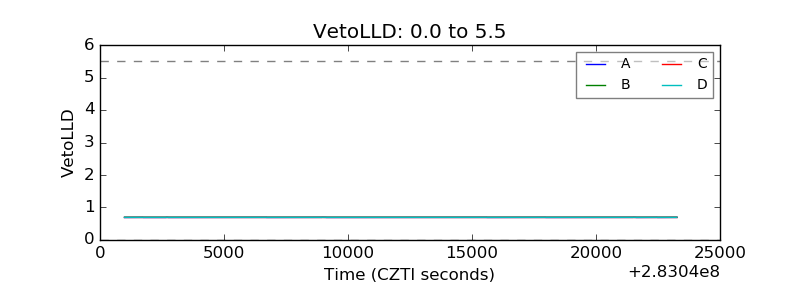 |
| Alpha Counter | 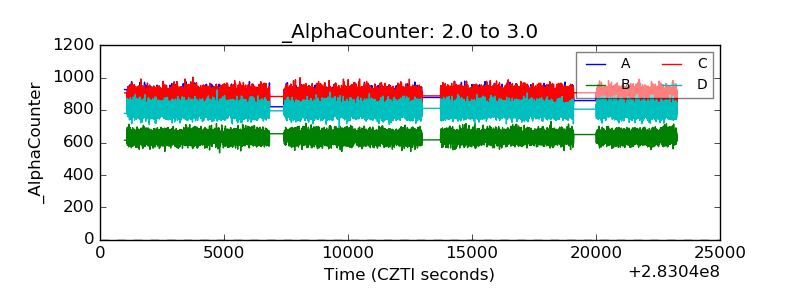 |
| _CPM_Rate | 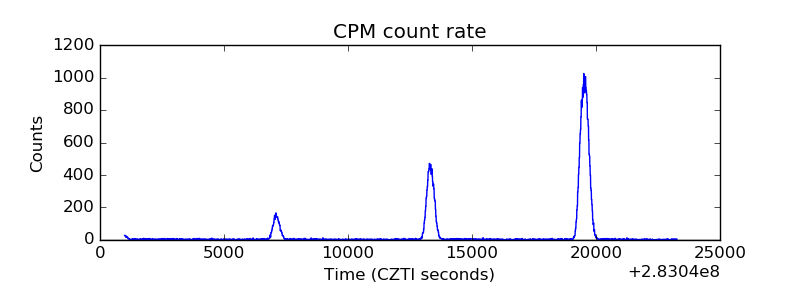 |
| CZT Counter | 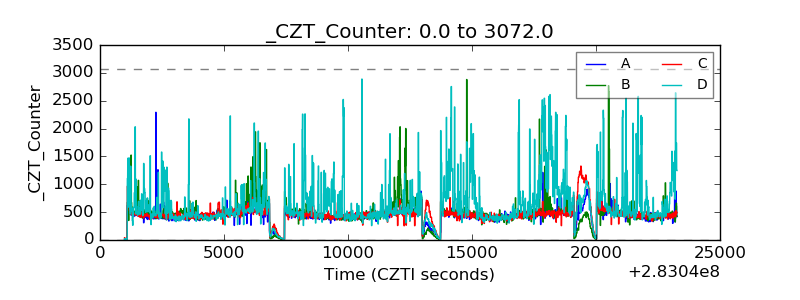 |
| +2.5 Volts monitor |  |
| +5 Volts monitor | 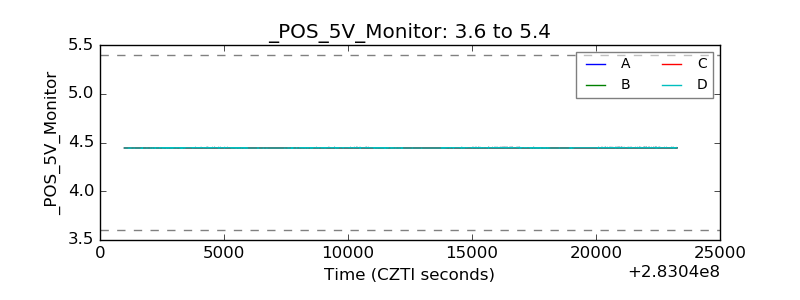 |
| _ROLL_ROT | 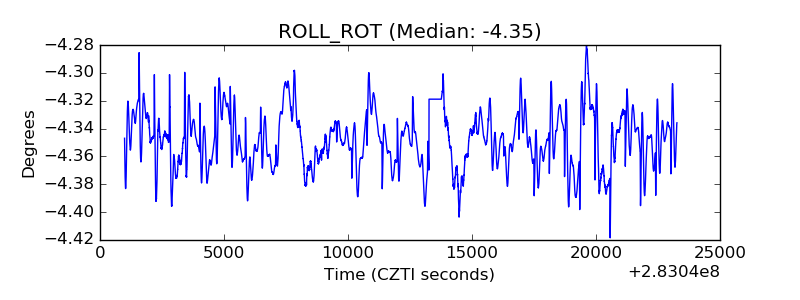 |
| _Roll_DEC | 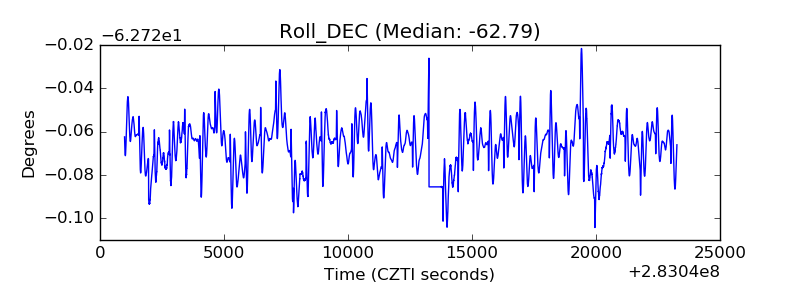 |
| _Roll_RA | 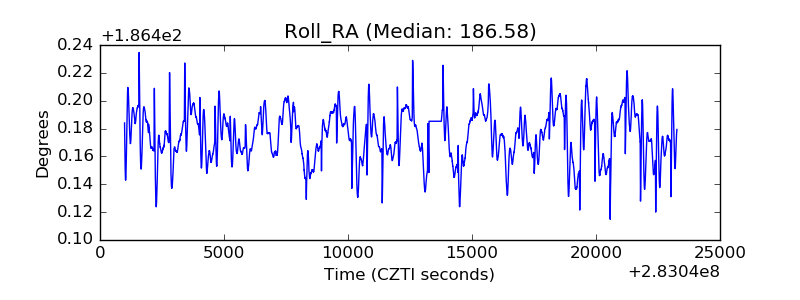 |
| Veto Counter | 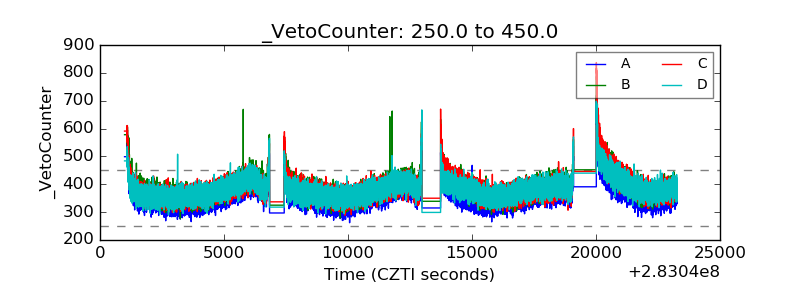 |