| Param | Original file | Final file |
|---|---|---|
| Filename | modeM0/AS1T03_067T01_9000002582_17468cztM0_level2.evt | modeM0/AS1T03_067T01_9000002582_17468cztM0_level2_quad_clean.evt |
| Size (bytes) | 793,811,520 | 126,328,320 |
| Size | 757.0 MB | 120.5 MB |
| Events in quadrant A | 5,987,251 | 806,663 |
| Events in quadrant B | 4,762,407 | 831,158 |
| Events in quadrant C | 4,546,602 | 801,292 |
| Events in quadrant D | 8,128,180 | 754,441 |
| Mode M0 | |||
|---|---|---|---|
| Quadrant | BADHDUFLAG | Total packets | Discarded packets |
| A | 0 | 23763 | 2 |
| B | 0 | 19861 | 2 |
| C | 0 | 19270 | 2 |
| D | 0 | 30263 | 2 |
| Mode SS | |||
|---|---|---|---|
| Quadrant | BADHDUFLAG | Total packets | Discarded packets |
| A | 0 | 184 | 0 |
| B | 0 | 184 | 0 |
| C | 0 | 184 | 0 |
| D | 0 | 184 | 0 |
| Mode M9 | |||
|---|---|---|---|
| Quadrant | BADHDUFLAG | Total packets | Discarded packets |
| A | 0 | 23 | 0 |
| B | 0 | 23 | 0 |
| C | 0 | 23 | 0 |
| D | 0 | 23 | 0 |
| Quadrant | Total seconds | Saturated seconds | Saturation percentage |
|---|---|---|---|
| A | 9118 | 471 | 5.165606% |
| B | 9119 | 103 | 1.129510% |
| C | 9119 | 116 | 1.272069% |
| D | 9119 | 1000 | 10.966115% |
Noise dominated data is calculated using 1-second bins in cleaned event files. If a bin has >2000 counts, and if more than 50% of those come from <1% of pixels, then it is considered to be noise-dominated and hence unusable.
| Quadrant | # 1 sec bins | Bins with >0 counts | Bins with >2000 counts | High rate bins dominated by noise | Noise dominated (total time) | Noise dominated (detector-on time) | Marked lightcurve |
|---|---|---|---|---|---|---|---|
| A | 11358 | 9119 | 239 | 239 | 2.10% | 2.62% | 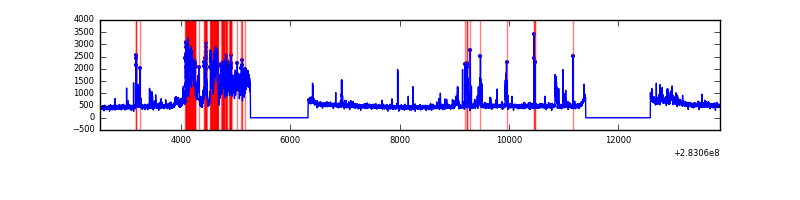 |
| B | 11359 | 9121 | 15 | 15 | 0.13% | 0.16% | 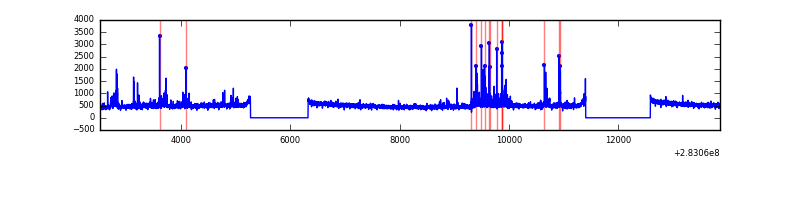 |
| C | 11359 | 9120 | 0 | 0 | 0.00% | 0.00% | 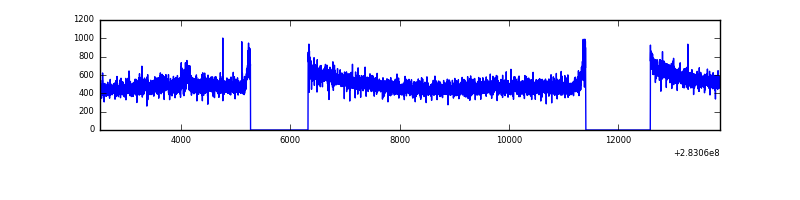 |
| D | 11359 | 9119 | 738 | 738 | 6.50% | 8.09% | 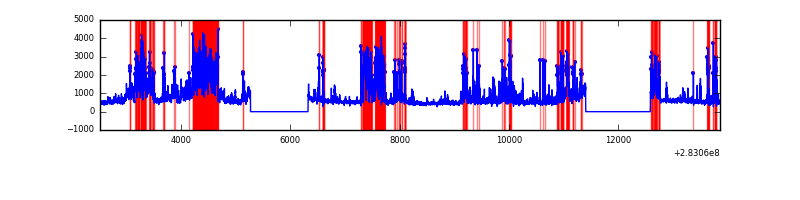 |
Top three noisy pixels from each quadrant. If the there are fewer than three noisy pixels in the level2.evt file, extra rows are filled as -1
| Pixel properties | Quadrant properties | ||||||
|---|---|---|---|---|---|---|---|
| Quadrant | DetID | PixID | Counts | Sigma | Mean | Median | Sigma |
| A | 14 | 237 | 1293730 | 5695.22 | 1128 | 1107 | 227.0 |
| A | 15 | 174 | 349250 | 1533.9 | 1128 | 1107 | 227.0 |
| A | 0 | 226 | 10070 | 39.49 | 1128 | 1107 | 227.0 |
| B | 7 | 220 | 161053 | 749.37 | 1136 | 1107 | 213.4 |
| B | 0 | 230 | 41043 | 187.11 | 1136 | 1107 | 213.4 |
| B | 0 | 189 | 29484 | 132.95 | 1136 | 1107 | 213.4 |
| C | 14 | 238 | 171303 | 665.82 | 1102 | 1110 | 255.6 |
| C | 3 | 233 | 46702 | 178.36 | 1102 | 1110 | 255.6 |
| C | 5 | 218 | 24201 | 90.34 | 1102 | 1110 | 255.6 |
| D | 11 | 176 | 1203875 | 4587.98 | 1086 | 1056 | 262.2 |
| D | 10 | 70 | 1091588 | 4159.68 | 1086 | 1056 | 262.2 |
| D | 13 | 189 | 892077 | 3398.67 | 1086 | 1056 | 262.2 |
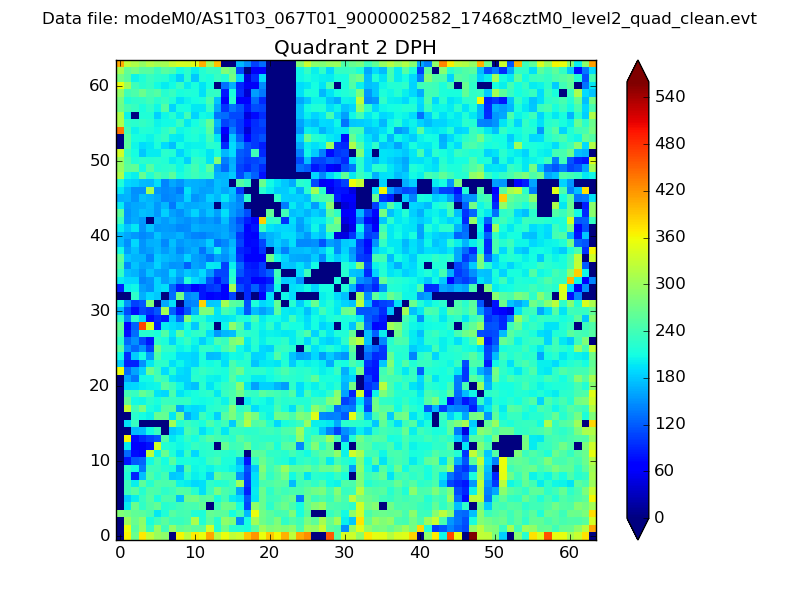
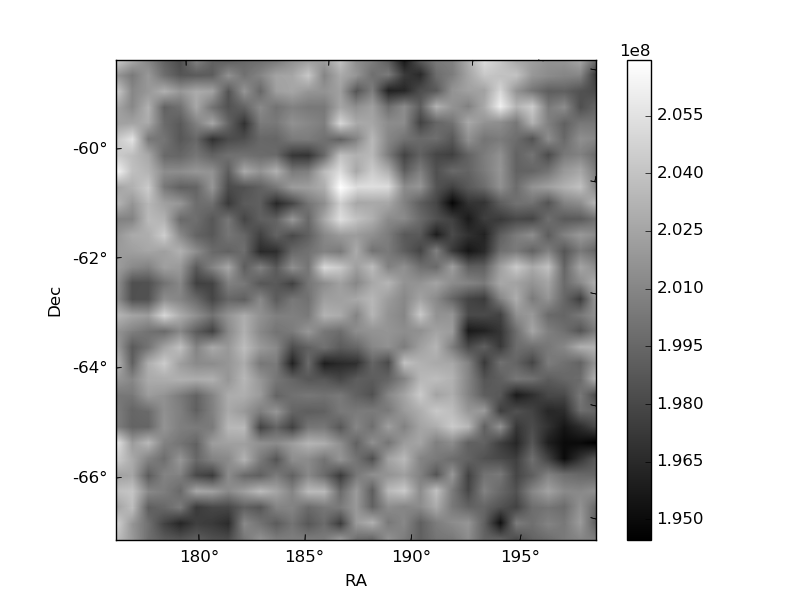
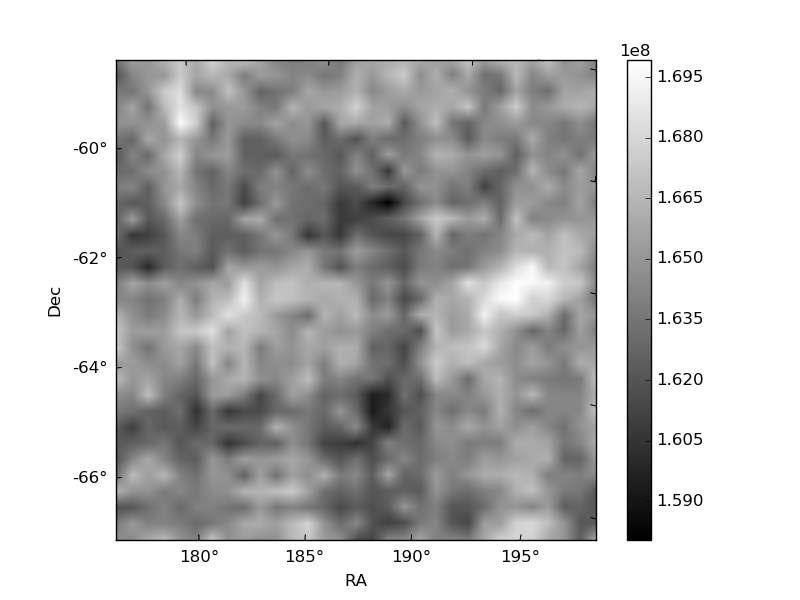
Histogram calculated using DETX and DETY for each event in the final _common_clean file
| Quadrant A | 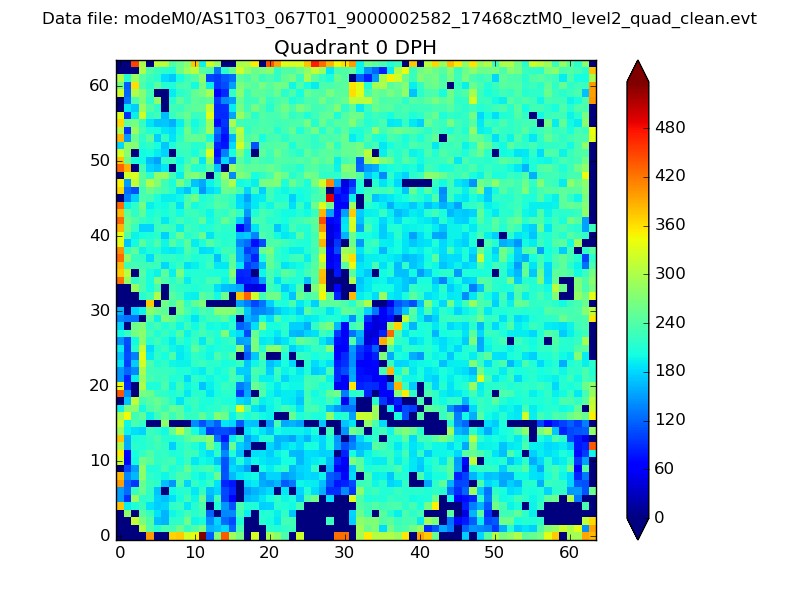 |
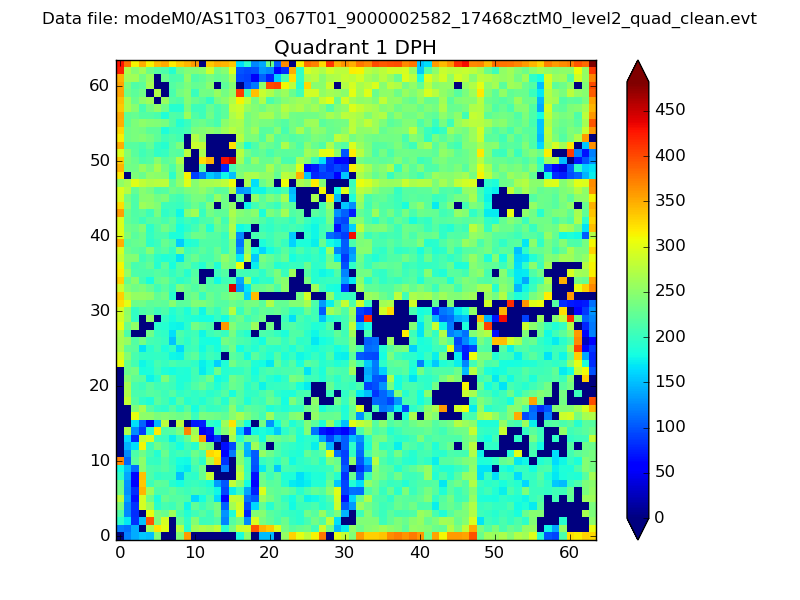 |
Quadrant B |
|---|---|---|---|
| Quadrant D | 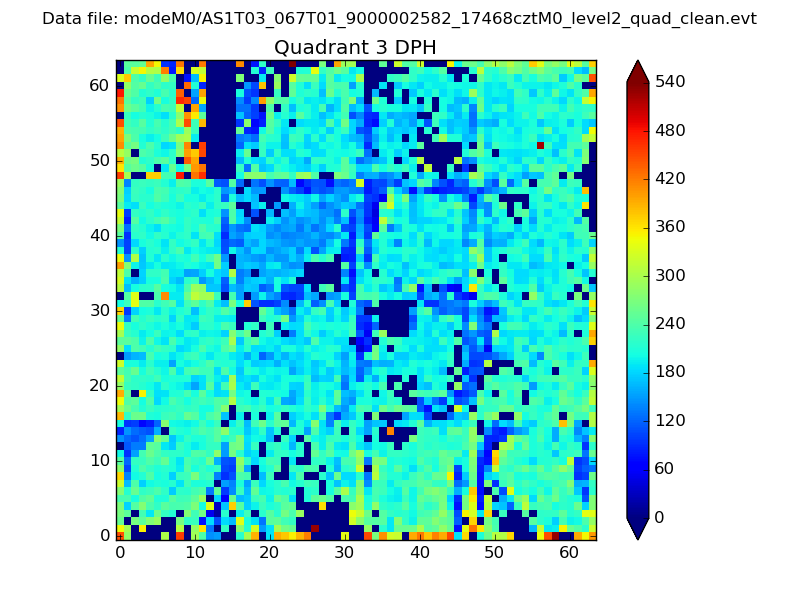 |
 |
Quadrant C |
| Plot type | Count rate plots | Images |
|---|---|---|
| Comparison with Poisson distribution Blue bars denote a histogram of data divided into 1 sec bins. Red curve is a Poisson curve with rate = median count rate of data. |
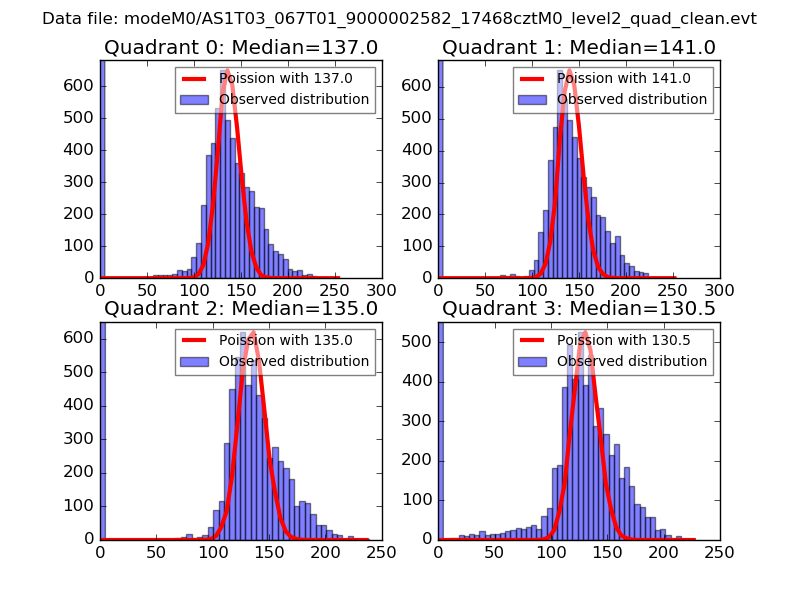 |
 |
| Quadrant-wise count rates Data is divided into 100 sec bins |
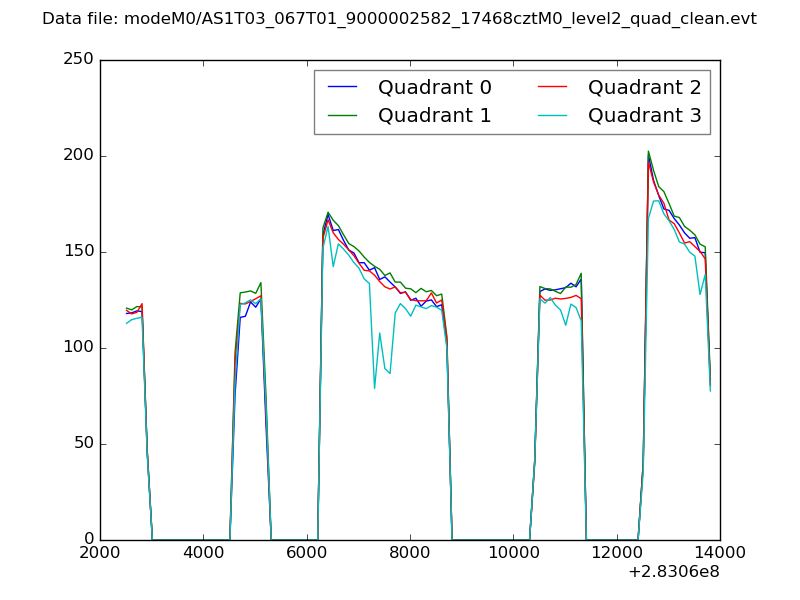 |
|
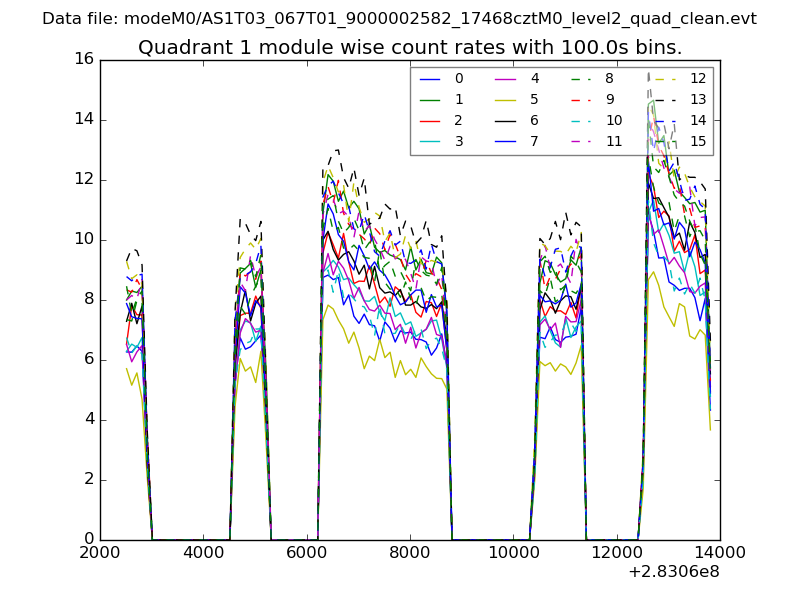
| Module-wise count rates for Quadrant A Data is divided into 100 sec bins |
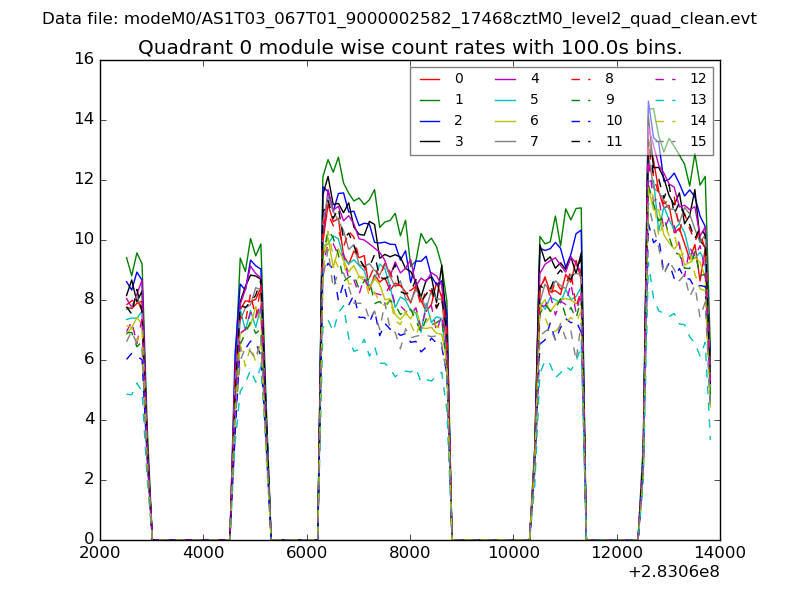 |
 |
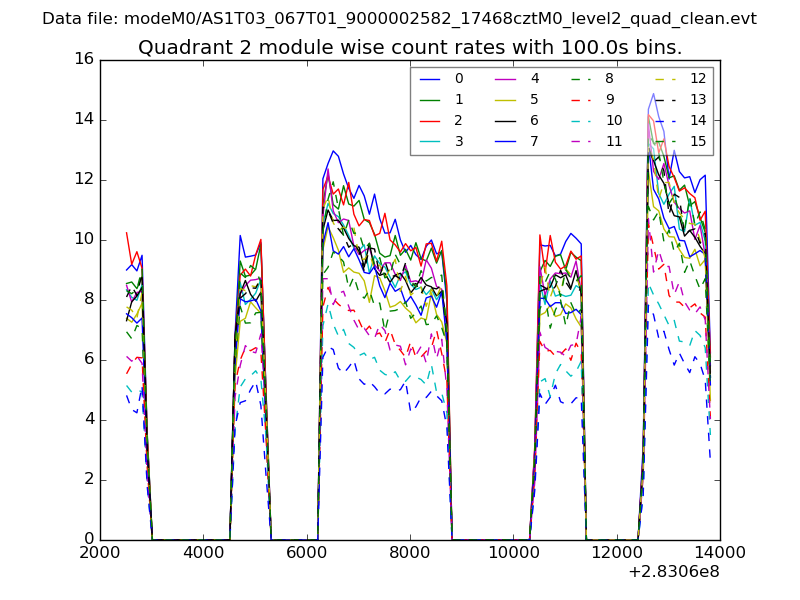
| Module-wise count rates for Quadrant B Data is divided into 100 sec bins |
 |
 |
| Module-wise count rates for Quadrant C Data is divided into 100 sec bins |
 |
 |
| Module-wise count rates for Quadrant D Data is divided into 100 sec bins |
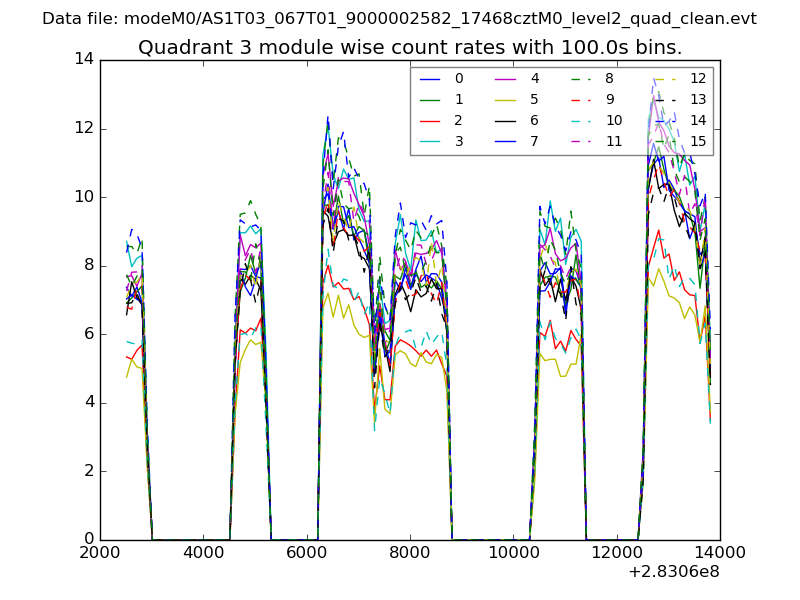 |
 |
| Parameter | Plot |
|---|---|
| CZT HV Monitor | 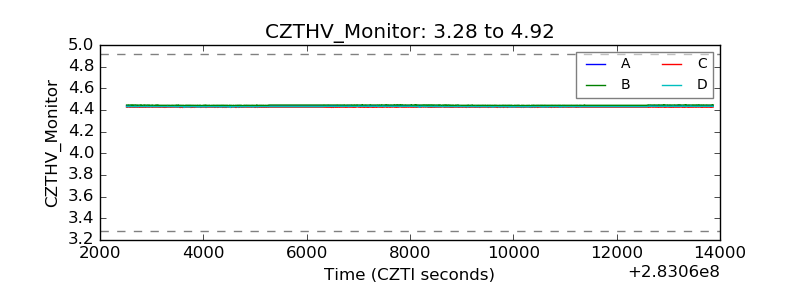 |
| D_VDD | 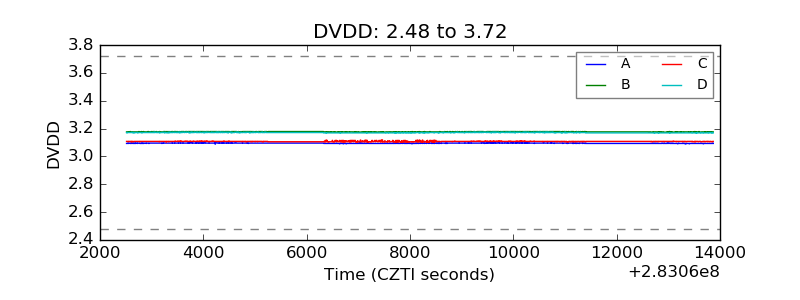 |
| Temperature 1 | 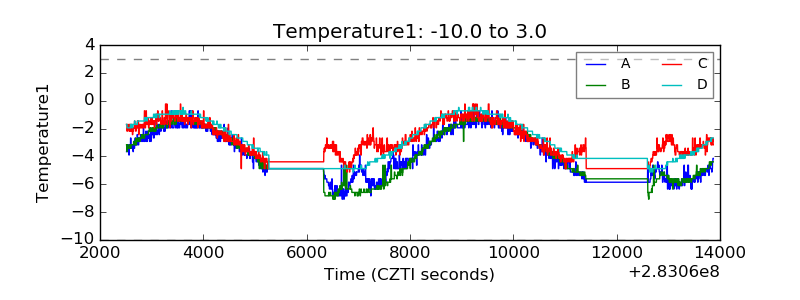 |
| Veto HV Monitor | 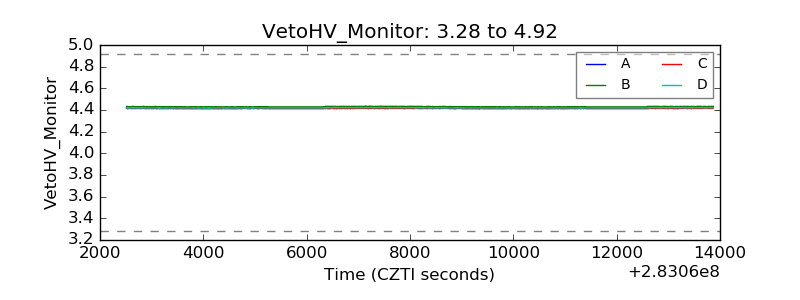 |
| Veto LLD | 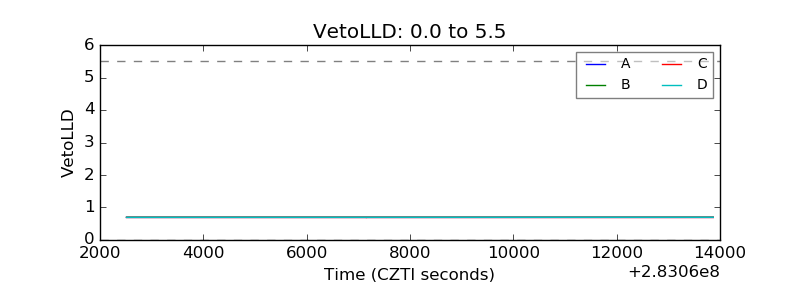 |
| Alpha Counter | 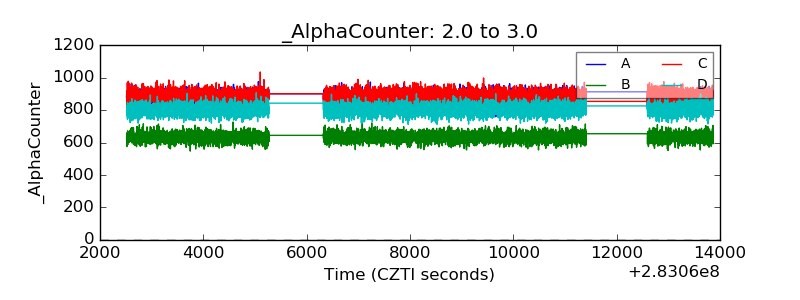 |
| _CPM_Rate | 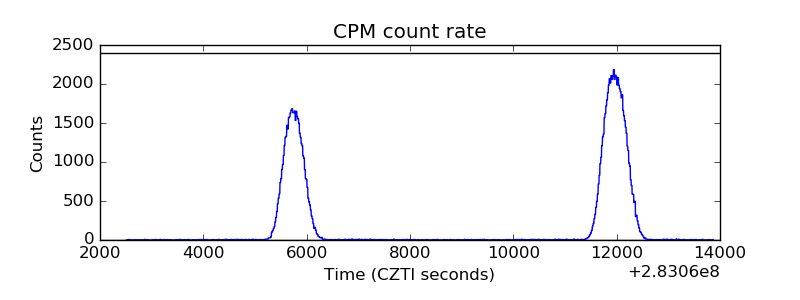 |
| CZT Counter |  |
| +2.5 Volts monitor |  |
| +5 Volts monitor |  |
| _ROLL_ROT | 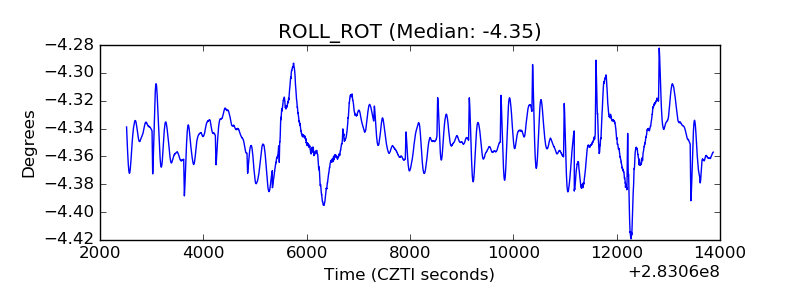 |
| _Roll_DEC | 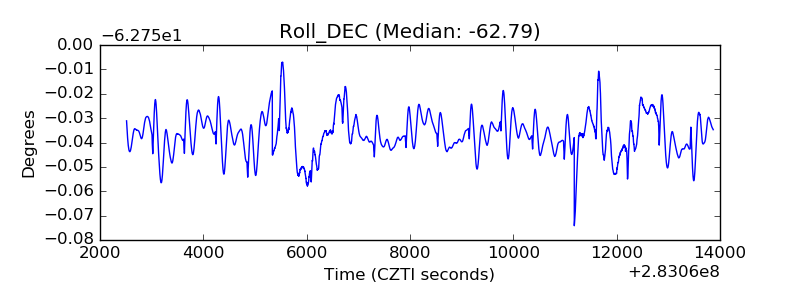 |
| _Roll_RA | 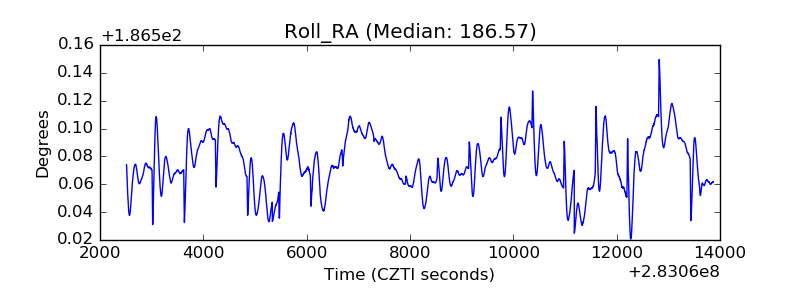 |
| Veto Counter | 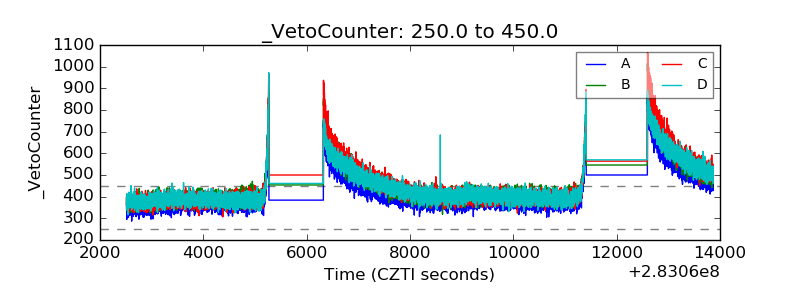 |