| Param | Original file | Final file |
|---|---|---|
| Filename | modeM0/AS1A05_196T01_9000002584cztM0_level2.fits | modeM0/AS1A05_196T01_9000002584cztM0_level2_quad_clean.evt |
| Size (bytes) | 220,962,240 | 174,525,120 |
| Size | 210.7 MB | 166.4 MB |
| Events in quadrant A | 1,424,116 | 1,026,220 |
| Events in quadrant B | 1,352,908 | 1,016,281 |
| Events in quadrant C | 1,377,080 | 960,832 |
| Events in quadrant D | 1,068,592 | 814,065 |
| Mode M0 | |||
|---|---|---|---|
| Quadrant | BADHDUFLAG | Total packets | Discarded packets |
| A | 0 | 47111 | 0 |
| B | 0 | 46980 | 0 |
| C | 0 | 45774 | 0 |
| D | 0 | 87005 | 0 |
| Mode M9 | |||
|---|---|---|---|
| Quadrant | BADHDUFLAG | Total packets | Discarded packets |
| A | 0 | 48 | 0 |
| B | 0 | 48 | 0 |
| C | 0 | 48 | 0 |
| D | 0 | 48 | 0 |
| Mode SS | |||
|---|---|---|---|
| Quadrant | BADHDUFLAG | Total packets | Discarded packets |
| A | 0 | 432 | 0 |
| B | 0 | 432 | 0 |
| C | 0 | 432 | 0 |
| D | 0 | 432 | 0 |
| Quadrant | Total seconds | Saturated seconds | Saturation percentage |
|---|---|---|---|
| A | 21316 | 643 | 3.016513% |
| B | 21316 | 501 | 2.350347% |
| C | 21316 | 513 | 2.406643% |
| D | 21316 | 4775 | 22.401013% |
Noise dominated data is calculated using 1-second bins in cleaned event files. If a bin has >2000 counts, and if more than 50% of those come from <1% of pixels, then it is considered to be noise-dominated and hence unusable.
| Quadrant | # 1 sec bins | Bins with >0 counts | Bins with >2000 counts | High rate bins dominated by noise | Noise dominated (total time) | Noise dominated (detector-on time) | Marked lightcurve |
|---|---|---|---|---|---|---|---|
| A | 26026 | 21312 | 0 | 0 | 0.00% | 0.00% |  |
| B | 26026 | 21313 | 0 | 0 | 0.00% | 0.00% |  |
| C | 26026 | 21314 | 0 | 0 | 0.00% | 0.00% |  |
| D | 26026 | 21301 | 0 | 0 | 0.00% | 0.00% |  |
Top three noisy pixels from each quadrant. If the there are fewer than three noisy pixels in the level2.evt file, extra rows are filled as -1
| Pixel properties | Quadrant properties | ||||||
|---|---|---|---|---|---|---|---|
| Quadrant | DetID | PixID | Counts | Sigma | Mean | Median | Sigma |
| A | 0 | 29 | 1347 | 10.81 | 371 | 350 | 92.2 |
| A | 7 | 110 | 1161 | 8.79 | 371 | 350 | 92.2 |
| A | 9 | 19 | 1066 | 7.76 | 371 | 350 | 92.2 |
| B | 2 | 9 | 1046 | 9.73 | 358 | 343 | 72.2 |
| B | 3 | 17 | 929 | 8.11 | 358 | 343 | 72.2 |
| B | 5 | 225 | 904 | 7.77 | 358 | 343 | 72.2 |
| C | 1 | 81 | 1013 | 7.17 | 363 | 341 | 93.7 |
| C | 1 | 80 | 1002 | 7.05 | 363 | 341 | 93.7 |
| C | 2 | 191 | 963 | 6.64 | 363 | 341 | 93.7 |
| D | 6 | 38 | 771 | 6.08 | 305 | 279 | 81.0 |
| D | 3 | 14 | 760 | 5.94 | 305 | 279 | 81.0 |
| D | 7 | 3 | 753 | 5.85 | 305 | 279 | 81.0 |
Histogram calculated using DETX and DETY for each event in the final _common_clean file
| Quadrant A | 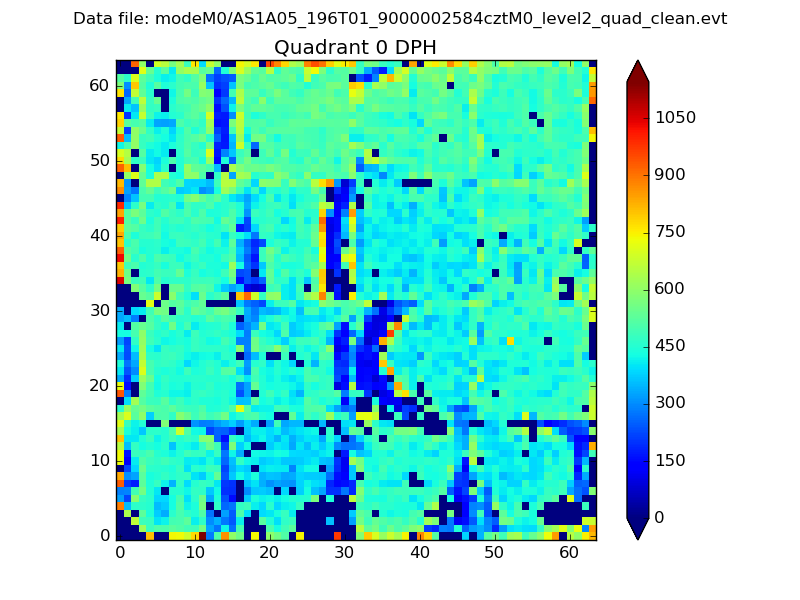 |
 |
Quadrant B |
|---|---|---|---|
| Quadrant D |  |
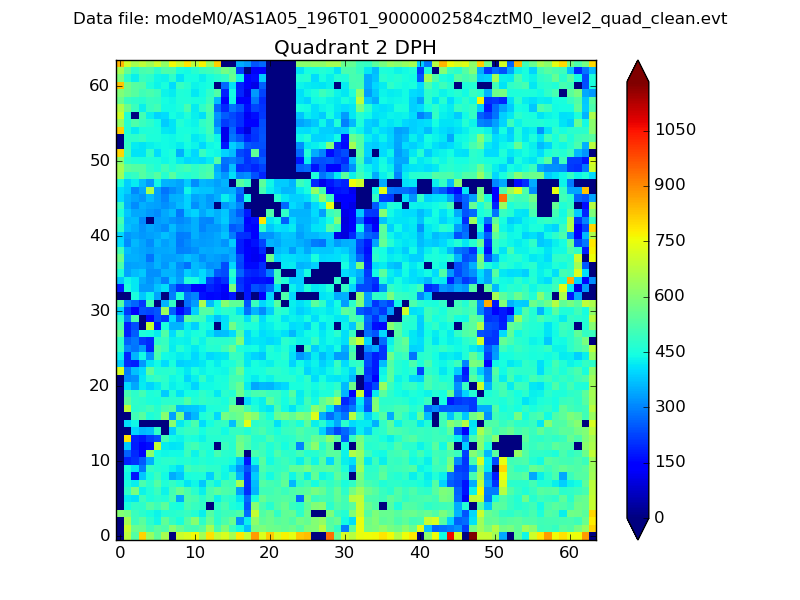 |
Quadrant C |
| Plot type | Count rate plots | Images |
|---|---|---|
| Comparison with Poisson distribution Blue bars denote a histogram of data divided into 1 sec bins. Red curve is a Poisson curve with rate = median count rate of data. |
 |
 |
| Quadrant-wise count rates Data is divided into 100 sec bins |
 |
|
| Module-wise count rates for Quadrant A Data is divided into 100 sec bins |
 |
 |
| Module-wise count rates for Quadrant B Data is divided into 100 sec bins |
 |
 |
| Module-wise count rates for Quadrant C Data is divided into 100 sec bins |
 |
 |
| Module-wise count rates for Quadrant D Data is divided into 100 sec bins |
 |
 |
| Parameter | Plot |
|---|---|
| CZT HV Monitor |  |
| D_VDD |  |
| Temperature 1 |  |
| Veto HV Monitor |  |
| Veto LLD |  |
| Alpha Counter |  |
| _CPM_Rate |  |
| CZT Counter |  |
| +2.5 Volts monitor |  |
| +5 Volts monitor |  |
| _ROLL_ROT |  |
| _Roll_DEC |  |
| _Roll_RA |  |
| Veto Counter |  |