| Param | Original file | Final file |
|---|---|---|
| Filename | modeM0/AS1A05_196T01_9000002584_17470cztM0_level2.evt | modeM0/AS1A05_196T01_9000002584_17470cztM0_level2_quad_clean.evt |
| Size (bytes) | 531,861,120 | 54,573,120 |
| Size | 507.2 MB | 52.0 MB |
| Events in quadrant A | 2,749,494 | 352,859 |
| Events in quadrant B | 2,760,115 | 355,820 |
| Events in quadrant C | 2,650,882 | 338,881 |
| Events in quadrant D | 7,611,975 | 257,343 |
| Mode M0 | |||
|---|---|---|---|
| Quadrant | BADHDUFLAG | Total packets | Discarded packets |
| A | 0 | 11171 | 1 |
| B | 0 | 11216 | 1 |
| C | 0 | 10856 | 1 |
| D | 0 | 25988 | 1 |
| Mode M9 | |||
|---|---|---|---|
| Quadrant | BADHDUFLAG | Total packets | Discarded packets |
| A | 0 | 14 | 0 |
| B | 0 | 14 | 0 |
| C | 0 | 14 | 0 |
| D | 0 | 14 | 0 |
| Mode SS | |||
|---|---|---|---|
| Quadrant | BADHDUFLAG | Total packets | Discarded packets |
| A | 0 | 98 | 0 |
| B | 0 | 98 | 0 |
| C | 0 | 98 | 0 |
| D | 0 | 98 | 0 |
| Quadrant | Total seconds | Saturated seconds | Saturation percentage |
|---|---|---|---|
| A | 4951 | 121 | 2.443951% |
| B | 4951 | 109 | 2.201575% |
| C | 4951 | 130 | 2.625732% |
| D | 4951 | 1871 | 37.790345% |
Noise dominated data is calculated using 1-second bins in cleaned event files. If a bin has >2000 counts, and if more than 50% of those come from <1% of pixels, then it is considered to be noise-dominated and hence unusable.
| Quadrant | # 1 sec bins | Bins with >0 counts | Bins with >2000 counts | High rate bins dominated by noise | Noise dominated (total time) | Noise dominated (detector-on time) | Marked lightcurve |
|---|---|---|---|---|---|---|---|
| A | 6261 | 4951 | 12 | 12 | 0.19% | 0.24% | 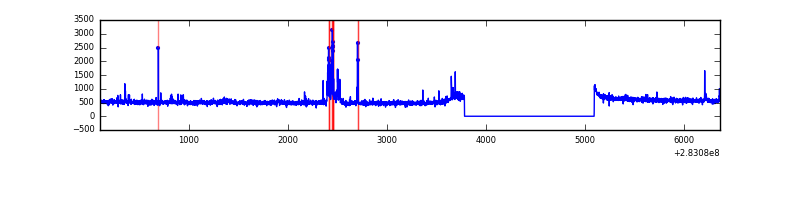 |
| B | 6261 | 4951 | 4 | 4 | 0.06% | 0.08% | 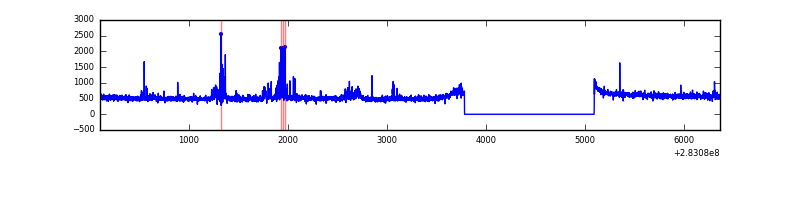 |
| C | 6261 | 4951 | 0 | 0 | 0.00% | 0.00% | 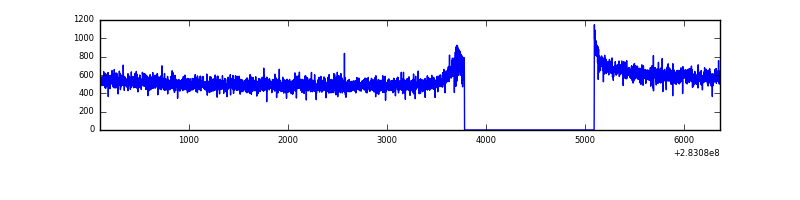 |
| D | 6261 | 4951 | 1640 | 1640 | 26.19% | 33.12% | 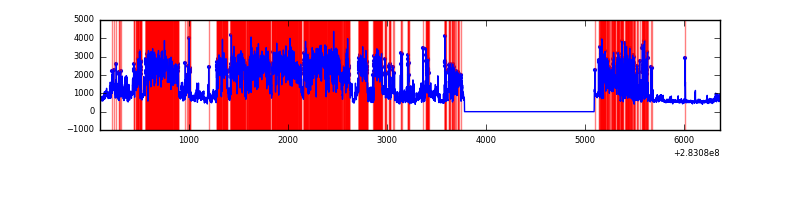 |
Top three noisy pixels from each quadrant. If the there are fewer than three noisy pixels in the level2.evt file, extra rows are filled as -1
| Pixel properties | Quadrant properties | ||||||
|---|---|---|---|---|---|---|---|
| Quadrant | DetID | PixID | Counts | Sigma | Mean | Median | Sigma |
| A | 15 | 174 | 130467 | 951.14 | 675 | 663 | 136.5 |
| A | 12 | 96 | 12526 | 86.93 | 675 | 663 | 136.5 |
| A | 4 | 2 | 8234 | 55.48 | 675 | 663 | 136.5 |
| B | 0 | 197 | 54308 | 428.24 | 668 | 651 | 125.3 |
| B | 0 | 189 | 45404 | 357.18 | 668 | 651 | 125.3 |
| B | 5 | 172 | 17446 | 134.04 | 668 | 651 | 125.3 |
| C | 14 | 238 | 100984 | 675.14 | 643 | 649 | 148.6 |
| C | 5 | 218 | 21143 | 137.9 | 643 | 649 | 148.6 |
| C | 3 | 233 | 16355 | 105.68 | 643 | 649 | 148.6 |
| D | 11 | 176 | 4332897 | 31465.68 | 566 | 548 | 137.7 |
| D | 10 | 70 | 807003 | 5857.25 | 566 | 548 | 137.7 |
| D | 13 | 189 | 205740 | 1490.3 | 566 | 548 | 137.7 |
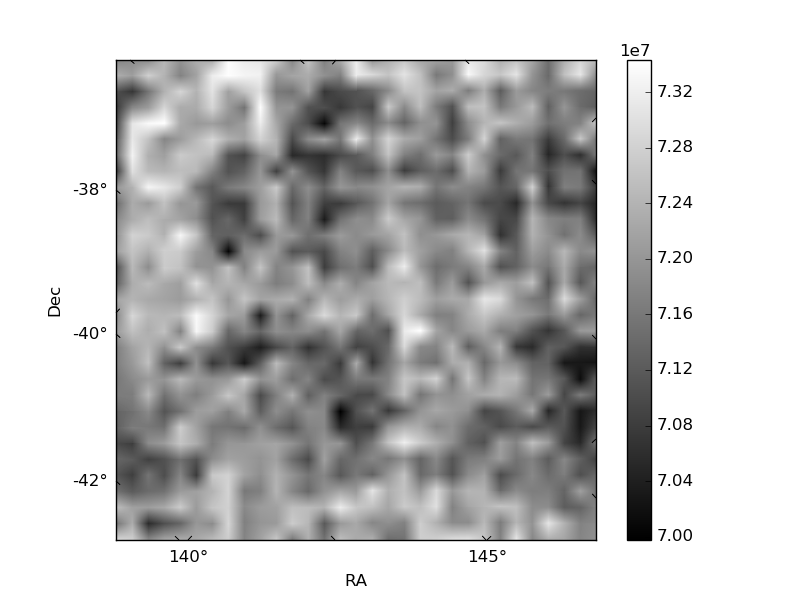
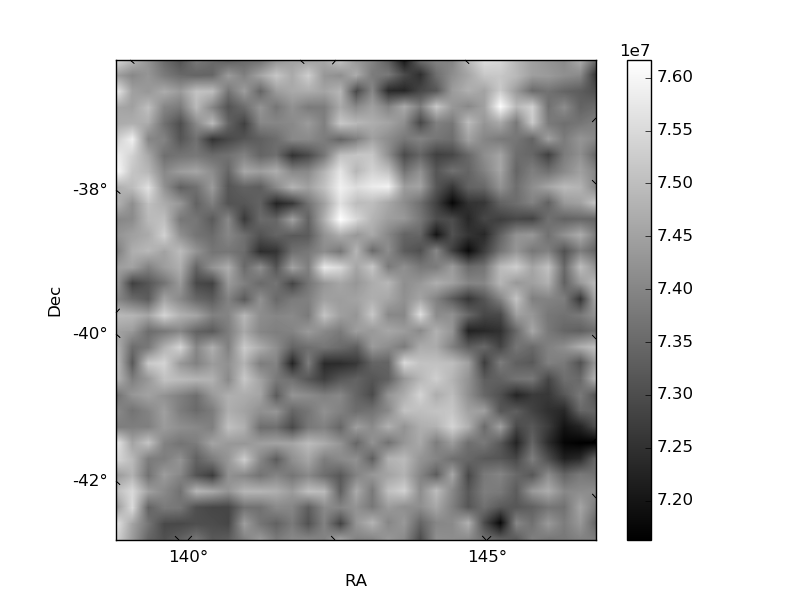
Histogram calculated using DETX and DETY for each event in the final _common_clean file
| Quadrant A | 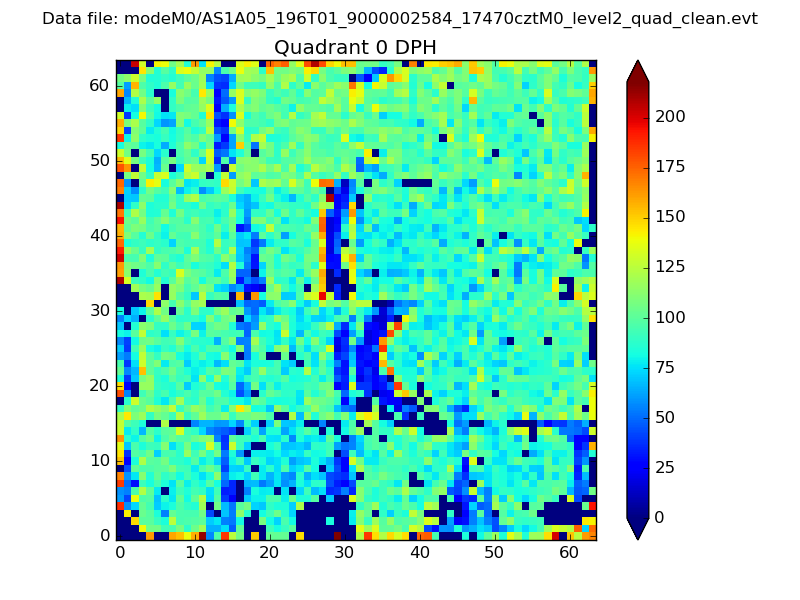 |
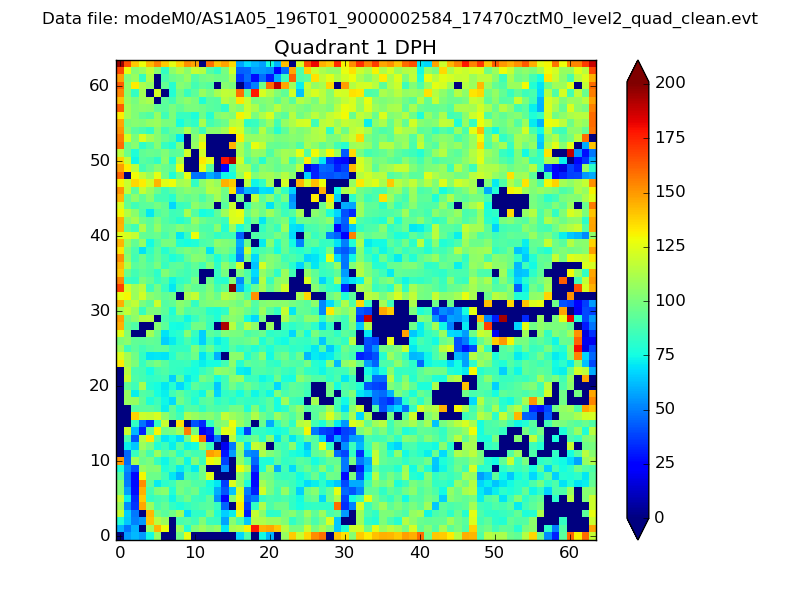 |
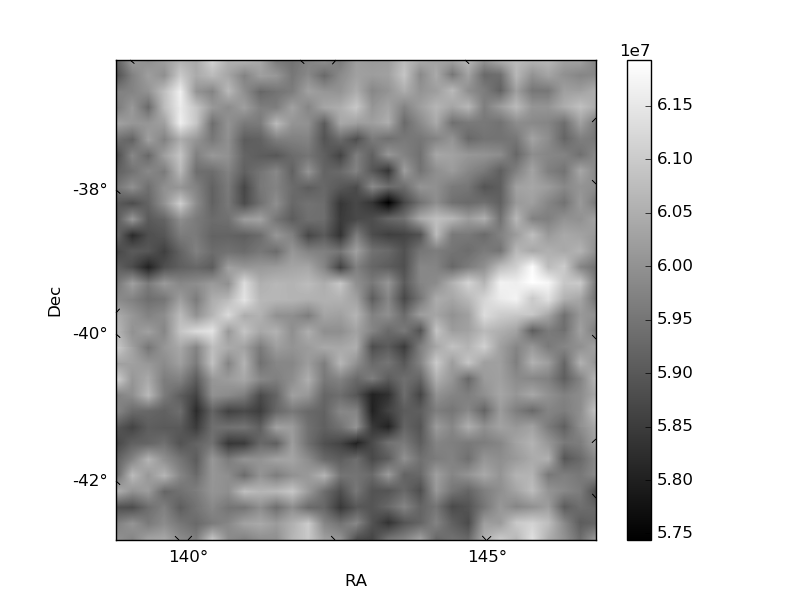
Quadrant B |
|---|---|---|---|
| Quadrant D | 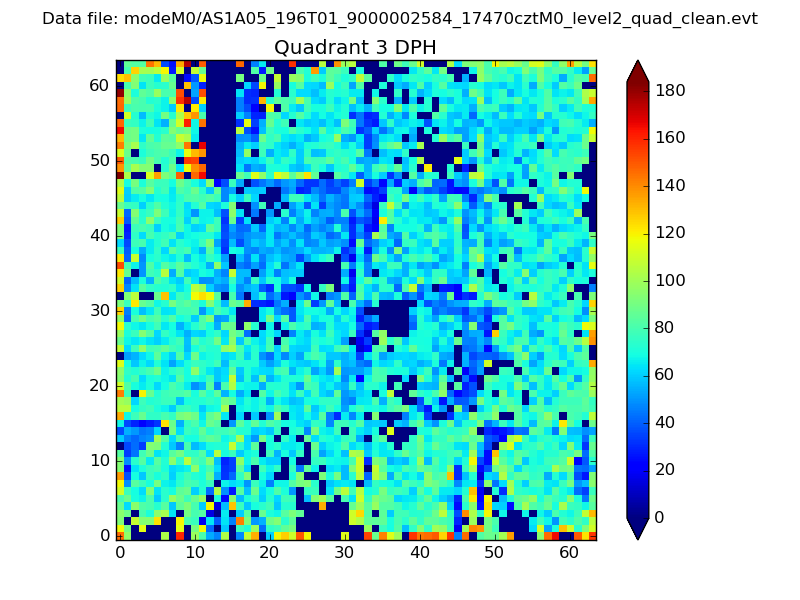 |
 |
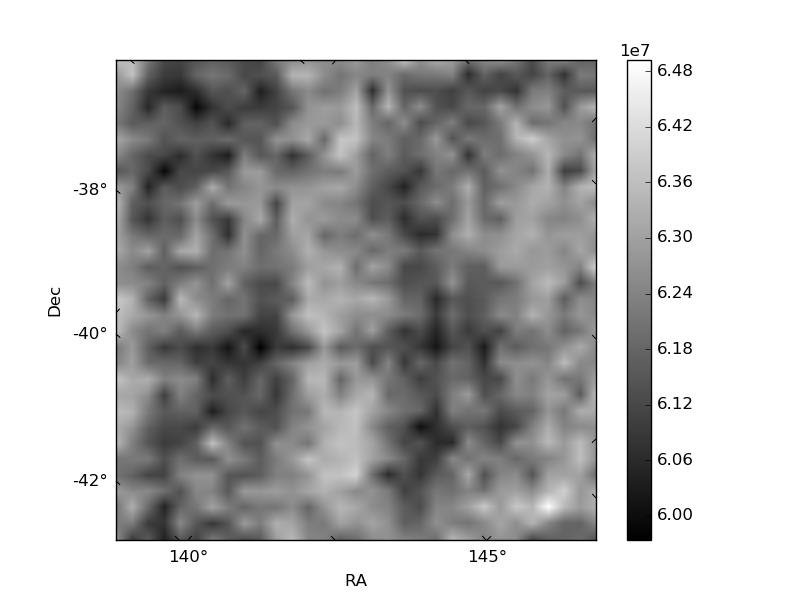
Quadrant C |
| Plot type | Count rate plots | Images |
|---|---|---|
| Comparison with Poisson distribution Blue bars denote a histogram of data divided into 1 sec bins. Red curve is a Poisson curve with rate = median count rate of data. |
 |
 |
| Quadrant-wise count rates Data is divided into 100 sec bins |
 |
|
| Module-wise count rates for Quadrant A Data is divided into 100 sec bins |
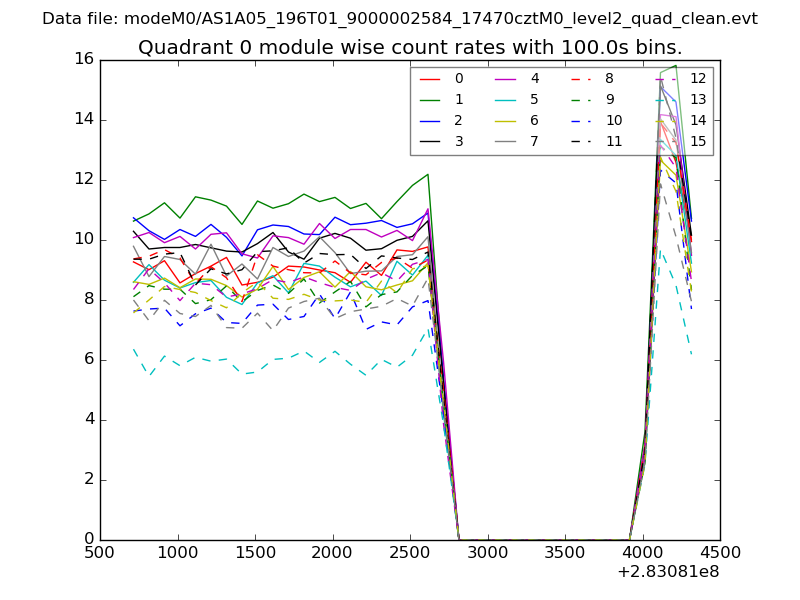 |
 |
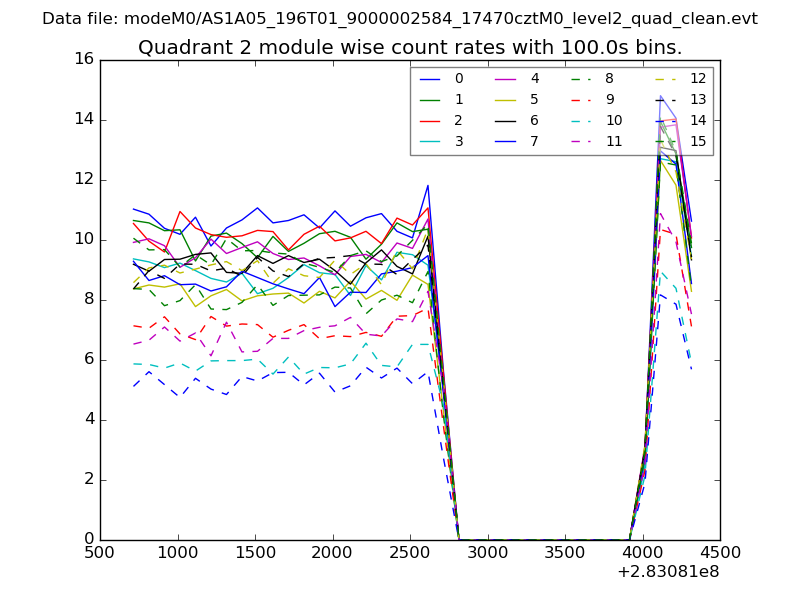
| Module-wise count rates for Quadrant B Data is divided into 100 sec bins |
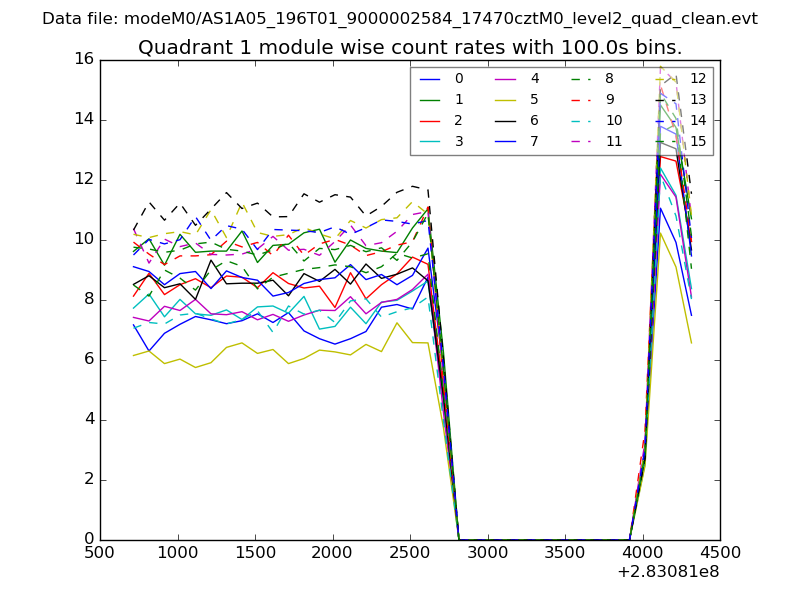 |
 |
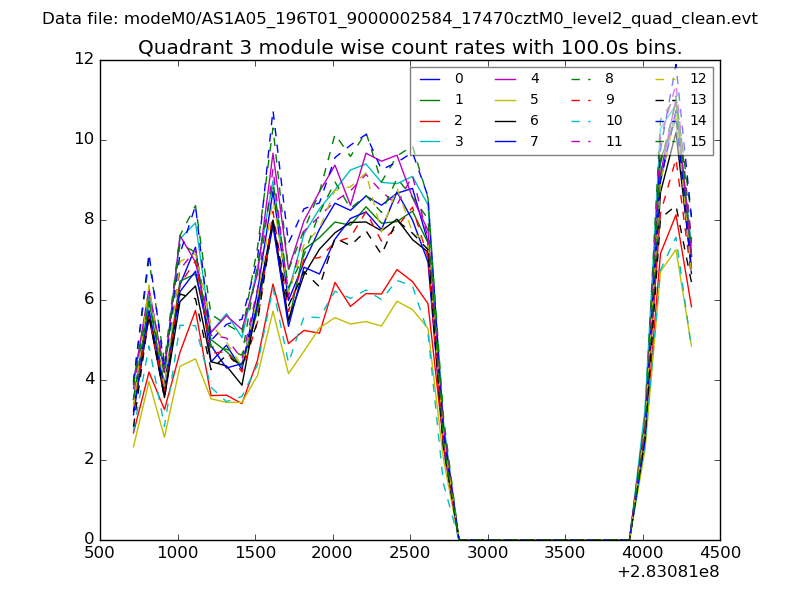
| Module-wise count rates for Quadrant C Data is divided into 100 sec bins |
 |
 |
| Module-wise count rates for Quadrant D Data is divided into 100 sec bins |
 |
 |
| Parameter | Plot |
|---|---|
| CZT HV Monitor | 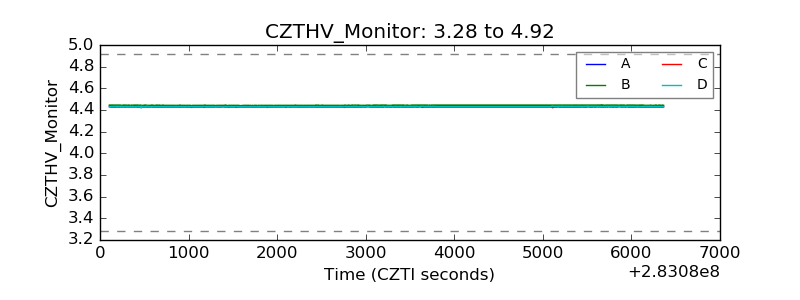 |
| D_VDD | 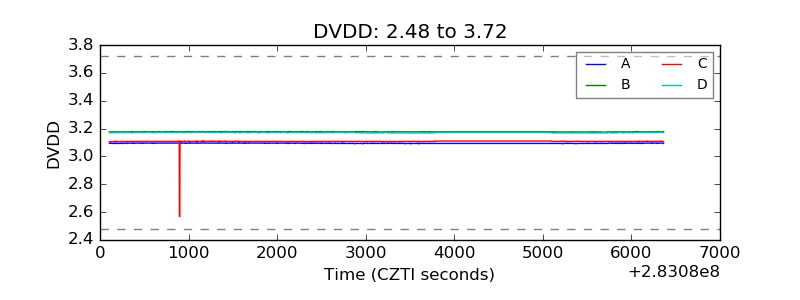 |
| Temperature 1 | 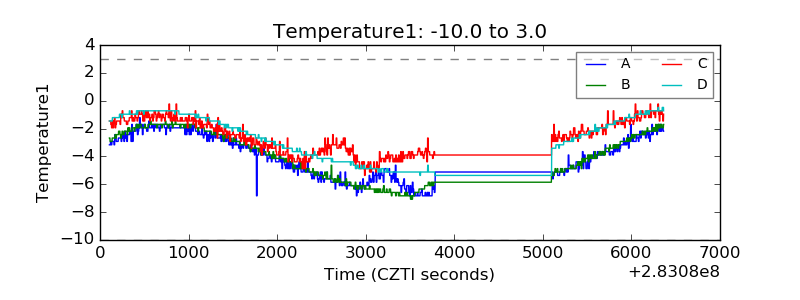 |
| Veto HV Monitor | 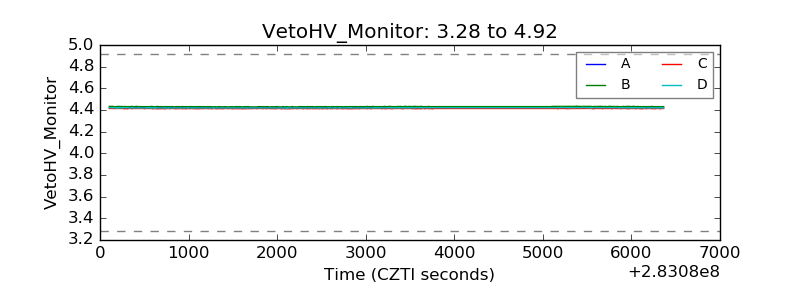 |
| Veto LLD | 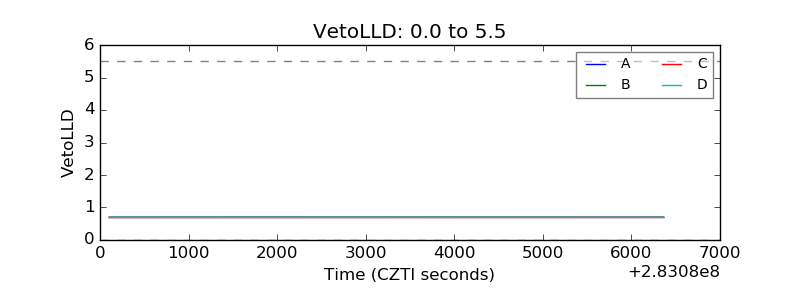 |
| Alpha Counter | 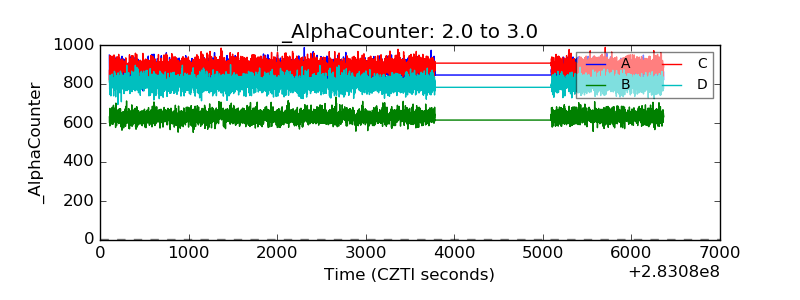 |
| _CPM_Rate |  |
| CZT Counter | 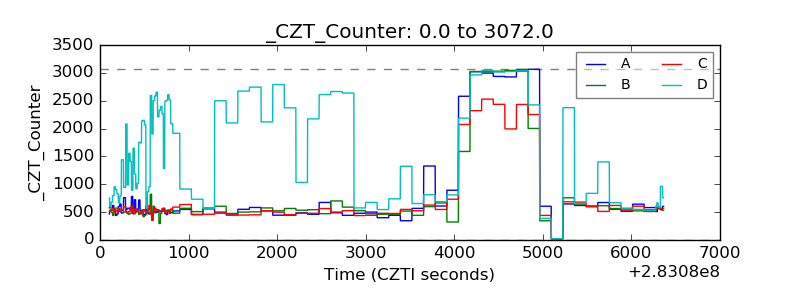 |
| +2.5 Volts monitor | 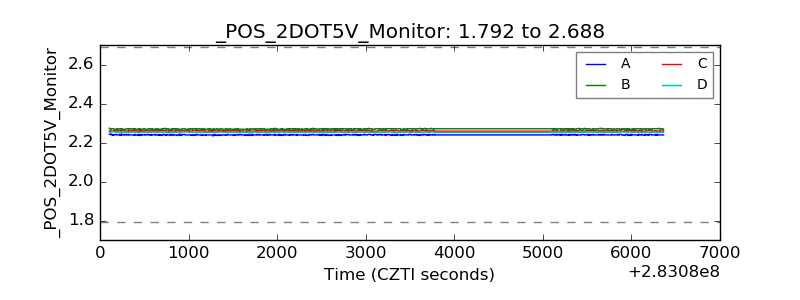 |
| +5 Volts monitor |  |
| _ROLL_ROT | 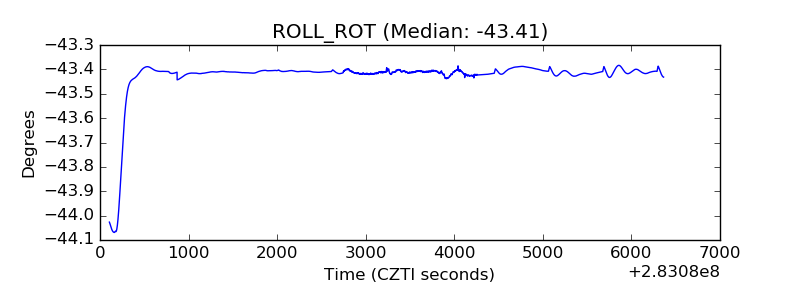 |
| _Roll_DEC | 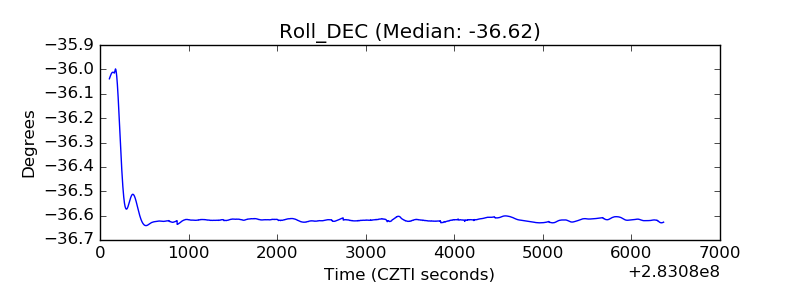 |
| _Roll_RA | 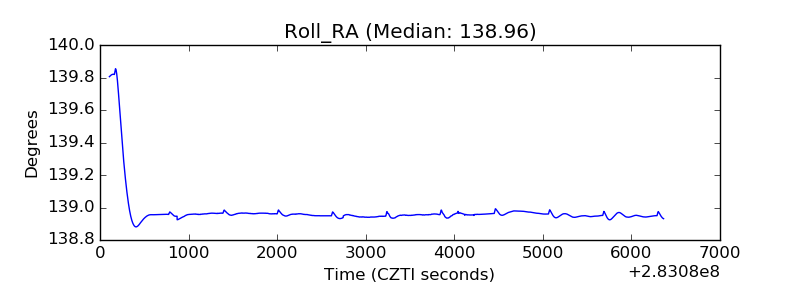 |
| Veto Counter | 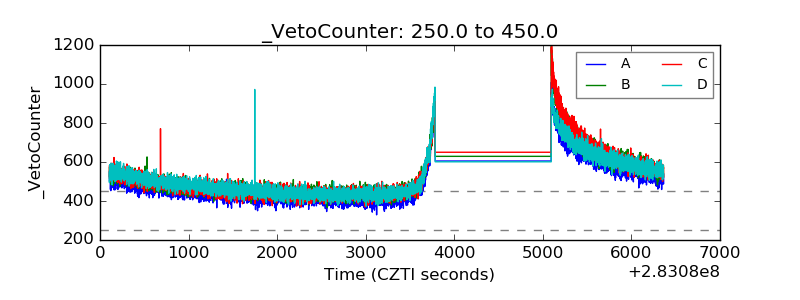 |