| Param | Original file | Final file |
|---|---|---|
| Filename | modeM0/AS1A05_196T01_9000002584_17471cztM0_level2.evt | modeM0/AS1A05_196T01_9000002584_17471cztM0_level2_quad_clean.evt |
| Size (bytes) | 639,008,640 | 67,426,560 |
| Size | 609.4 MB | 64.3 MB |
| Events in quadrant A | 3,781,944 | 413,334 |
| Events in quadrant B | 3,853,313 | 414,662 |
| Events in quadrant C | 3,612,246 | 393,884 |
| Events in quadrant D | 7,657,710 | 358,669 |
| Mode M0 | |||
|---|---|---|---|
| Quadrant | BADHDUFLAG | Total packets | Discarded packets |
| A | 0 | 15229 | 2 |
| B | 0 | 15538 | 2 |
| C | 0 | 14762 | 2 |
| D | 0 | 27293 | 4 |
| Mode M9 | |||
|---|---|---|---|
| Quadrant | BADHDUFLAG | Total packets | Discarded packets |
| A | 0 | 15 | 0 |
| B | 0 | 16 | 0 |
| C | 0 | 16 | 0 |
| D | 0 | 16 | 0 |
| Mode SS | |||
|---|---|---|---|
| Quadrant | BADHDUFLAG | Total packets | Discarded packets |
| A | 0 | 134 | 0 |
| B | 0 | 134 | 0 |
| C | 0 | 134 | 0 |
| D | 0 | 134 | 0 |
| Quadrant | Total seconds | Saturated seconds | Saturation percentage |
|---|---|---|---|
| A | 6608 | 209 | 3.162833% |
| B | 6608 | 129 | 1.952179% |
| C | 6608 | 139 | 2.103511% |
| D | 6607 | 1415 | 21.416679% |
Noise dominated data is calculated using 1-second bins in cleaned event files. If a bin has >2000 counts, and if more than 50% of those come from <1% of pixels, then it is considered to be noise-dominated and hence unusable.
| Quadrant | # 1 sec bins | Bins with >0 counts | Bins with >2000 counts | High rate bins dominated by noise | Noise dominated (total time) | Noise dominated (detector-on time) | Marked lightcurve |
|---|---|---|---|---|---|---|---|
| A | 7943 | 6608 | 94 | 94 | 1.18% | 1.42% | 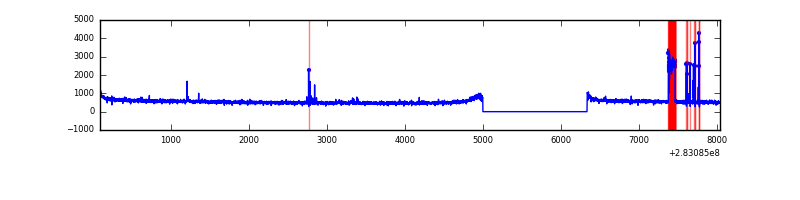 |
| B | 7943 | 6609 | 18 | 18 | 0.23% | 0.27% | 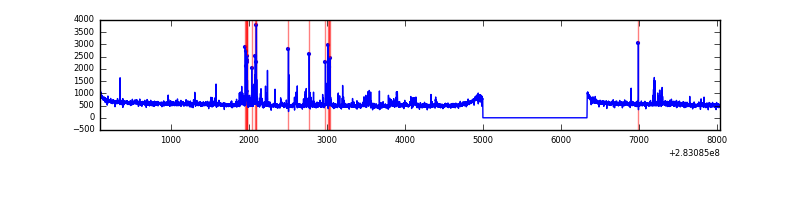 |
| C | 7943 | 6608 | 0 | 0 | 0.00% | 0.00% | 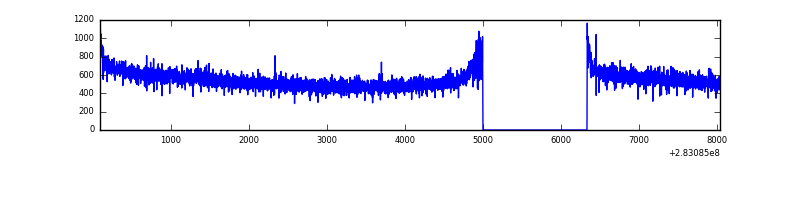 |
| D | 7942 | 6607 | 1154 | 1154 | 14.53% | 17.47% | 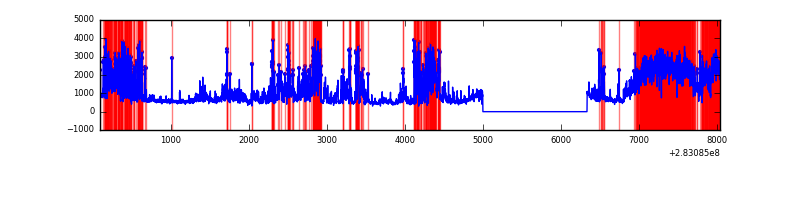 |
Top three noisy pixels from each quadrant. If the there are fewer than three noisy pixels in the level2.evt file, extra rows are filled as -1
| Pixel properties | Quadrant properties | ||||||
|---|---|---|---|---|---|---|---|
| Quadrant | DetID | PixID | Counts | Sigma | Mean | Median | Sigma |
| A | 0 | 23 | 219954 | 1205.58 | 915 | 899 | 181.7 |
| A | 15 | 174 | 26619 | 141.55 | 915 | 899 | 181.7 |
| A | 0 | 226 | 24448 | 129.6 | 915 | 899 | 181.7 |
| B | 7 | 220 | 83583 | 492.35 | 909 | 891 | 168.0 |
| B | 10 | 16 | 60143 | 352.79 | 909 | 891 | 168.0 |
| B | 0 | 189 | 44221 | 257.99 | 909 | 891 | 168.0 |
| C | 14 | 238 | 139430 | 693.87 | 875 | 884 | 199.7 |
| C | 5 | 218 | 36494 | 178.34 | 875 | 884 | 199.7 |
| C | 3 | 233 | 12926 | 60.31 | 875 | 884 | 199.7 |
| D | 11 | 176 | 3317771 | 16510.51 | 831 | 807 | 200.9 |
| D | 10 | 70 | 958524 | 4767.13 | 831 | 807 | 200.9 |
| D | 13 | 189 | 116882 | 577.77 | 831 | 807 | 200.9 |
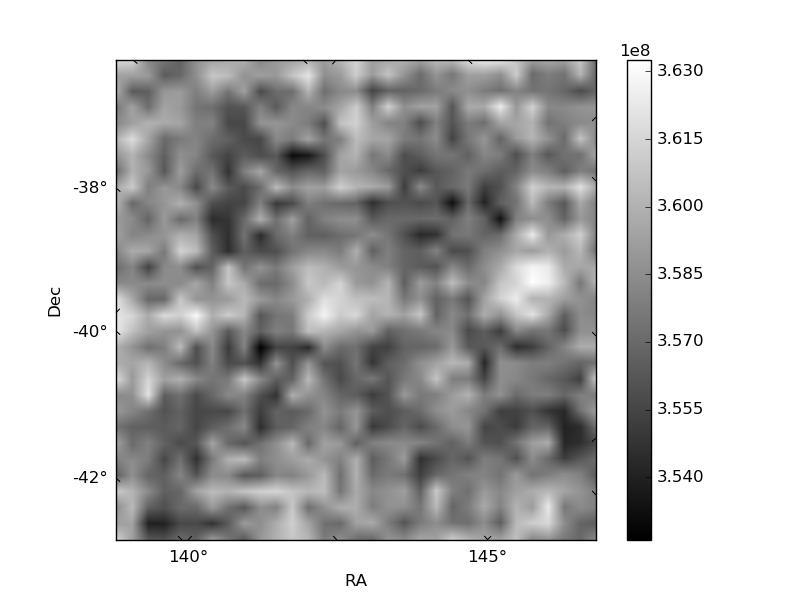
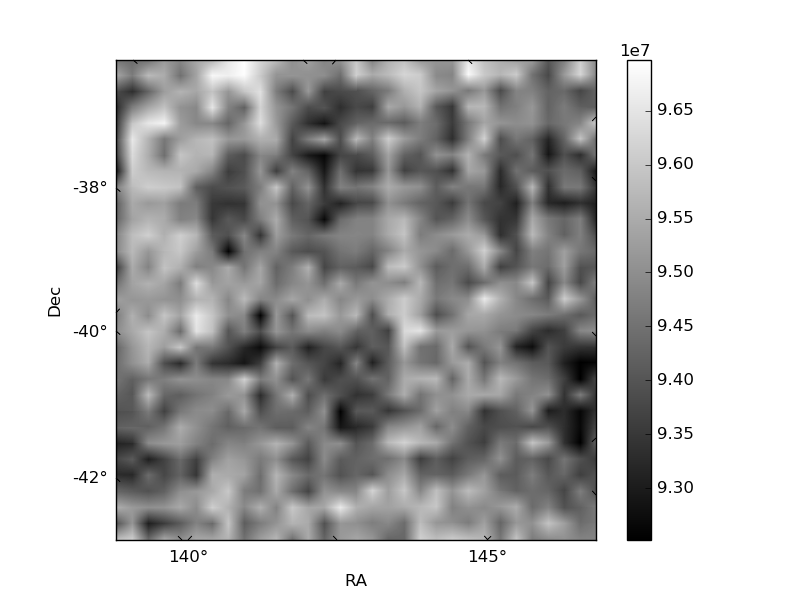
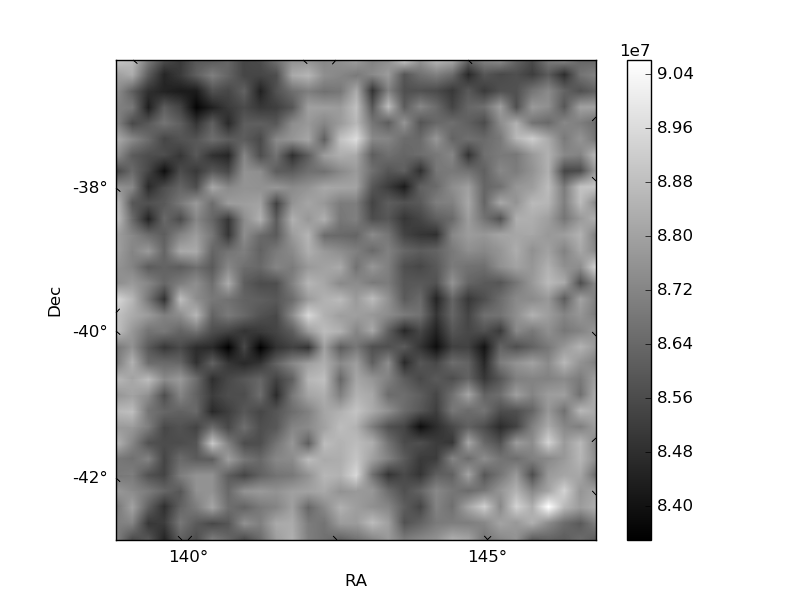
Histogram calculated using DETX and DETY for each event in the final _common_clean file
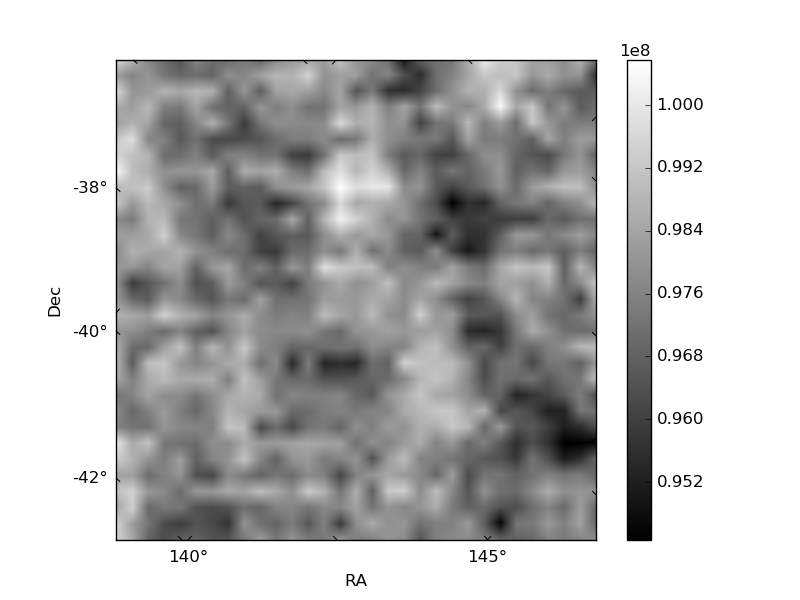
| Quadrant A | 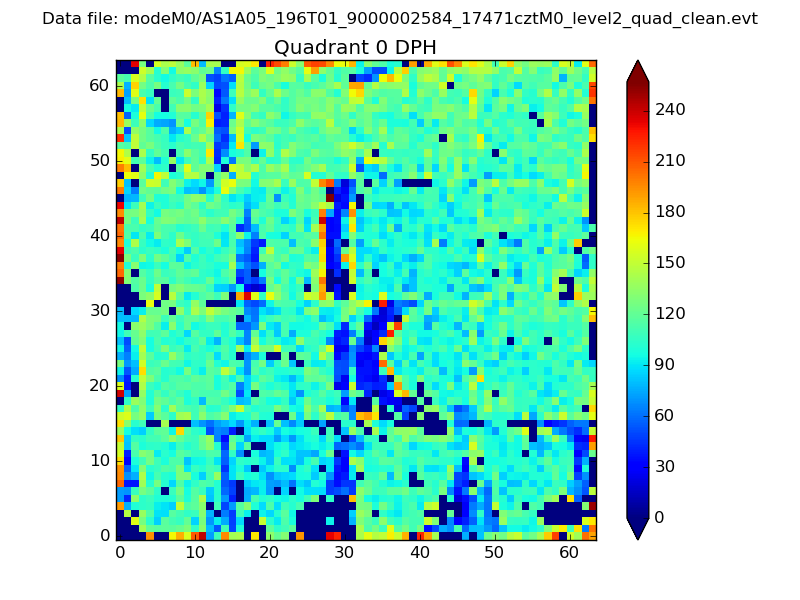 |
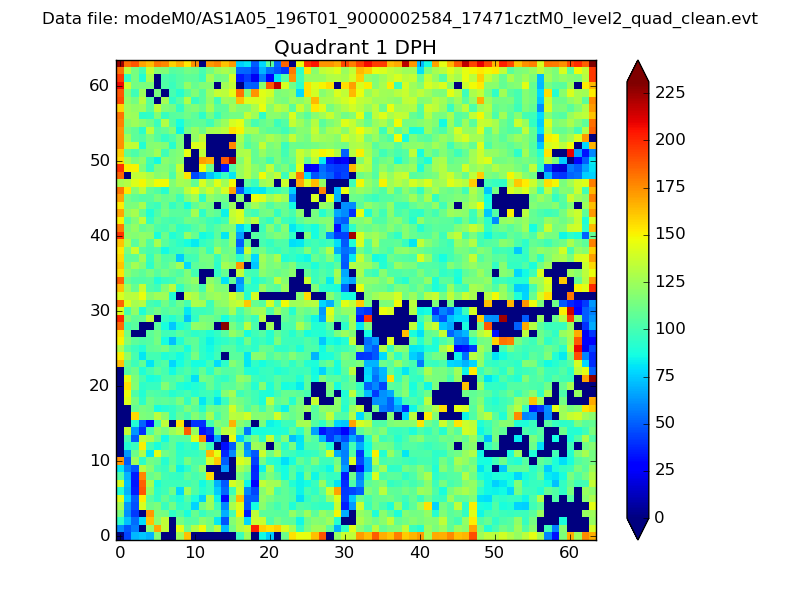 |
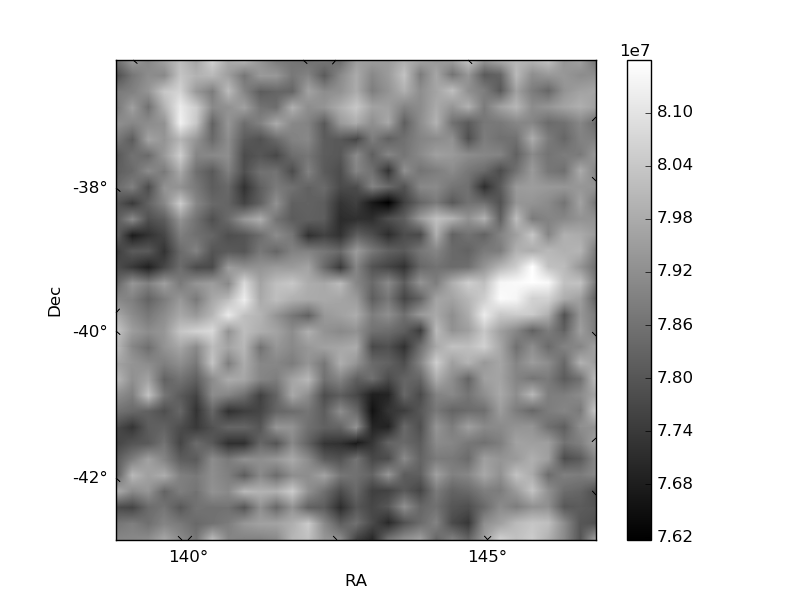
Quadrant B |
|---|---|---|---|
| Quadrant D | 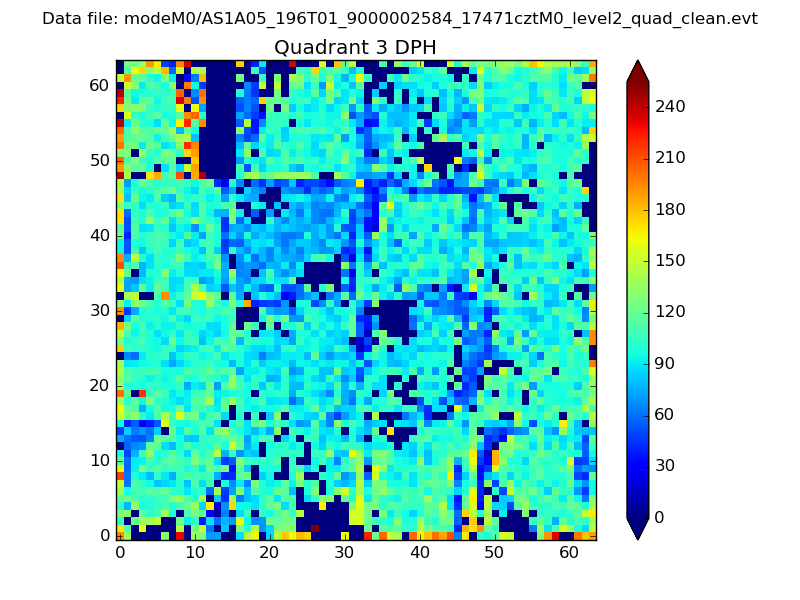 |
 |
Quadrant C |
| Plot type | Count rate plots | Images |
|---|---|---|
| Comparison with Poisson distribution Blue bars denote a histogram of data divided into 1 sec bins. Red curve is a Poisson curve with rate = median count rate of data. |
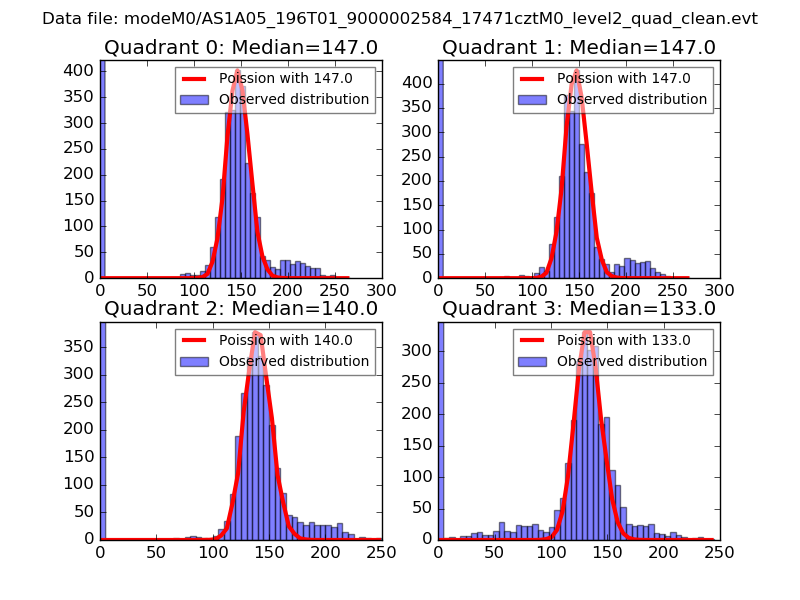 |
 |
| Quadrant-wise count rates Data is divided into 100 sec bins |
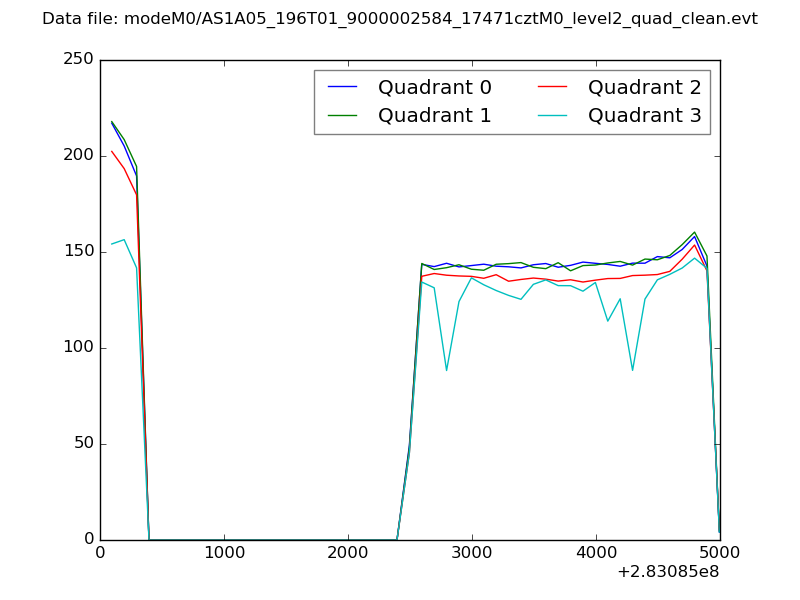 |
|
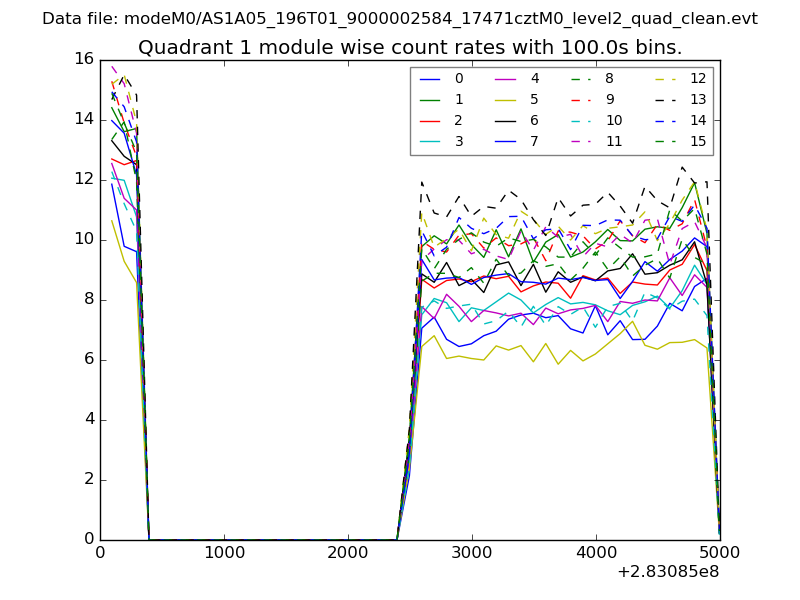
| Module-wise count rates for Quadrant A Data is divided into 100 sec bins |
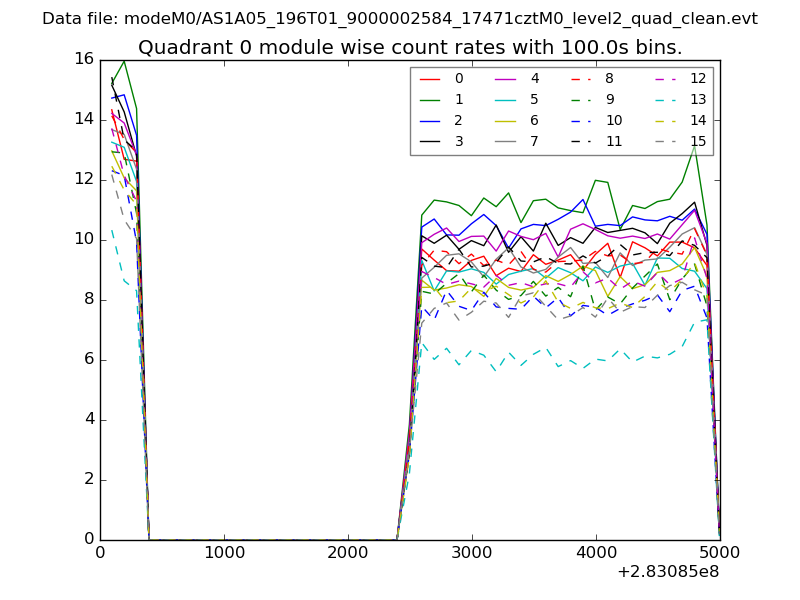 |
 |
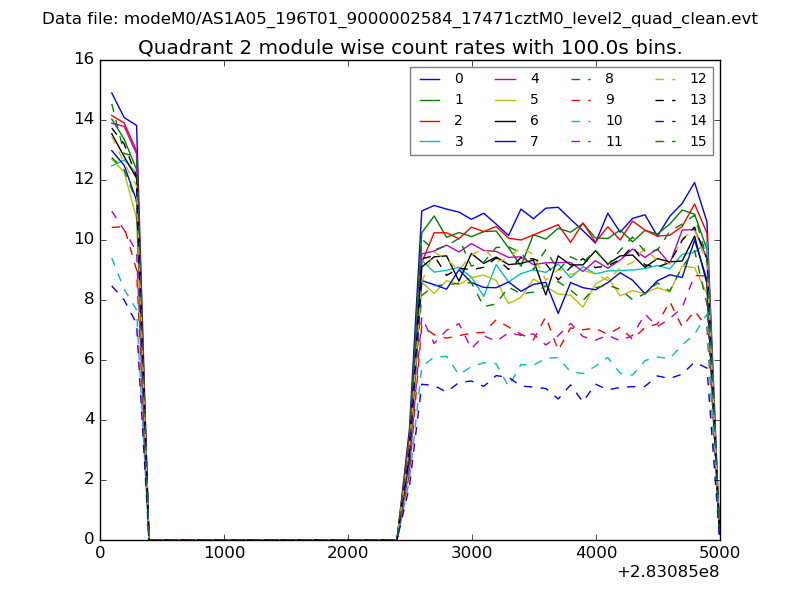
| Module-wise count rates for Quadrant B Data is divided into 100 sec bins |
 |
 |
| Module-wise count rates for Quadrant C Data is divided into 100 sec bins |
 |
 |
| Module-wise count rates for Quadrant D Data is divided into 100 sec bins |
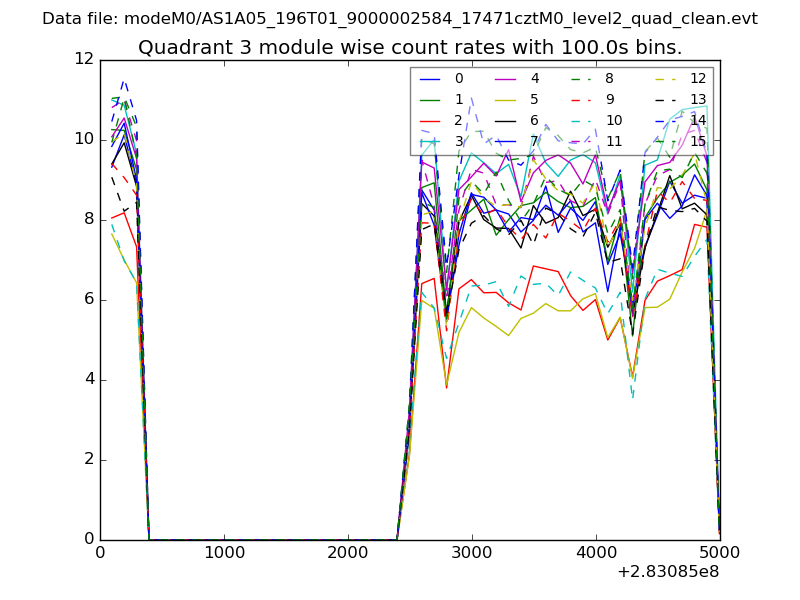 |
 |
| Parameter | Plot |
|---|---|
| CZT HV Monitor | 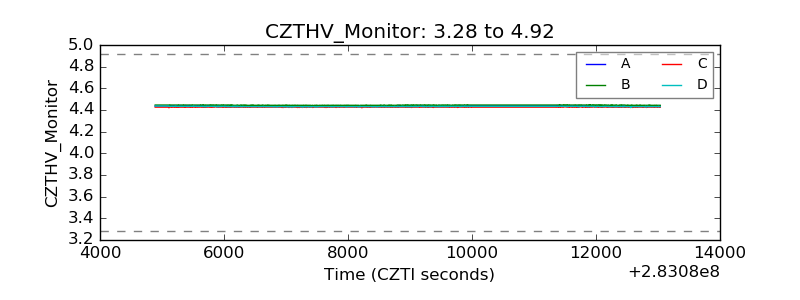 |
| D_VDD | 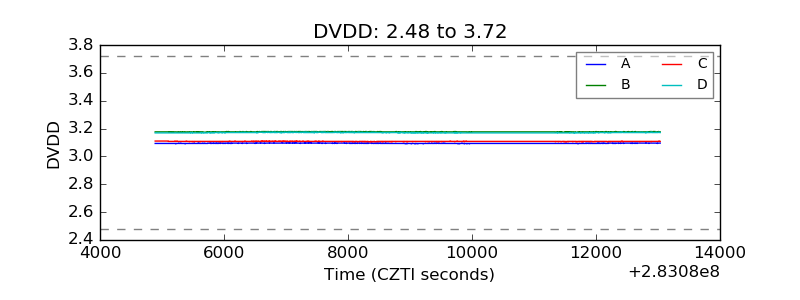 |
| Temperature 1 | 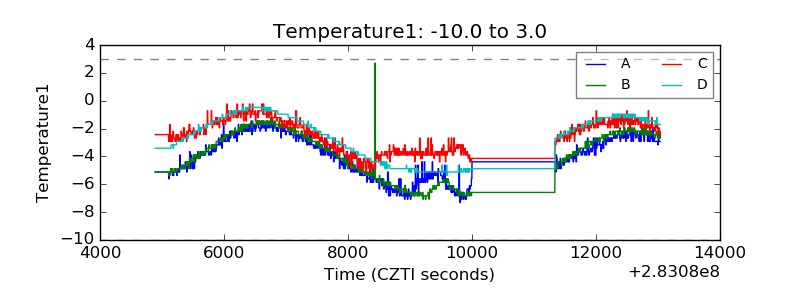 |
| Veto HV Monitor | 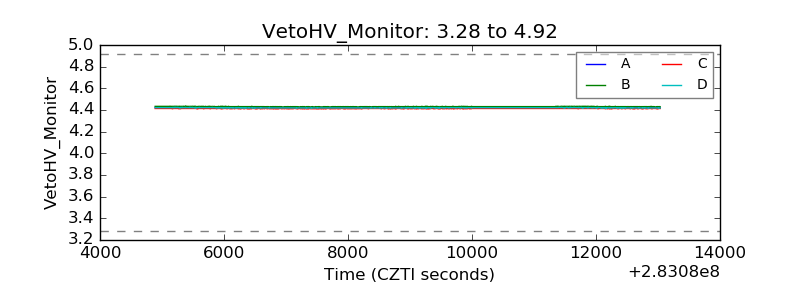 |
| Veto LLD | 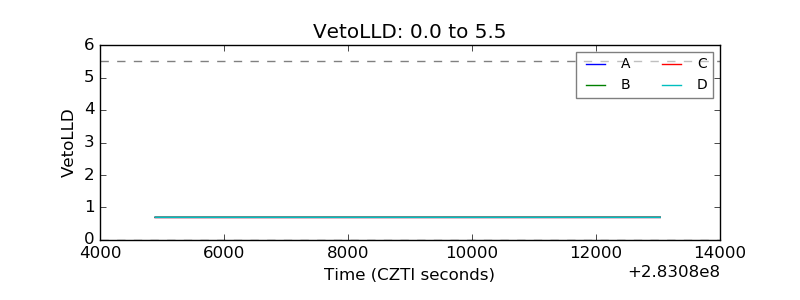 |
| Alpha Counter | 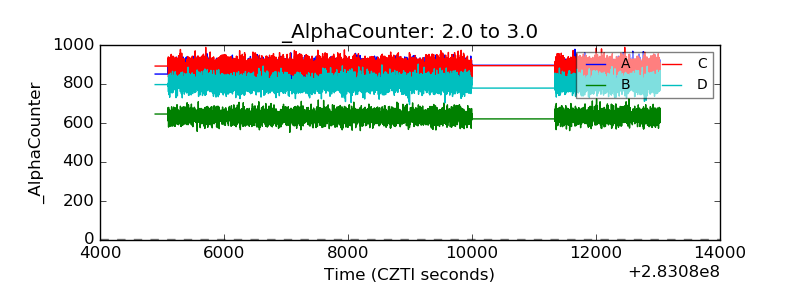 |
| _CPM_Rate | 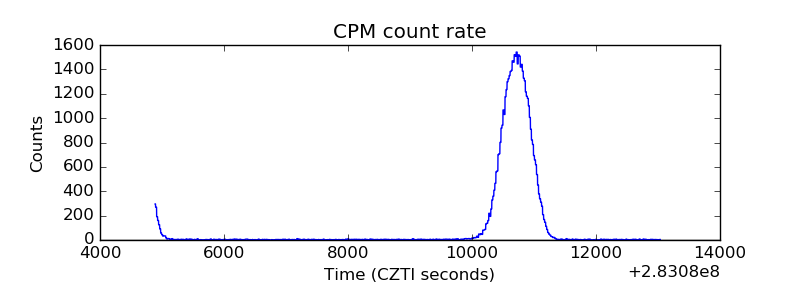 |
| CZT Counter | 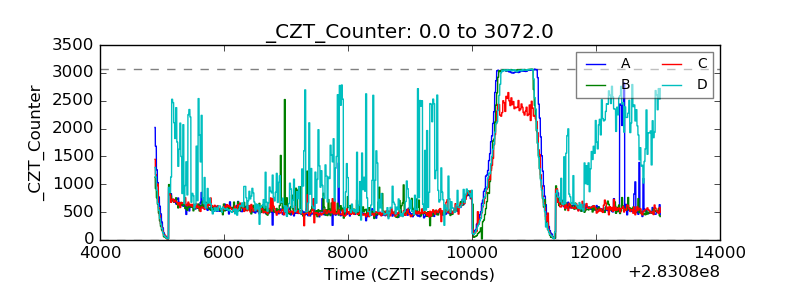 |
| +2.5 Volts monitor |  |
| +5 Volts monitor | 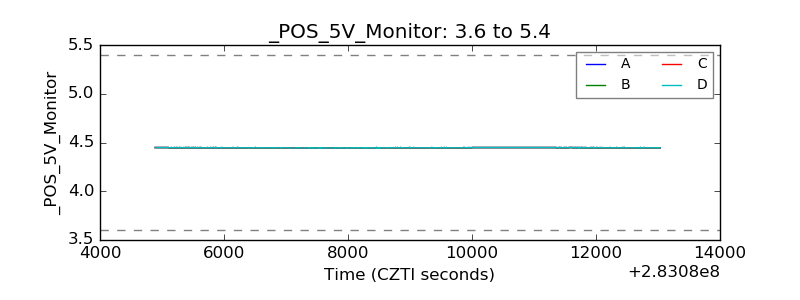 |
| _ROLL_ROT | 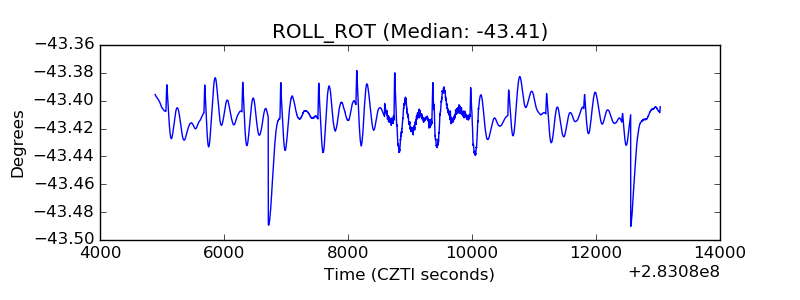 |
| _Roll_DEC | 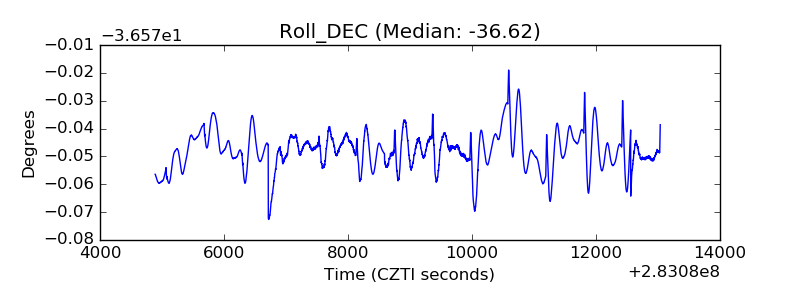 |
| _Roll_RA | 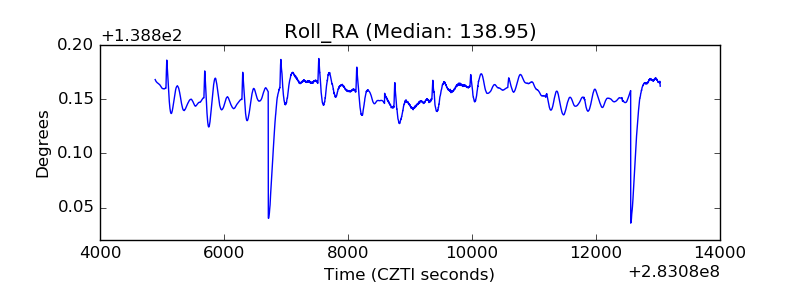 |
| Veto Counter | 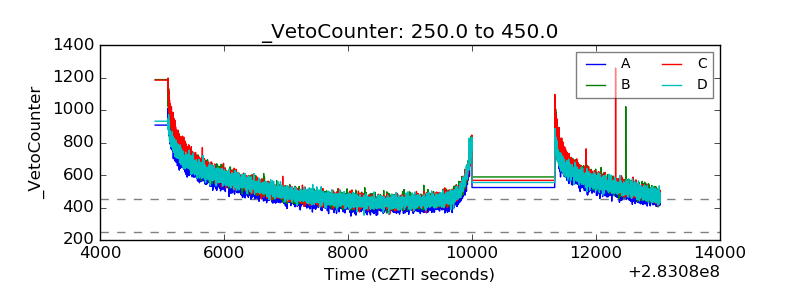 |