| Param | Original file | Final file |
|---|---|---|
| Filename | modeM0/AS1A05_196T01_9000002584_17473cztM0_level2.evt | modeM0/AS1A05_196T01_9000002584_17473cztM0_level2_quad_clean.evt |
| Size (bytes) | 496,823,040 | 84,608,640 |
| Size | 473.8 MB | 80.7 MB |
| Events in quadrant A | 3,155,339 | 542,375 |
| Events in quadrant B | 3,210,080 | 547,318 |
| Events in quadrant C | 3,245,408 | 521,867 |
| Events in quadrant D | 4,996,624 | 499,747 |
| Mode M0 | |||
|---|---|---|---|
| Quadrant | BADHDUFLAG | Total packets | Discarded packets |
| A | 0 | 13443 | 1 |
| B | 0 | 13458 | 1 |
| C | 0 | 13717 | 1 |
| D | 0 | 19215 | 1 |
| Mode M9 | |||
|---|---|---|---|
| Quadrant | BADHDUFLAG | Total packets | Discarded packets |
| A | 0 | 9 | 0 |
| B | 0 | 9 | 0 |
| C | 0 | 9 | 0 |
| D | 0 | 9 | 0 |
| Mode SS | |||
|---|---|---|---|
| Quadrant | BADHDUFLAG | Total packets | Discarded packets |
| A | 0 | 132 | 0 |
| B | 0 | 132 | 0 |
| C | 0 | 132 | 0 |
| D | 0 | 132 | 0 |
| Quadrant | Total seconds | Saturated seconds | Saturation percentage |
|---|---|---|---|
| A | 6458 | 111 | 1.718798% |
| B | 6459 | 119 | 1.842390% |
| C | 6459 | 127 | 1.966249% |
| D | 6459 | 662 | 10.249265% |
Noise dominated data is calculated using 1-second bins in cleaned event files. If a bin has >2000 counts, and if more than 50% of those come from <1% of pixels, then it is considered to be noise-dominated and hence unusable.
| Quadrant | # 1 sec bins | Bins with >0 counts | Bins with >2000 counts | High rate bins dominated by noise | Noise dominated (total time) | Noise dominated (detector-on time) | Marked lightcurve |
|---|---|---|---|---|---|---|---|
| A | 7333 | 6458 | 2 | 2 | 0.03% | 0.03% | 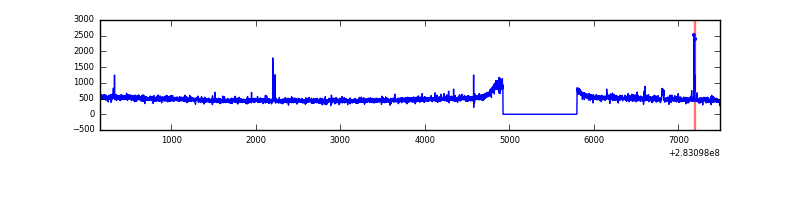 |
| B | 7334 | 6459 | 0 | 0 | 0.00% | 0.00% | 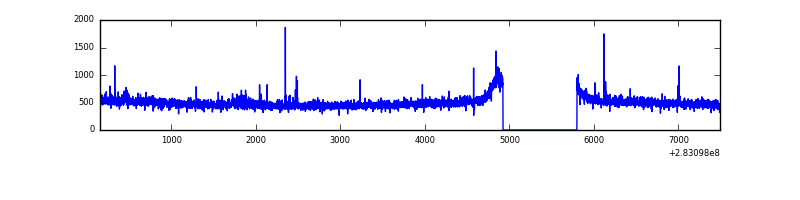 |
| C | 7334 | 6460 | 0 | 0 | 0.00% | 0.00% | 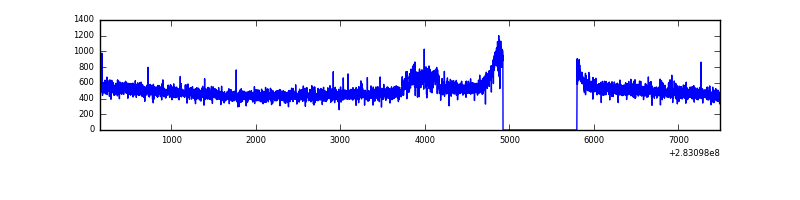 |
| D | 7334 | 6460 | 485 | 485 | 6.61% | 7.51% | 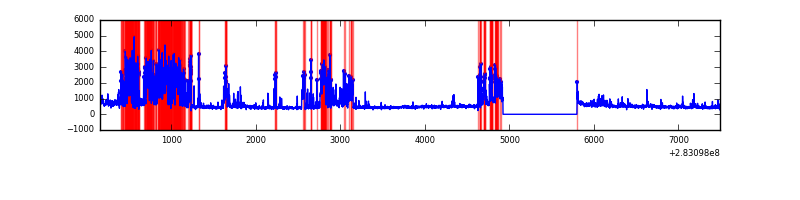 |
Top three noisy pixels from each quadrant. If the there are fewer than three noisy pixels in the level2.evt file, extra rows are filled as -1
| Pixel properties | Quadrant properties | ||||||
|---|---|---|---|---|---|---|---|
| Quadrant | DetID | PixID | Counts | Sigma | Mean | Median | Sigma |
| A | 15 | 174 | 24007 | 141.36 | 811 | 794 | 164.2 |
| A | 4 | 2 | 9937 | 55.68 | 811 | 794 | 164.2 |
| A | 0 | 226 | 7311 | 39.69 | 811 | 794 | 164.2 |
| B | 0 | 189 | 29605 | 185.55 | 808 | 787 | 155.3 |
| B | 12 | 111 | 17929 | 110.37 | 808 | 787 | 155.3 |
| B | 11 | 111 | 15249 | 93.12 | 808 | 787 | 155.3 |
| C | 14 | 238 | 121059 | 665.05 | 773 | 781 | 180.9 |
| C | 7 | 220 | 68695 | 375.51 | 773 | 781 | 180.9 |
| C | 5 | 218 | 33987 | 183.6 | 773 | 781 | 180.9 |
| D | 7 | 238 | 1611583 | 8940.43 | 746 | 726 | 180.2 |
| D | 10 | 70 | 307556 | 1702.94 | 746 | 726 | 180.2 |
| D | 11 | 176 | 59007 | 323.47 | 746 | 726 | 180.2 |
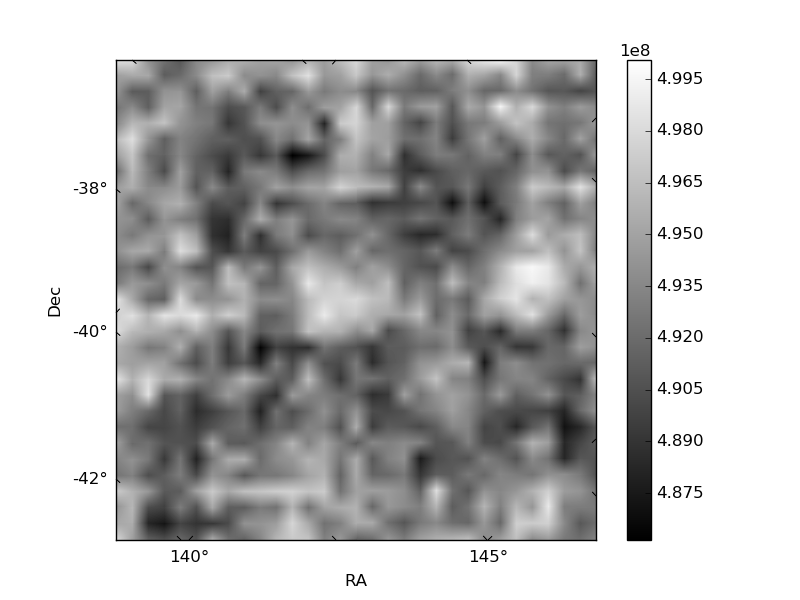
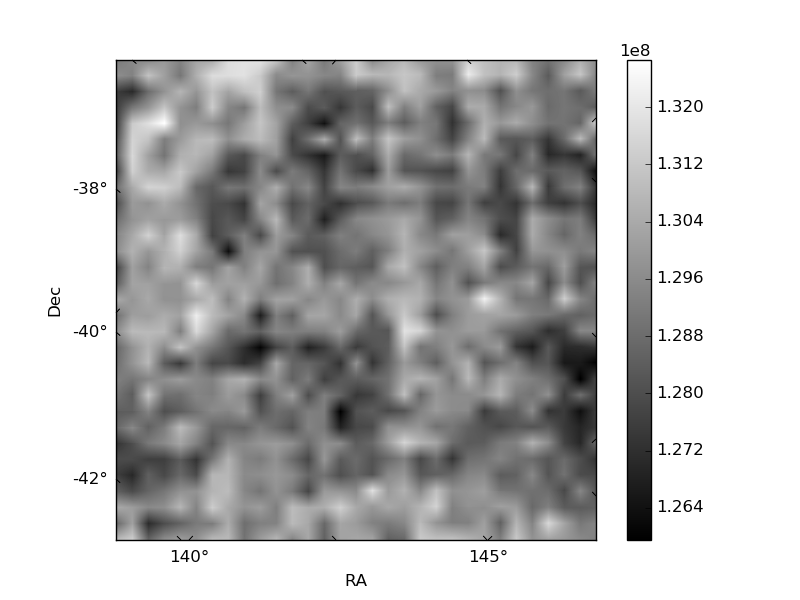
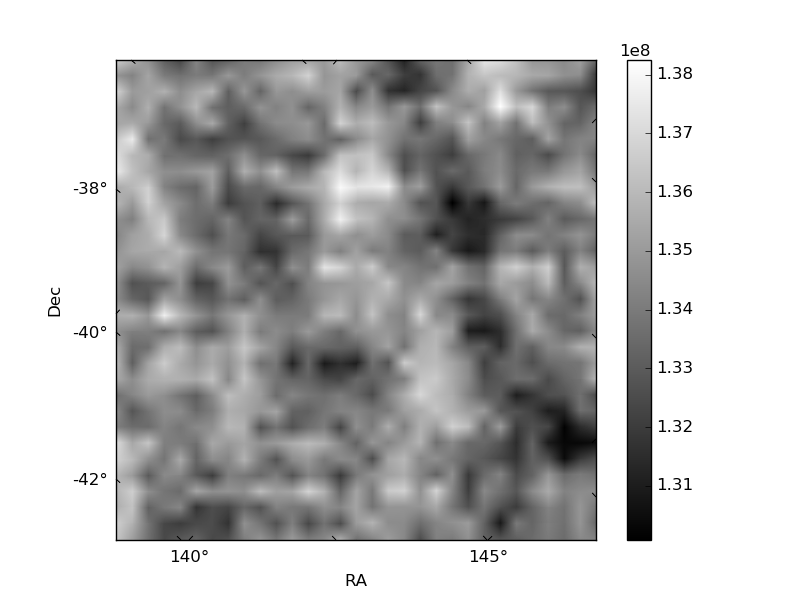
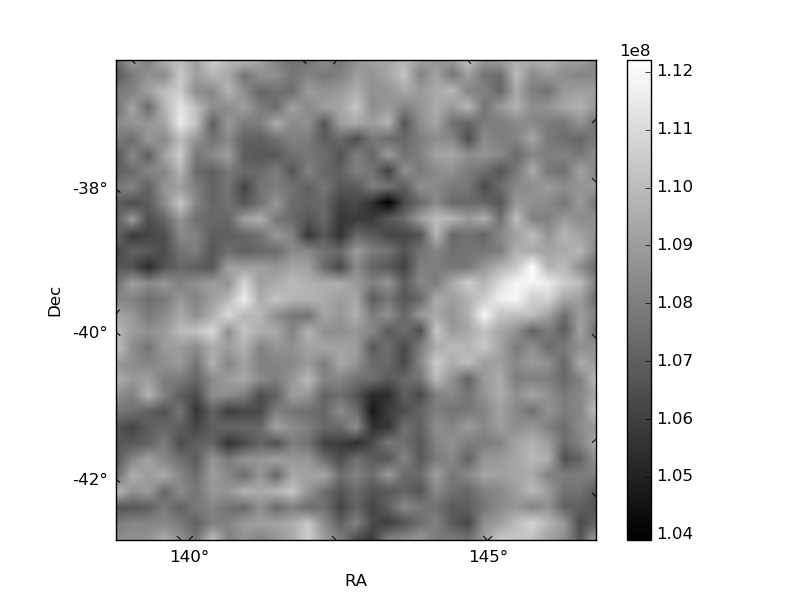
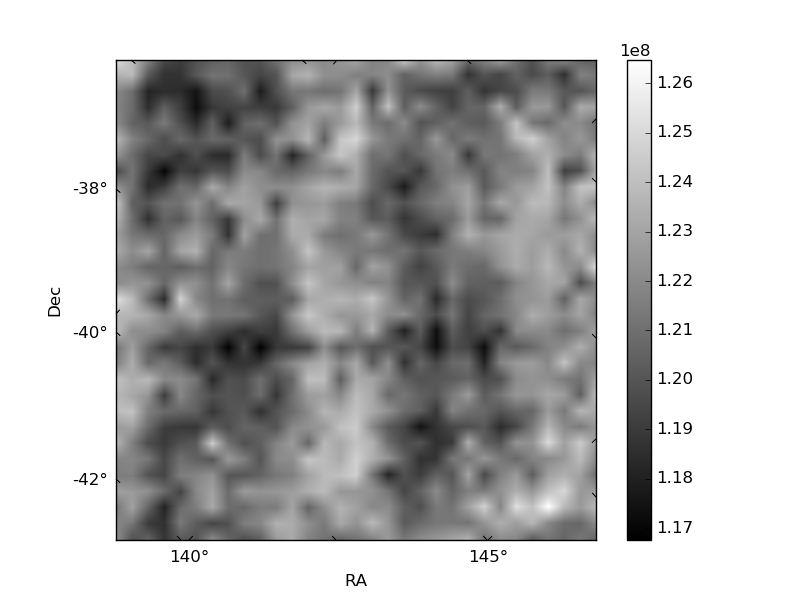
Histogram calculated using DETX and DETY for each event in the final _common_clean file
| Quadrant A | 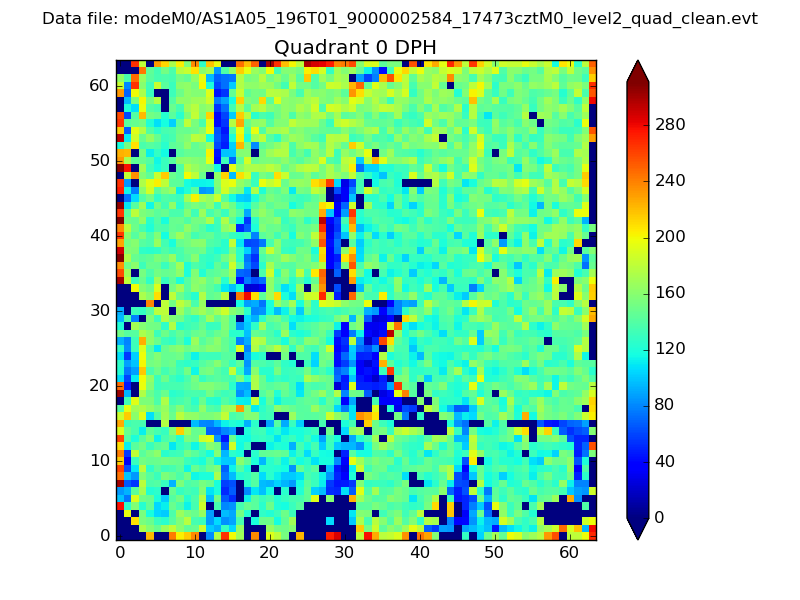 |
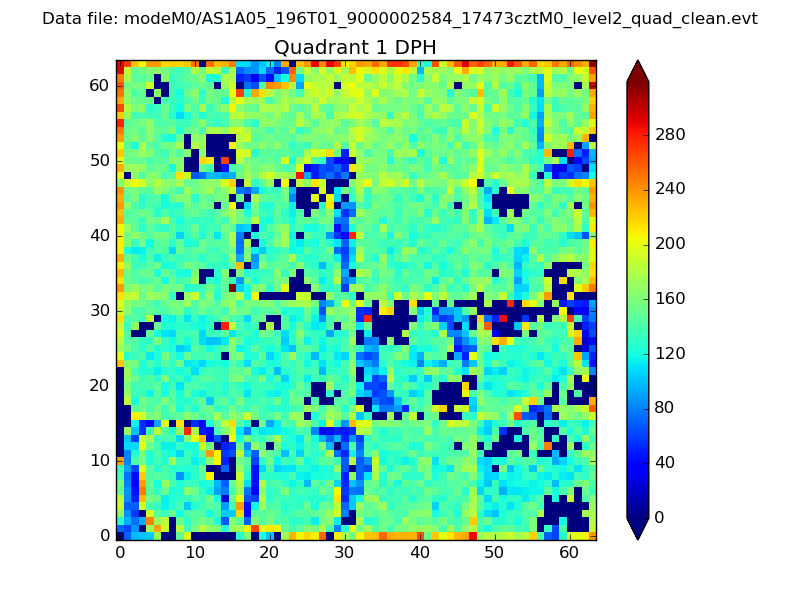 |
Quadrant B |
|---|---|---|---|
| Quadrant D |  |
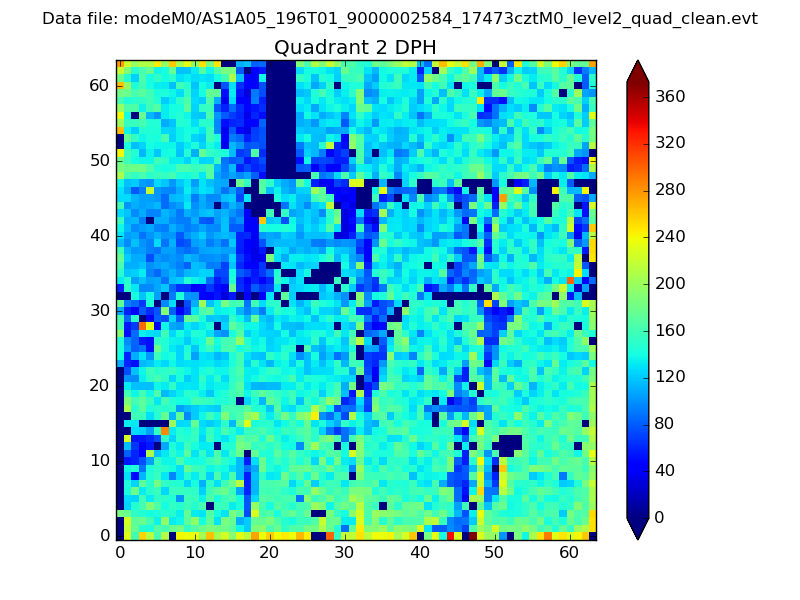 |
Quadrant C |
| Plot type | Count rate plots | Images |
|---|---|---|
| Comparison with Poisson distribution Blue bars denote a histogram of data divided into 1 sec bins. Red curve is a Poisson curve with rate = median count rate of data. |
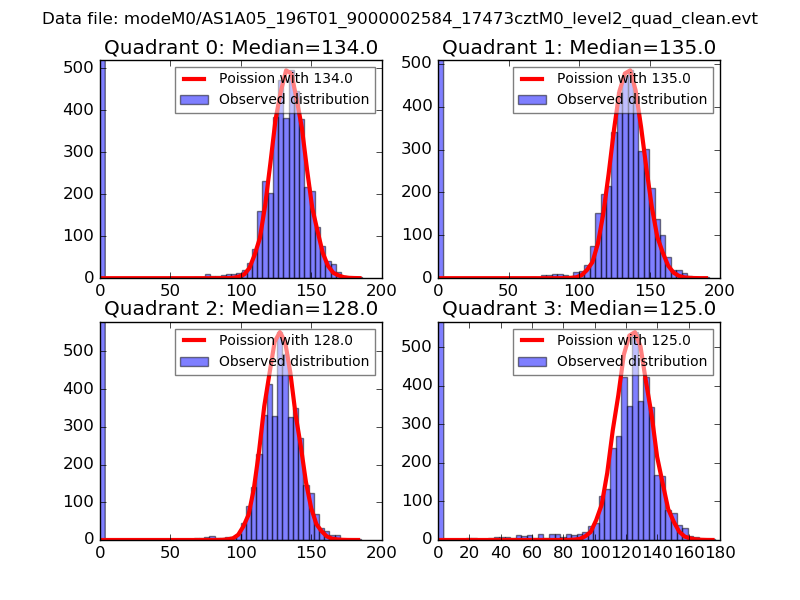 |
 |
| Quadrant-wise count rates Data is divided into 100 sec bins |
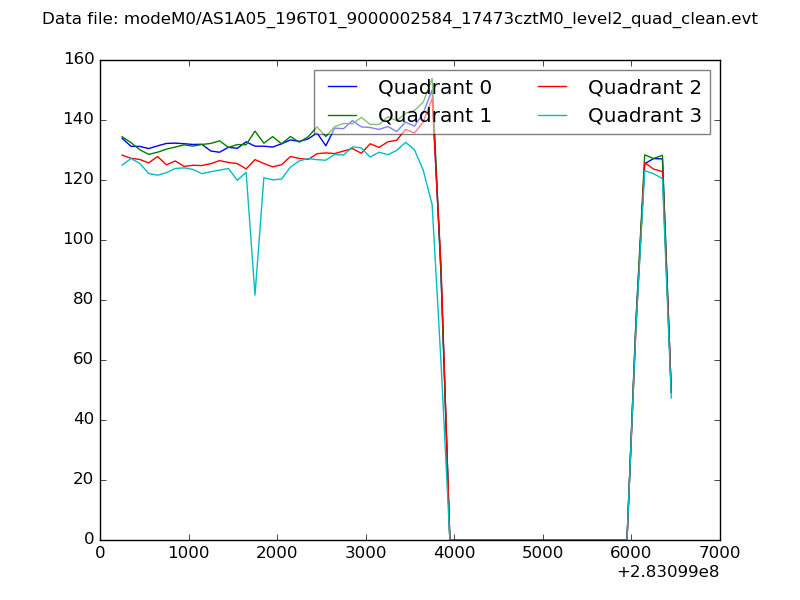 |
|
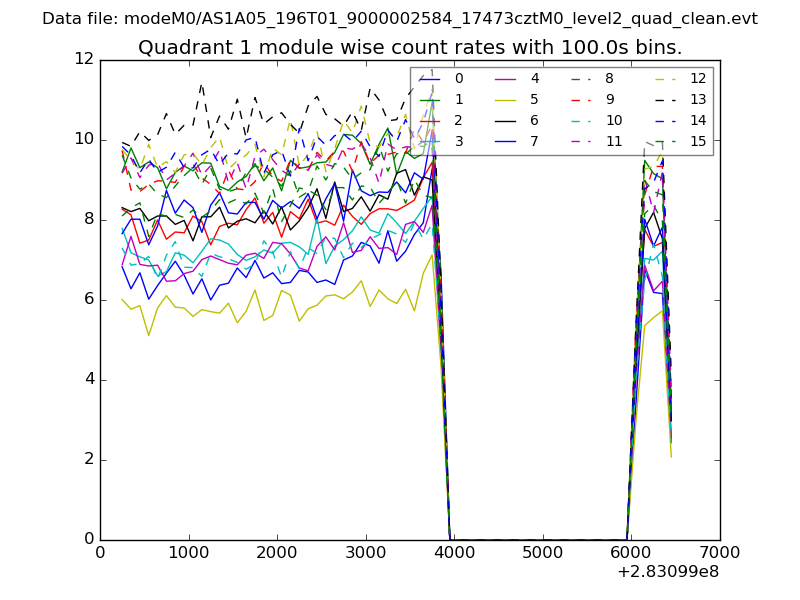
| Module-wise count rates for Quadrant A Data is divided into 100 sec bins |
 |
 |
| Module-wise count rates for Quadrant B Data is divided into 100 sec bins |
 |
 |
| Module-wise count rates for Quadrant C Data is divided into 100 sec bins |
 |
 |
| Module-wise count rates for Quadrant D Data is divided into 100 sec bins |
 |
 |
| Parameter | Plot |
|---|---|
| CZT HV Monitor | 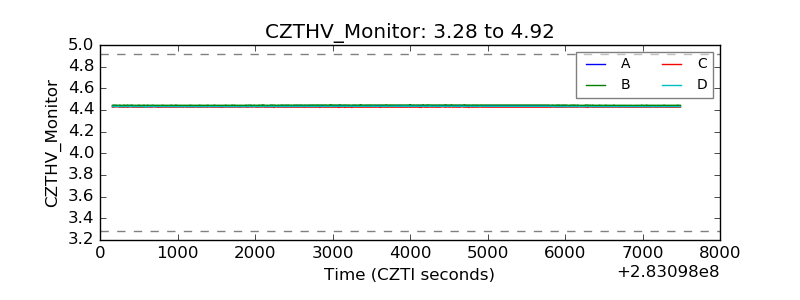 |
| D_VDD | 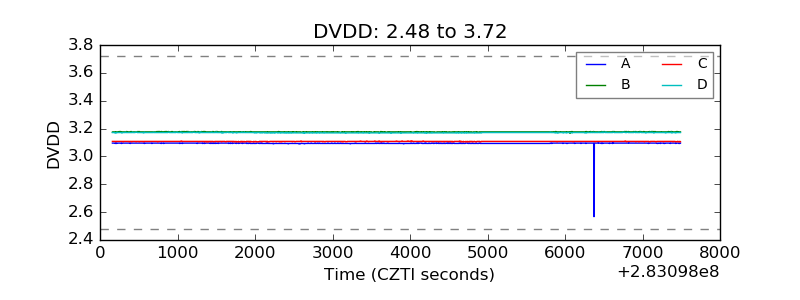 |
| Temperature 1 | 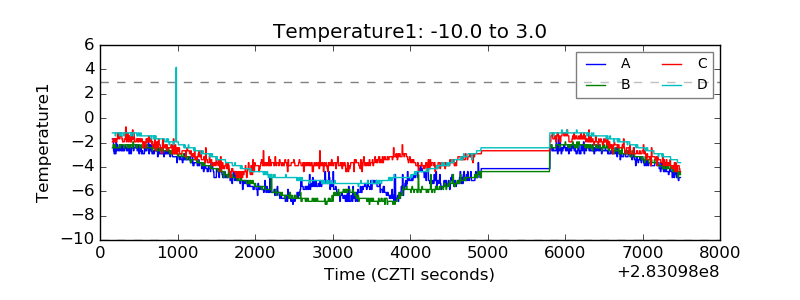 |
| Veto HV Monitor |  |
| Veto LLD | 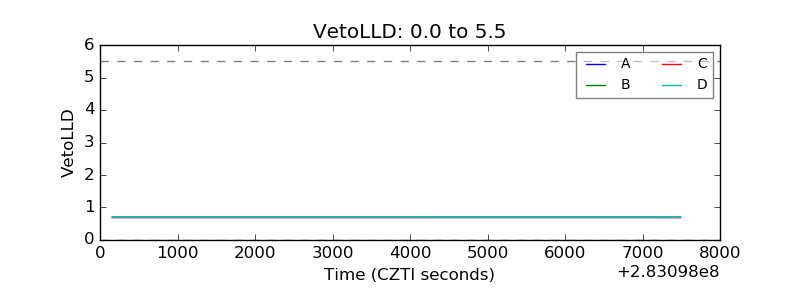 |
| Alpha Counter | 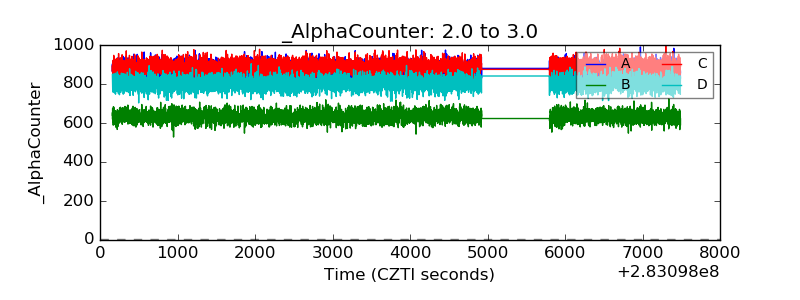 |
| _CPM_Rate | 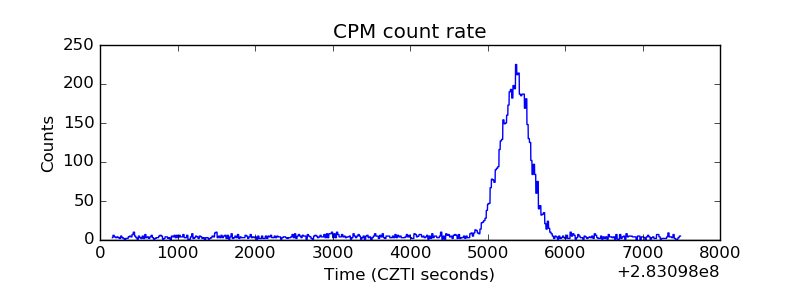 |
| CZT Counter | 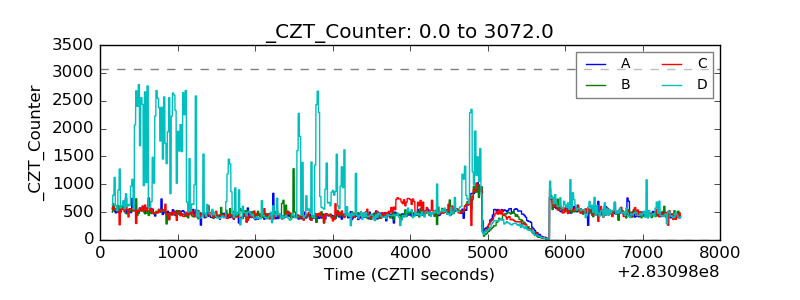 |
| +2.5 Volts monitor | 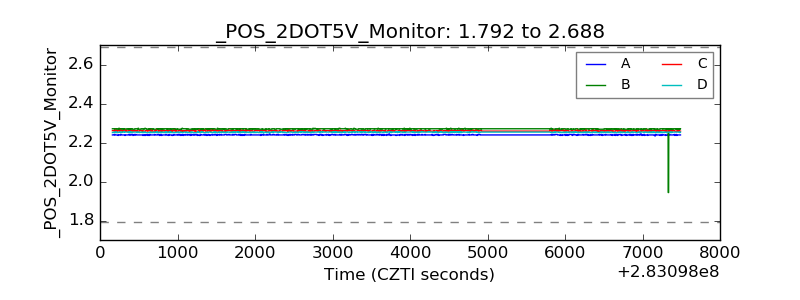 |
| +5 Volts monitor |  |
| _ROLL_ROT | 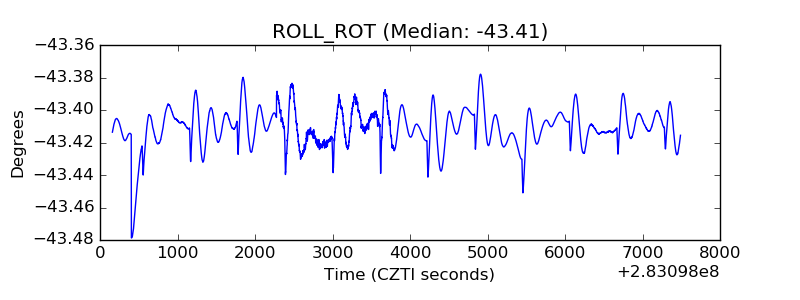 |
| _Roll_DEC |  |
| _Roll_RA | 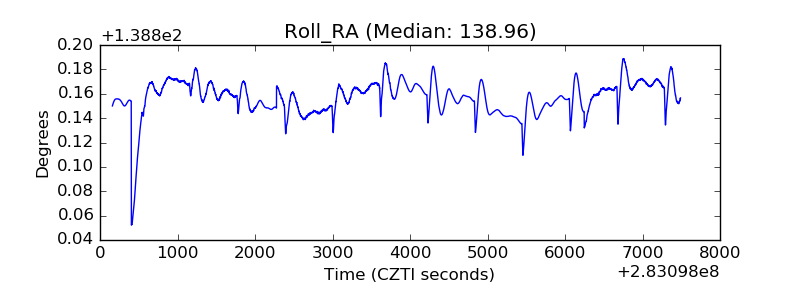 |
| Veto Counter | 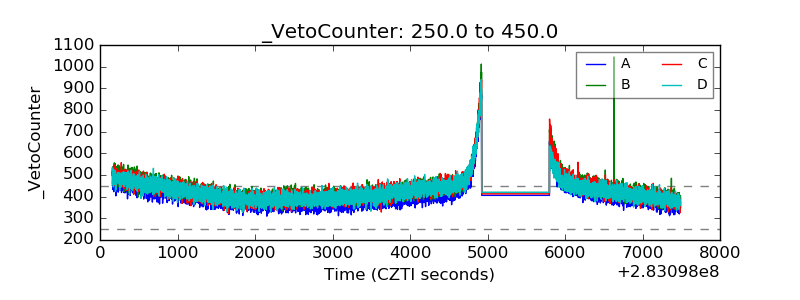 |