| Param | Original file | Final file |
|---|---|---|
| Filename | modeM0/AS1A05_196T01_9000002584_17474cztM0_level2.evt | modeM0/AS1A05_196T01_9000002584_17474cztM0_level2_quad_clean.evt |
| Size (bytes) | 182,350,080 | 25,980,480 |
| Size | 173.9 MB | 24.8 MB |
| Events in quadrant A | 1,292,826 | 155,447 |
| Events in quadrant B | 1,332,262 | 155,630 |
| Events in quadrant C | 1,279,436 | 150,969 |
| Events in quadrant D | 1,444,458 | 143,134 |
| Mode M0 | |||
|---|---|---|---|
| Quadrant | BADHDUFLAG | Total packets | Discarded packets |
| A | 0 | 5460 | 1 |
| B | 0 | 5502 | 1 |
| C | 0 | 5412 | 1 |
| D | 0 | 6023 | 1 |
| Mode M9 | |||
|---|---|---|---|
| Quadrant | BADHDUFLAG | Total packets | Discarded packets |
| A | 0 | 9 | 0 |
| B | 0 | 9 | 0 |
| C | 0 | 9 | 0 |
| D | 0 | 9 | 0 |
| Mode SS | |||
|---|---|---|---|
| Quadrant | BADHDUFLAG | Total packets | Discarded packets |
| A | 0 | 52 | 0 |
| B | 0 | 52 | 0 |
| C | 0 | 52 | 0 |
| D | 0 | 52 | 0 |
| Quadrant | Total seconds | Saturated seconds | Saturation percentage |
|---|---|---|---|
| A | 2519 | 107 | 4.247717% |
| B | 2520 | 114 | 4.523810% |
| C | 2520 | 113 | 4.484127% |
| D | 2520 | 129 | 5.119048% |
Noise dominated data is calculated using 1-second bins in cleaned event files. If a bin has >2000 counts, and if more than 50% of those come from <1% of pixels, then it is considered to be noise-dominated and hence unusable.
| Quadrant | # 1 sec bins | Bins with >0 counts | Bins with >2000 counts | High rate bins dominated by noise | Noise dominated (total time) | Noise dominated (detector-on time) | Marked lightcurve |
|---|---|---|---|---|---|---|---|
| A | 3394 | 2519 | 2 | 2 | 0.06% | 0.08% | 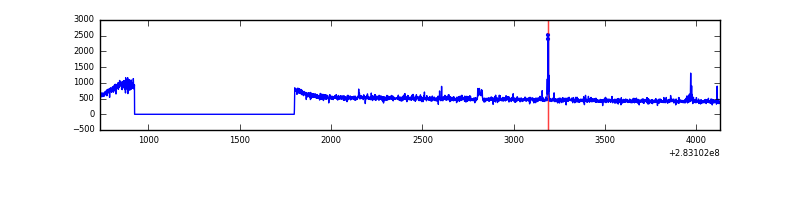 |
| B | 3395 | 2520 | 0 | 0 | 0.00% | 0.00% | 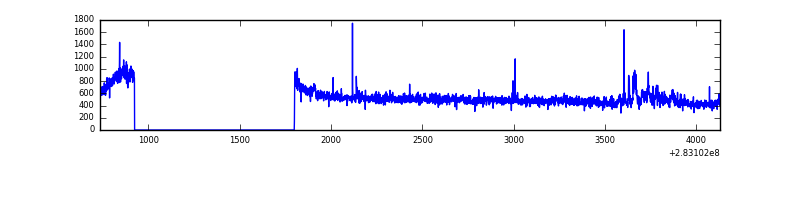 |
| C | 3395 | 2521 | 0 | 0 | 0.00% | 0.00% | 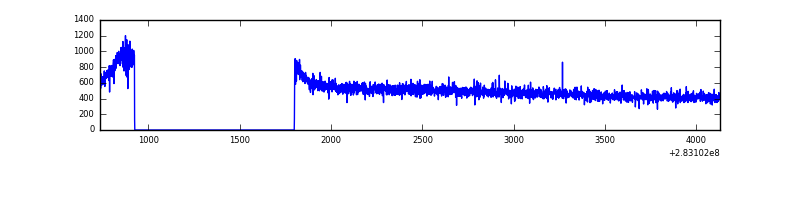 |
| D | 3395 | 2521 | 34 | 34 | 1.00% | 1.35% | 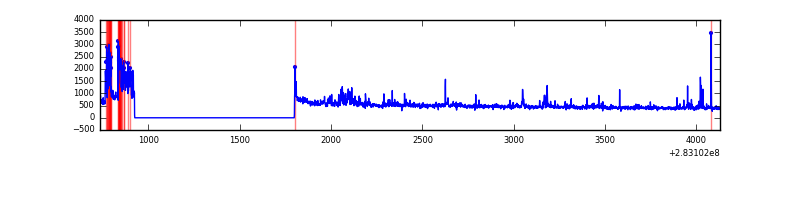 |
Top three noisy pixels from each quadrant. If the there are fewer than three noisy pixels in the level2.evt file, extra rows are filled as -1
| Pixel properties | Quadrant properties | ||||||
|---|---|---|---|---|---|---|---|
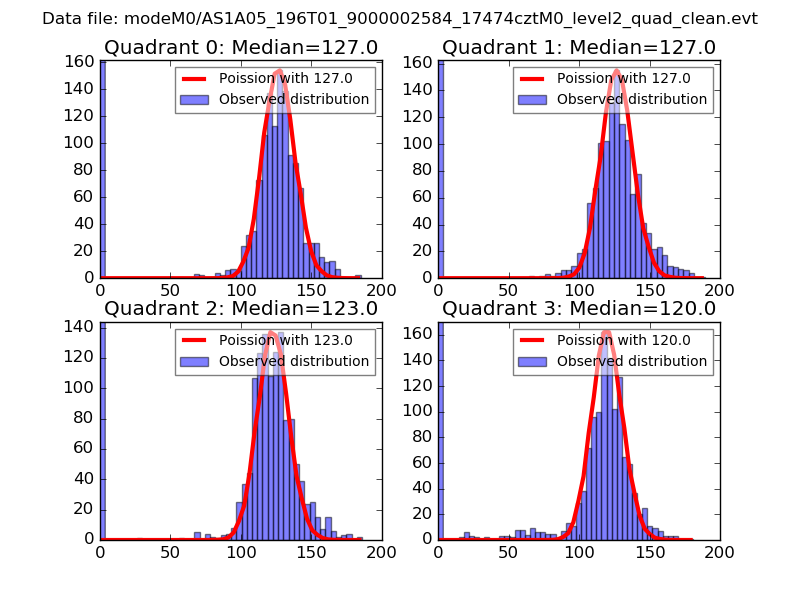
| Quadrant | DetID | PixID | Counts | Sigma | Mean | Median | Sigma |
| A | 15 | 174 | 15942 | 228.18 | 330 | 322 | 68.5 |
| A | 4 | 2 | 9382 | 132.35 | 330 | 322 | 68.5 |
| A | 0 | 226 | 2948 | 38.36 | 330 | 322 | 68.5 |
| B | 0 | 189 | 38647 | 585.7 | 326 | 318 | 65.4 |
| B | 4 | 216 | 8503 | 125.07 | 326 | 318 | 65.4 |
| B | 12 | 111 | 7453 | 109.03 | 326 | 318 | 65.4 |
| C | 14 | 238 | 48614 | 645.88 | 310 | 312 | 74.8 |
| C | 5 | 218 | 15718 | 206.0 | 310 | 312 | 74.8 |
| C | 5 | 219 | 3479 | 42.35 | 310 | 312 | 74.8 |
| D | 10 | 70 | 151170 | 1945.4 | 308 | 297 | 77.6 |
| D | 13 | 232 | 52999 | 679.55 | 308 | 297 | 77.6 |
| D | 7 | 238 | 36366 | 465.08 | 308 | 297 | 77.6 |
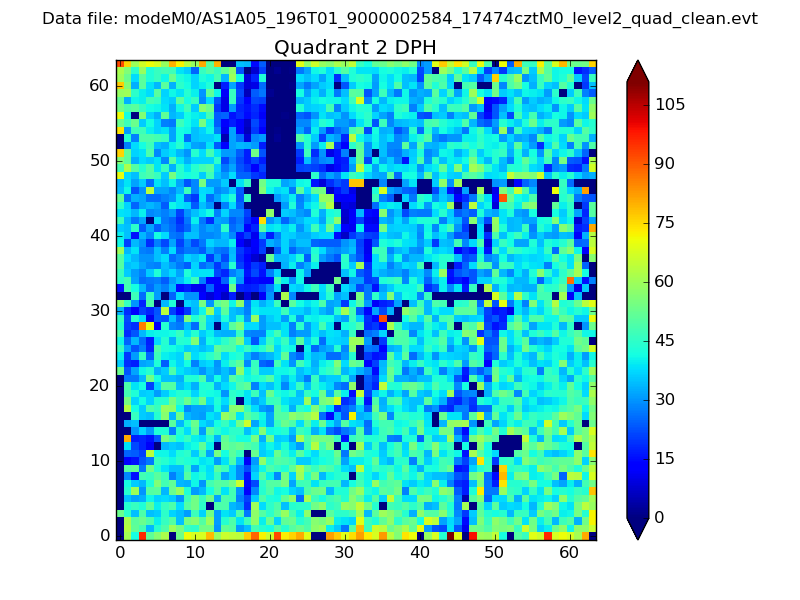
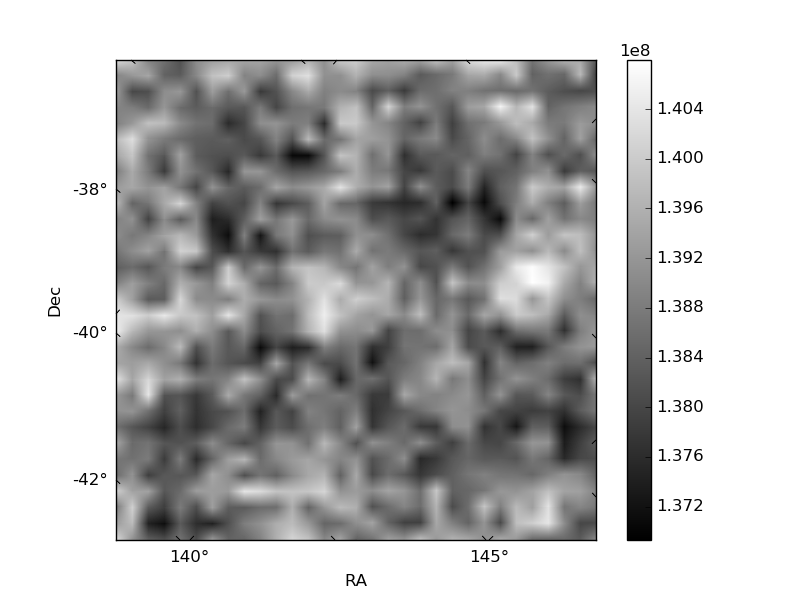
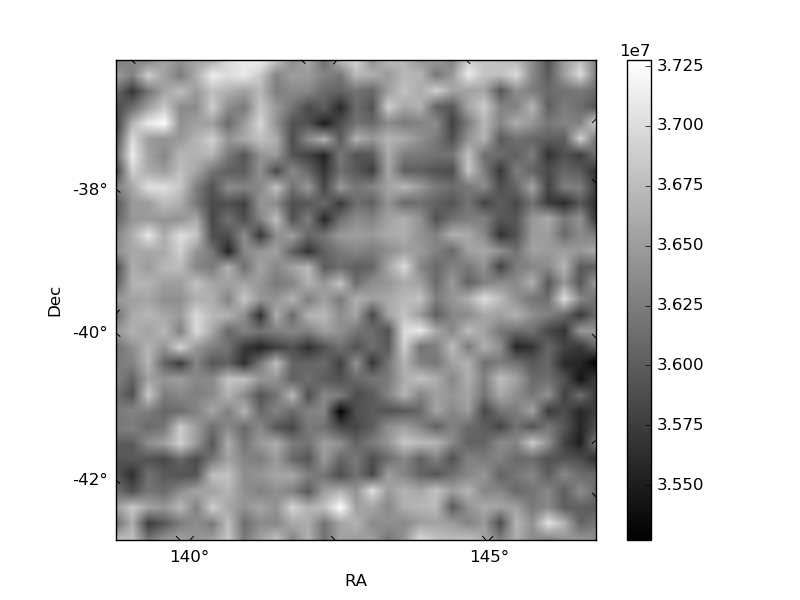
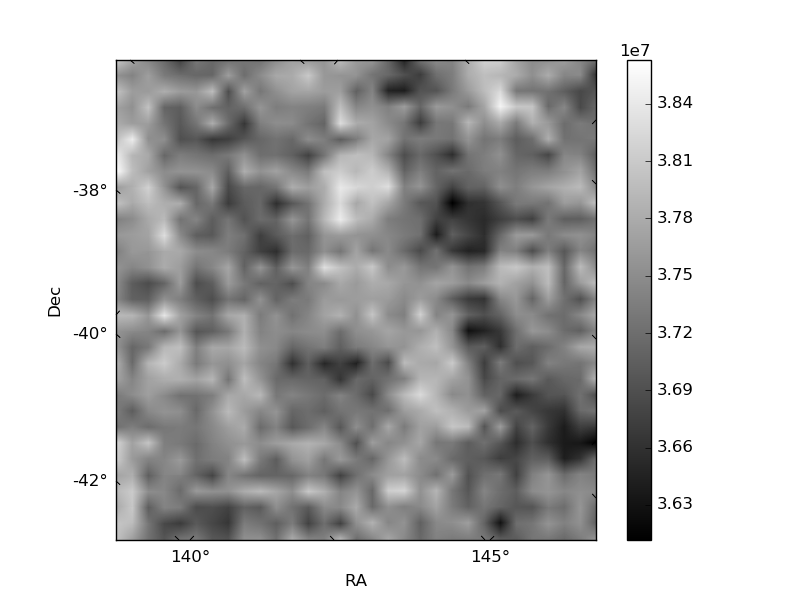
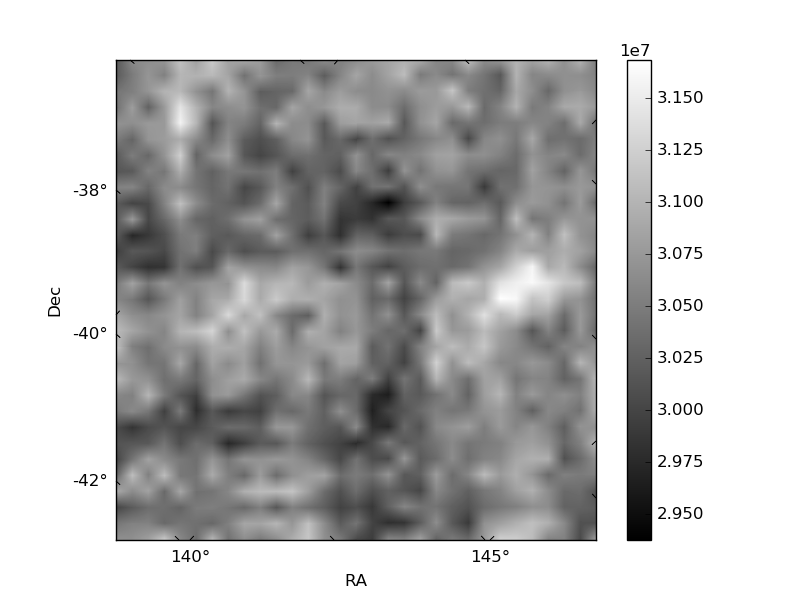
Histogram calculated using DETX and DETY for each event in the final _common_clean file
| Quadrant A | 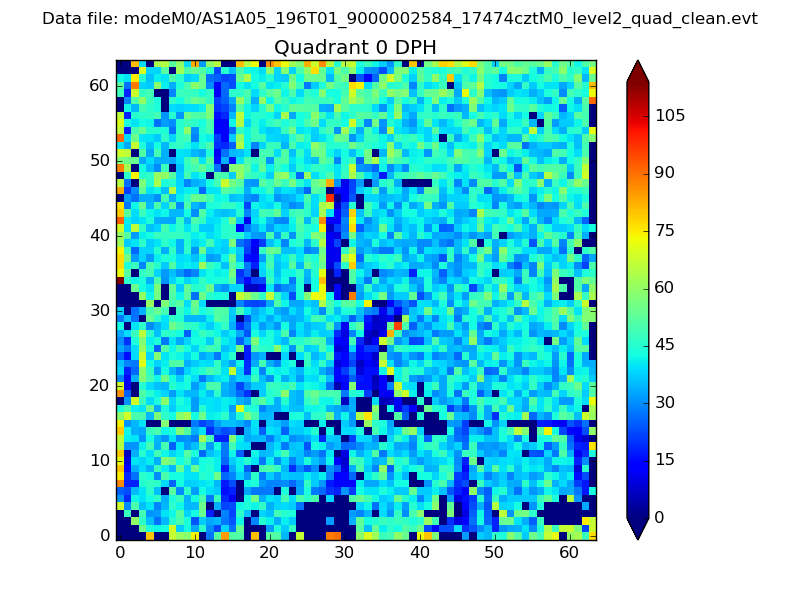 |
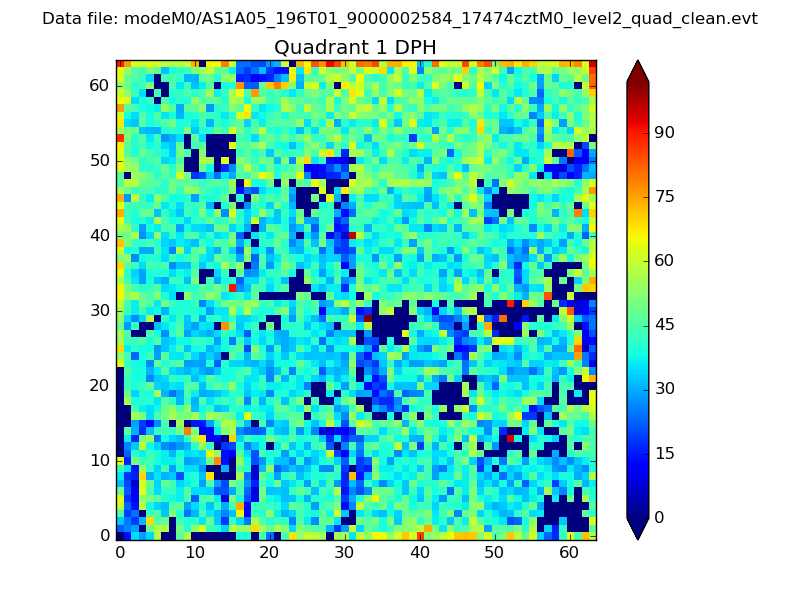 |
Quadrant B |
|---|---|---|---|
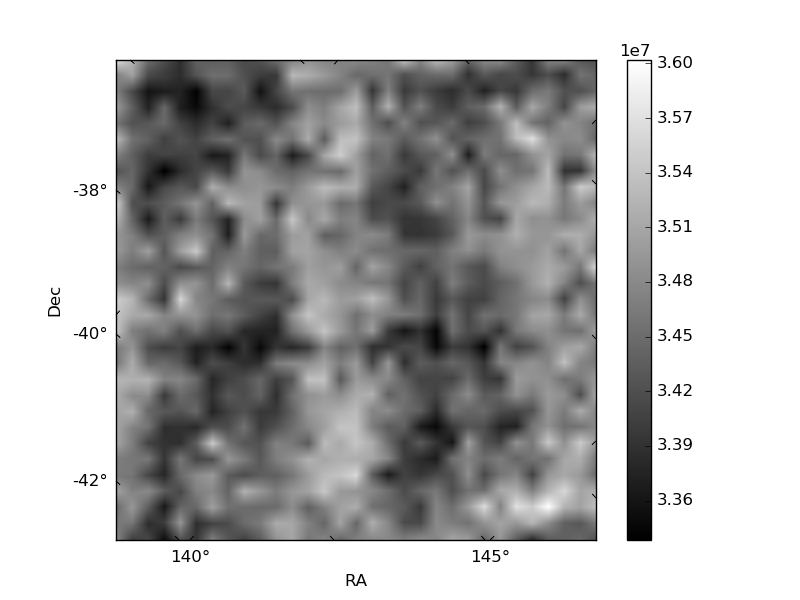
| Quadrant D | 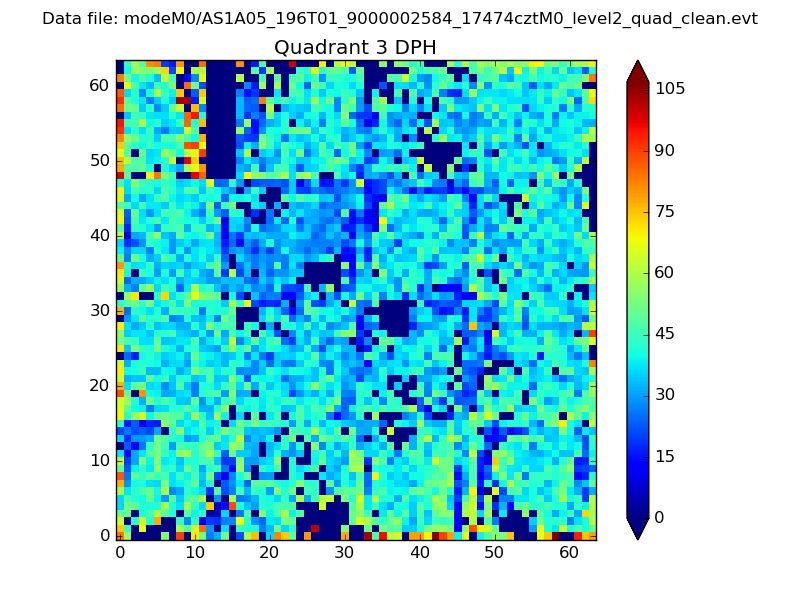 |
 |
Quadrant C |
| Plot type | Count rate plots | Images |
|---|---|---|
| Comparison with Poisson distribution Blue bars denote a histogram of data divided into 1 sec bins. Red curve is a Poisson curve with rate = median count rate of data. |
 |
 |
| Quadrant-wise count rates Data is divided into 100 sec bins |
 |
|
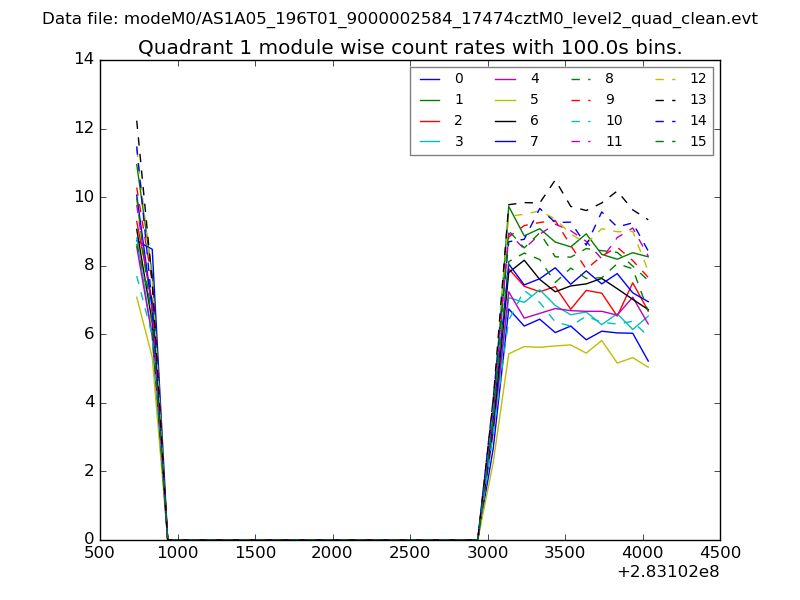
| Module-wise count rates for Quadrant A Data is divided into 100 sec bins |
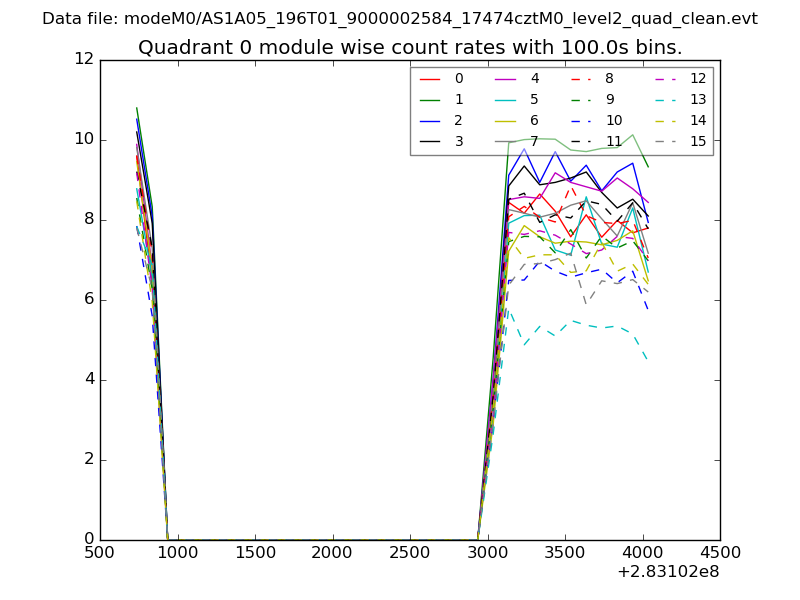 |
 |
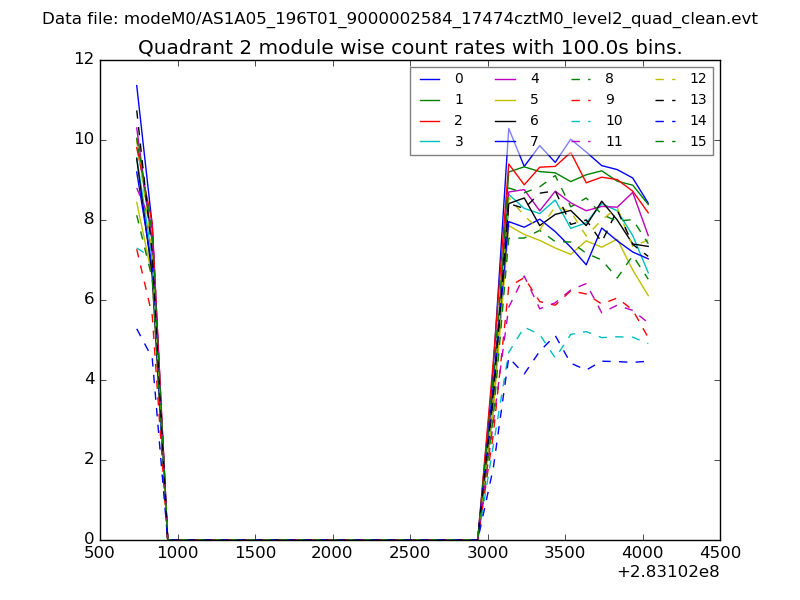
| Module-wise count rates for Quadrant B Data is divided into 100 sec bins |
 |
 |
| Module-wise count rates for Quadrant C Data is divided into 100 sec bins |
 |
 |
| Module-wise count rates for Quadrant D Data is divided into 100 sec bins |
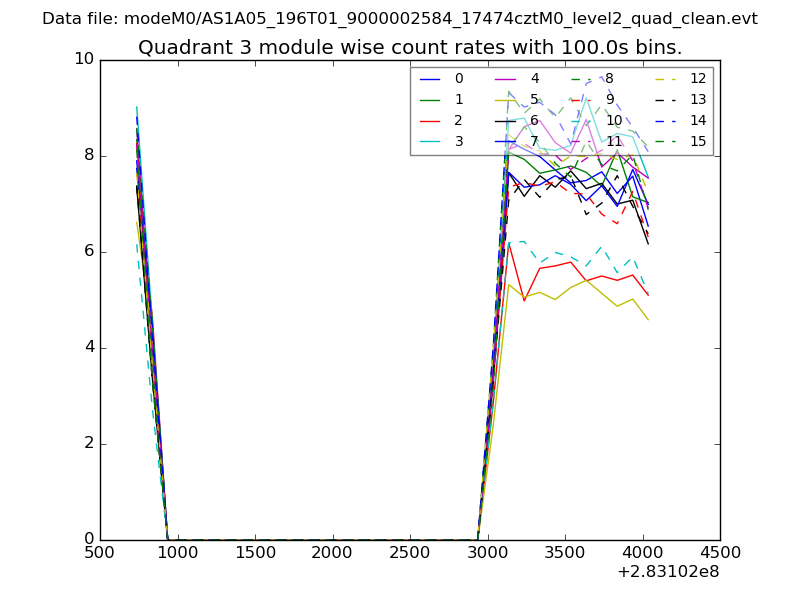 |
 |
| Parameter | Plot |
|---|---|
| CZT HV Monitor | 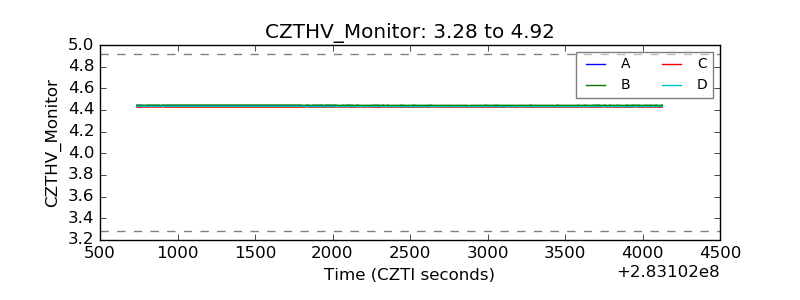 |
| D_VDD | 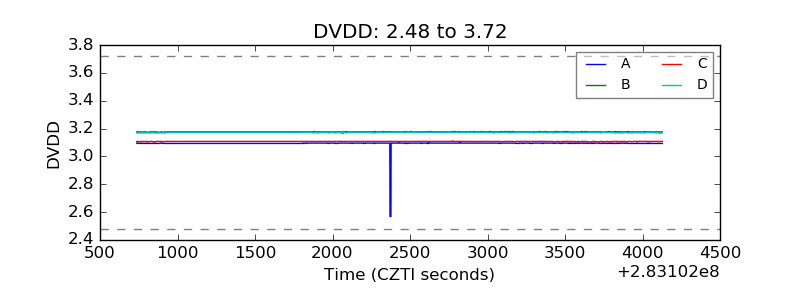 |
| Temperature 1 |  |
| Veto HV Monitor | 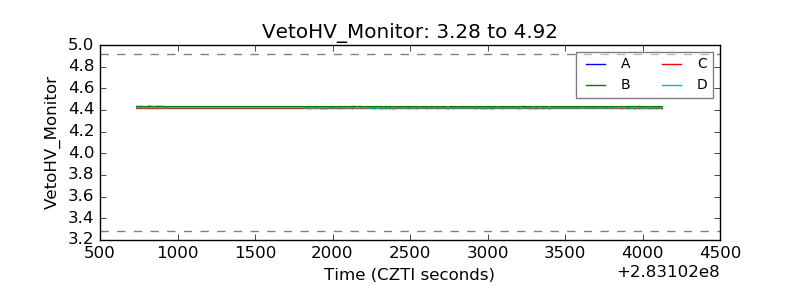 |
| Veto LLD | 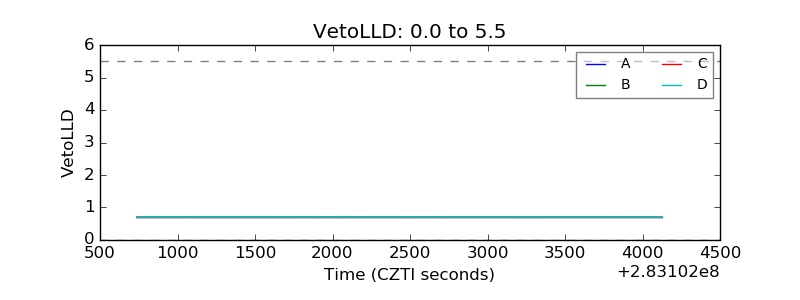 |
| Alpha Counter | 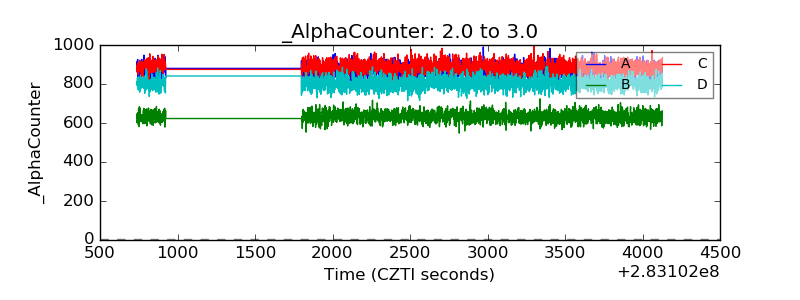 |
| _CPM_Rate |  |
| CZT Counter | 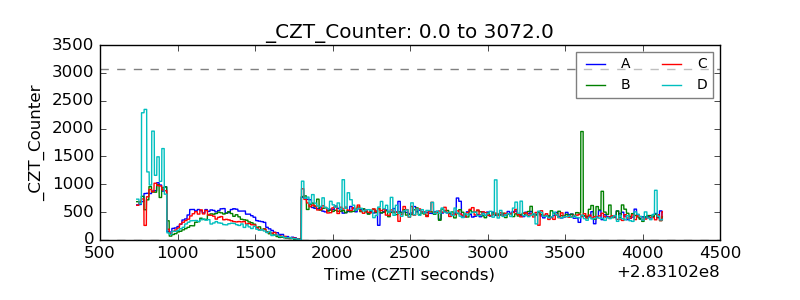 |
| +2.5 Volts monitor |  |
| +5 Volts monitor | 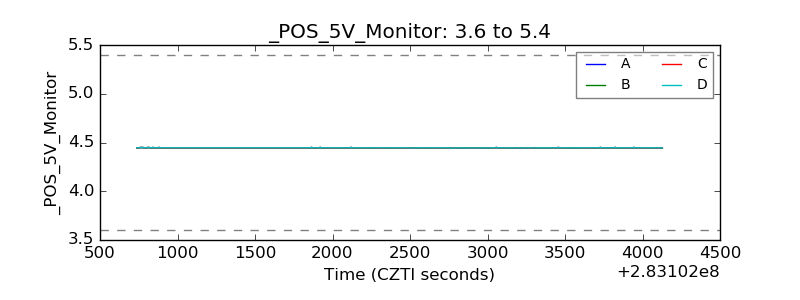 |
| _ROLL_ROT | 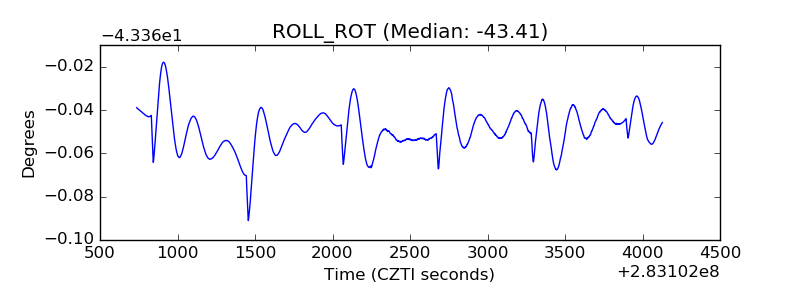 |
| _Roll_DEC | 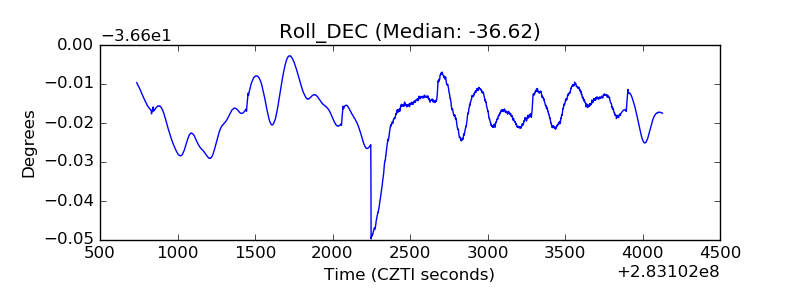 |
| _Roll_RA | 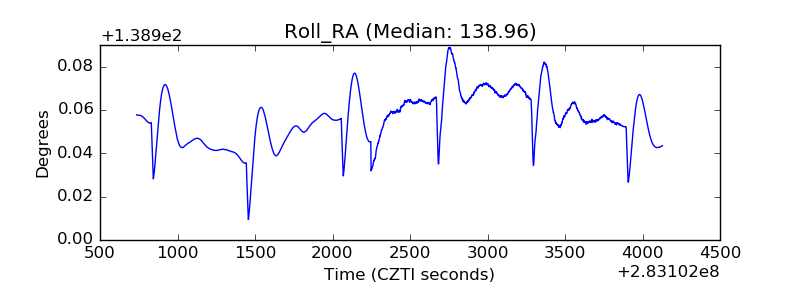 |
| Veto Counter | 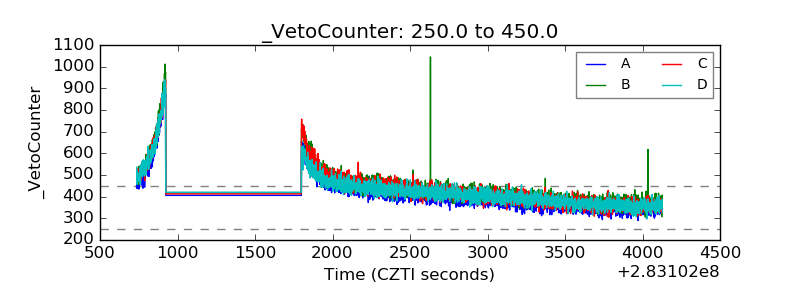 |