| Param | Original file | Final file |
|---|---|---|
| Filename | modeM0/AS1A05_198T01_9000002586cztM0_level2.fits | modeM0/AS1A05_198T01_9000002586cztM0_level2_quad_clean.evt |
| Size (bytes) | 290,715,840 | 268,842,240 |
| Size | 277.2 MB | 256.4 MB |
| Events in quadrant A | 1,764,468 | 1,565,581 |
| Events in quadrant B | 1,699,990 | 1,576,941 |
| Events in quadrant C | 1,723,580 | 1,507,419 |
| Events in quadrant D | 1,480,552 | 1,355,883 |
| Mode SS | |||
|---|---|---|---|
| Quadrant | BADHDUFLAG | Total packets | Discarded packets |
| A | 0 | 632 | 0 |
| B | 0 | 632 | 0 |
| C | 0 | 632 | 0 |
| D | 0 | 632 | 0 |
| Mode M0 | |||
|---|---|---|---|
| Quadrant | BADHDUFLAG | Total packets | Discarded packets |
| A | 0 | 68922 | 0 |
| B | 0 | 66446 | 0 |
| C | 0 | 63656 | 0 |
| D | 0 | 84478 | 0 |
| Mode M9 | |||
|---|---|---|---|
| Quadrant | BADHDUFLAG | Total packets | Discarded packets |
| A | 0 | 21 | 0 |
| B | 0 | 21 | 0 |
| C | 0 | 21 | 0 |
| D | 0 | 21 | 0 |
| Quadrant | Total seconds | Saturated seconds | Saturation percentage |
|---|---|---|---|
| A | 31070 | 570 | 1.834567% |
| B | 31070 | 342 | 1.100740% |
| C | 31070 | 314 | 1.010621% |
| D | 31070 | 1465 | 4.715159% |
Noise dominated data is calculated using 1-second bins in cleaned event files. If a bin has >2000 counts, and if more than 50% of those come from <1% of pixels, then it is considered to be noise-dominated and hence unusable.
| Quadrant | # 1 sec bins | Bins with >0 counts | Bins with >2000 counts | High rate bins dominated by noise | Noise dominated (total time) | Noise dominated (detector-on time) | Marked lightcurve |
|---|---|---|---|---|---|---|---|
| A | 33150 | 31070 | 0 | 0 | 0.00% | 0.00% | 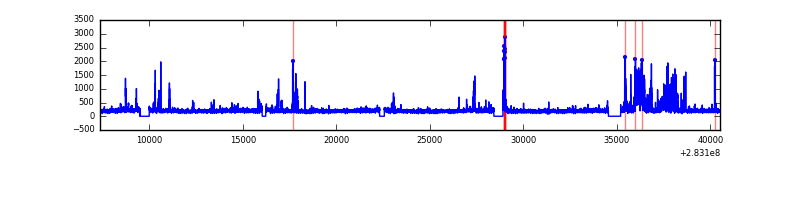 |
| B | 33150 | 31070 | 0 | 0 | 0.00% | 0.00% |  |
| C | 33150 | 31071 | 0 | 0 | 0.00% | 0.00% |  |
| D | 33150 | 31058 | 0 | 0 | 0.00% | 0.00% |  |
Top three noisy pixels from each quadrant. If the there are fewer than three noisy pixels in the level2.evt file, extra rows are filled as -1
| Pixel properties | Quadrant properties | ||||||
|---|---|---|---|---|---|---|---|
| Quadrant | DetID | PixID | Counts | Sigma | Mean | Median | Sigma |
| A | 0 | 29 | 1653 | 10.53 | 458 | 427 | 116.4 |
| A | 7 | 110 | 1474 | 9.0 | 458 | 427 | 116.4 |
| A | 0 | 30 | 1346 | 7.9 | 458 | 427 | 116.4 |
| B | 2 | 9 | 1386 | 10.5 | 448 | 426 | 91.4 |
| B | 3 | 17 | 1157 | 7.99 | 448 | 426 | 91.4 |
| B | 2 | 8 | 1138 | 7.79 | 448 | 426 | 91.4 |
| C | 1 | 81 | 1290 | 7.37 | 454 | 421 | 117.9 |
| C | 1 | 80 | 1270 | 7.2 | 454 | 421 | 117.9 |
| C | 12 | 241 | 1262 | 7.13 | 454 | 421 | 117.9 |
| D | 6 | 231 | 1067 | 6.09 | 422 | 383 | 112.3 |
| D | 3 | 14 | 1046 | 5.9 | 422 | 383 | 112.3 |
| D | 6 | 67 | 1031 | 5.77 | 422 | 383 | 112.3 |
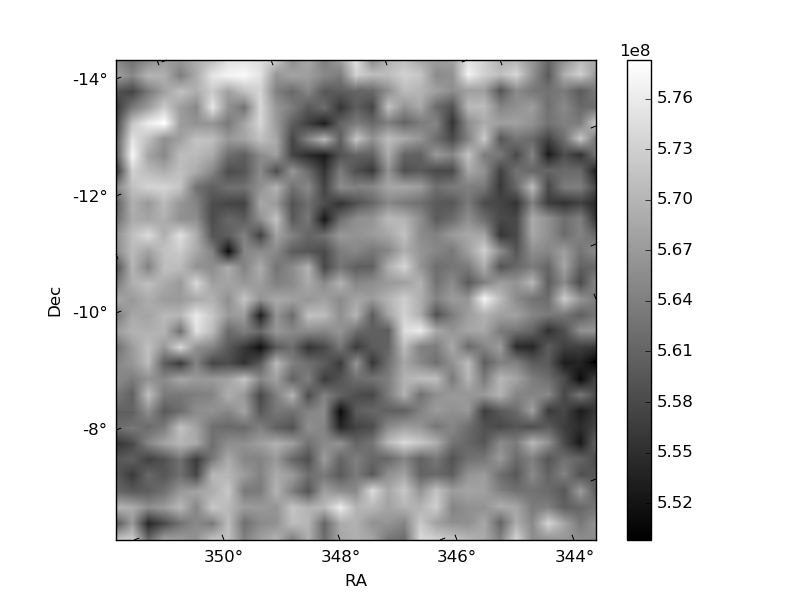
Histogram calculated using DETX and DETY for each event in the final _common_clean file
| Quadrant A | 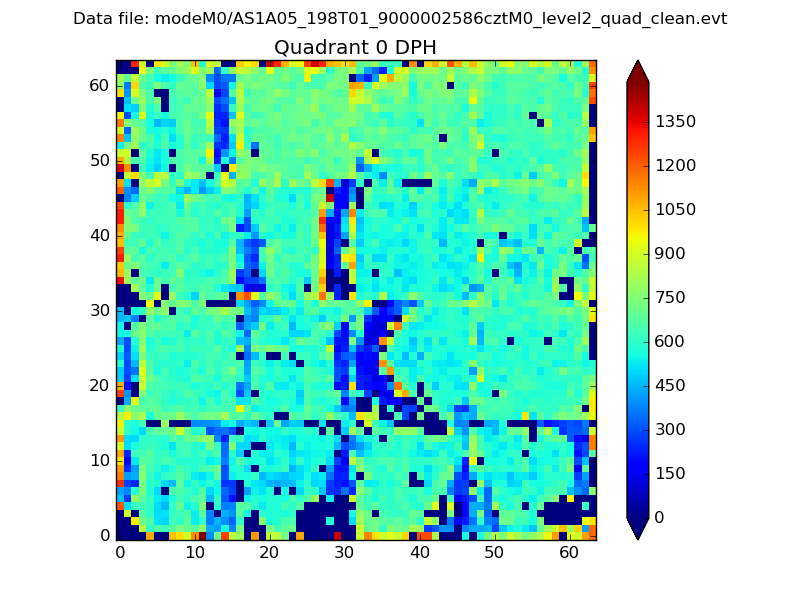 |
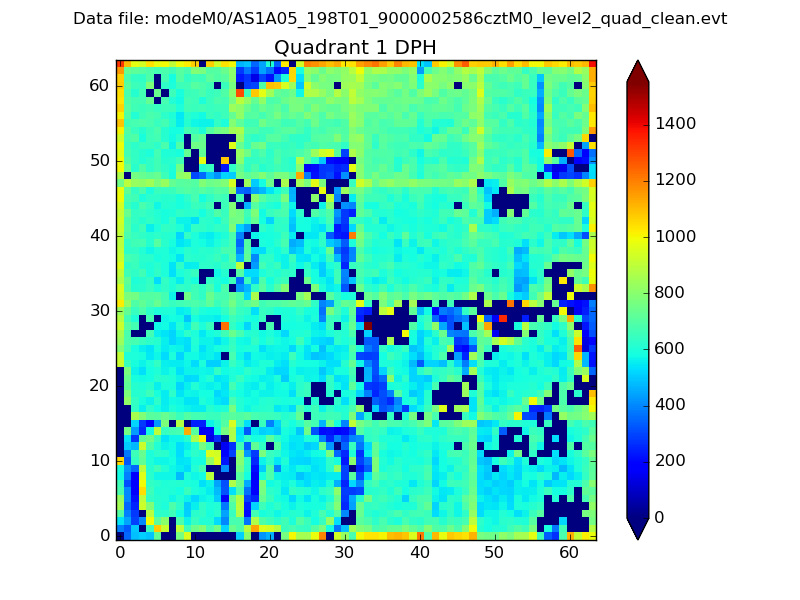 |
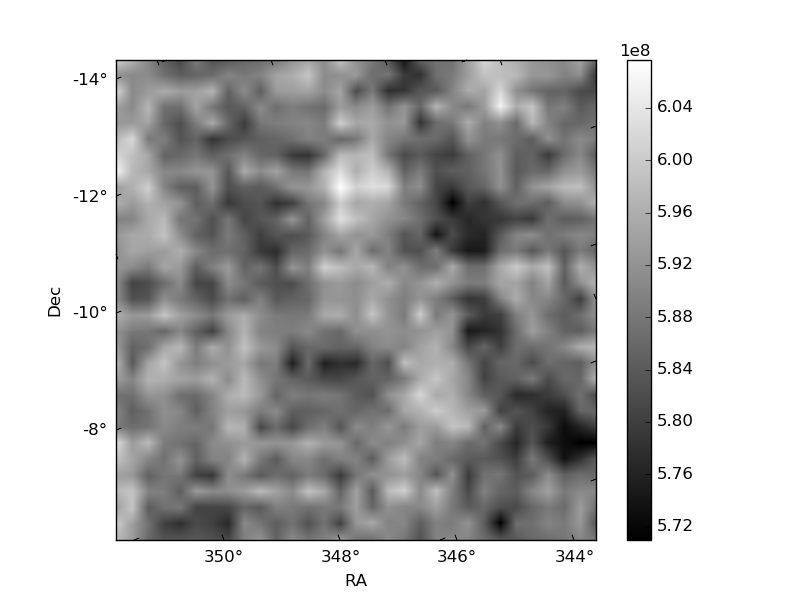
Quadrant B |
|---|---|---|---|
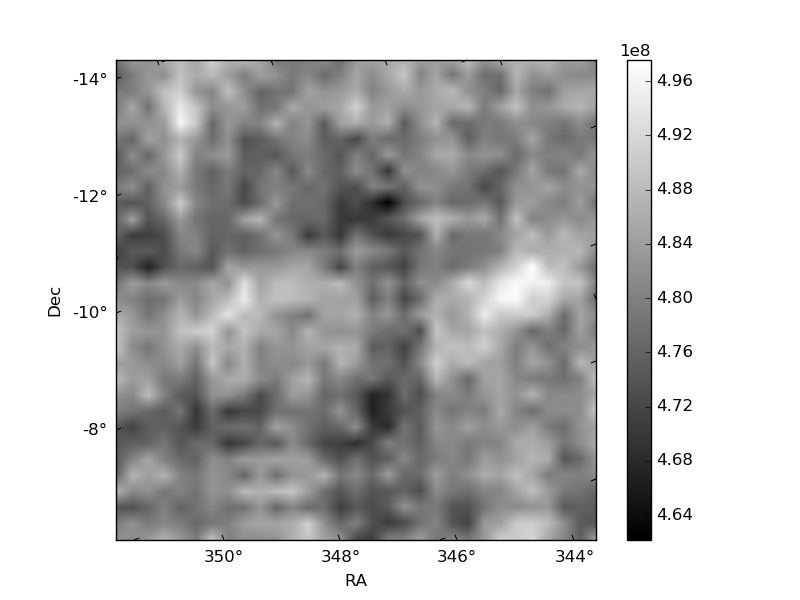
| Quadrant D |  |
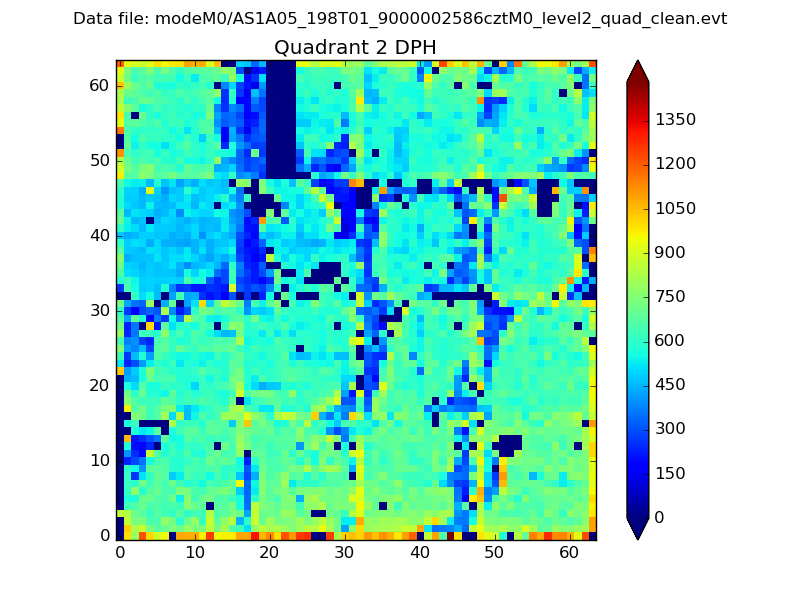 |
Quadrant C |
| Plot type | Count rate plots | Images |
|---|---|---|
| Comparison with Poisson distribution Blue bars denote a histogram of data divided into 1 sec bins. Red curve is a Poisson curve with rate = median count rate of data. |
 |
 |
| Quadrant-wise count rates Data is divided into 100 sec bins |
 |
|
| Module-wise count rates for Quadrant A Data is divided into 100 sec bins |
 |
 |
| Module-wise count rates for Quadrant B Data is divided into 100 sec bins |
 |
 |
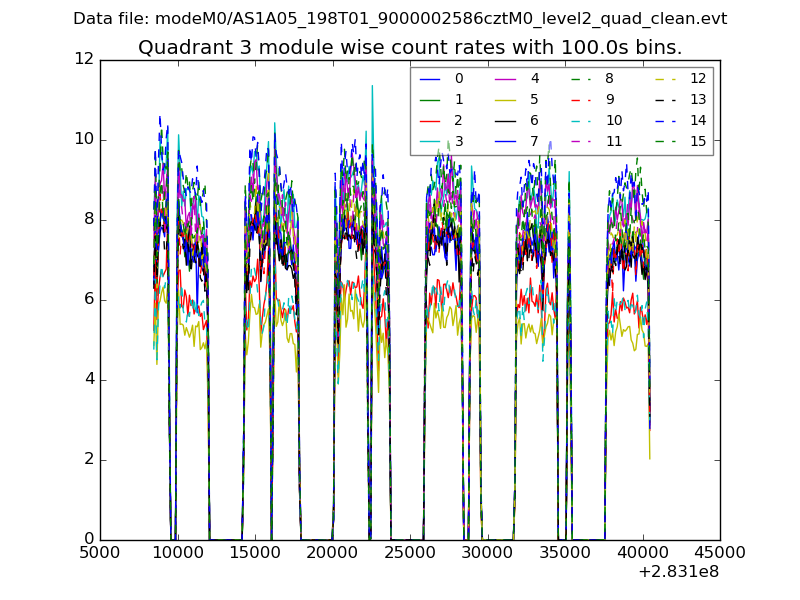
| Module-wise count rates for Quadrant C Data is divided into 100 sec bins |
 |
 |
| Module-wise count rates for Quadrant D Data is divided into 100 sec bins |
 |
 |
| Parameter | Plot |
|---|---|
| CZT HV Monitor |  |
| D_VDD |  |
| Temperature 1 |  |
| Veto HV Monitor |  |
| Veto LLD | 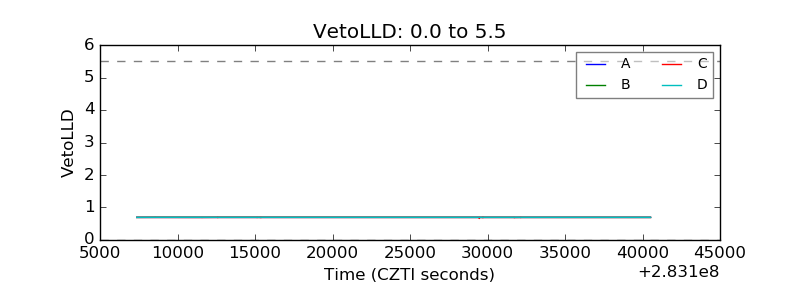 |
| Alpha Counter |  |
| _CPM_Rate |  |
| CZT Counter |  |
| +2.5 Volts monitor | 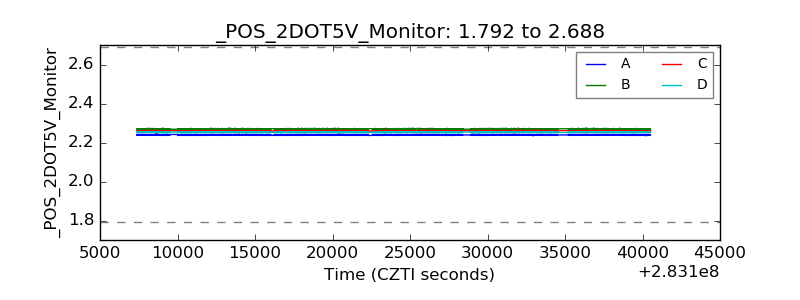 |
| +5 Volts monitor |  |
| _ROLL_ROT |  |
| _Roll_DEC |  |
| _Roll_RA | 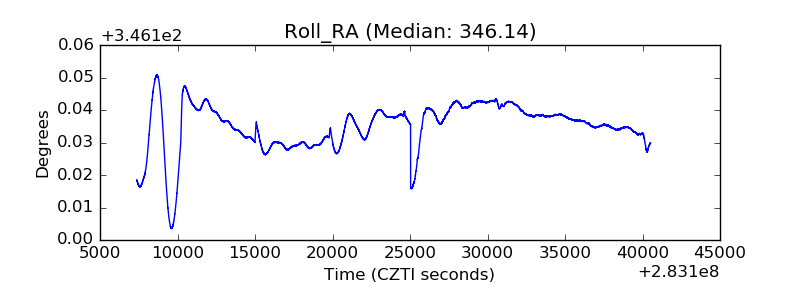 |
| Veto Counter |  |