| Param | Original file | Final file |
|---|---|---|
| Filename | modeM0/AS1A05_198T01_9000002586_17476cztM0_level2.evt | modeM0/AS1A05_198T01_9000002586_17476cztM0_level2_quad_clean.evt |
| Size (bytes) | 598,665,600 | 104,227,200 |
| Size | 570.9 MB | 99.4 MB |
| Events in quadrant A | 3,874,118 | 665,790 |
| Events in quadrant B | 4,126,514 | 669,261 |
| Events in quadrant C | 3,866,402 | 647,519 |
| Events in quadrant D | 5,725,337 | 621,923 |
| Mode SS | |||
|---|---|---|---|
| Quadrant | BADHDUFLAG | Total packets | Discarded packets |
| A | 0 | 164 | 0 |
| B | 0 | 164 | 0 |
| C | 0 | 164 | 0 |
| D | 0 | 164 | 0 |
| Mode M0 | |||
|---|---|---|---|
| Quadrant | BADHDUFLAG | Total packets | Discarded packets |
| A | 0 | 16832 | 2 |
| B | 0 | 17420 | 2 |
| C | 0 | 16459 | 2 |
| D | 0 | 22320 | 2 |
| Mode M9 | |||
|---|---|---|---|
| Quadrant | BADHDUFLAG | Total packets | Discarded packets |
| A | 0 | 4 | 0 |
| B | 0 | 4 | 0 |
| C | 0 | 4 | 0 |
| D | 0 | 4 | 0 |
| Quadrant | Total seconds | Saturated seconds | Saturation percentage |
|---|---|---|---|
| A | 7933 | 96 | 1.210135% |
| B | 7934 | 192 | 2.419965% |
| C | 7934 | 129 | 1.625914% |
| D | 7934 | 475 | 5.986892% |
Noise dominated data is calculated using 1-second bins in cleaned event files. If a bin has >2000 counts, and if more than 50% of those come from <1% of pixels, then it is considered to be noise-dominated and hence unusable.
| Quadrant | # 1 sec bins | Bins with >0 counts | Bins with >2000 counts | High rate bins dominated by noise | Noise dominated (total time) | Noise dominated (detector-on time) | Marked lightcurve |
|---|---|---|---|---|---|---|---|
| A | 8383 | 7935 | 14 | 14 | 0.17% | 0.18% | 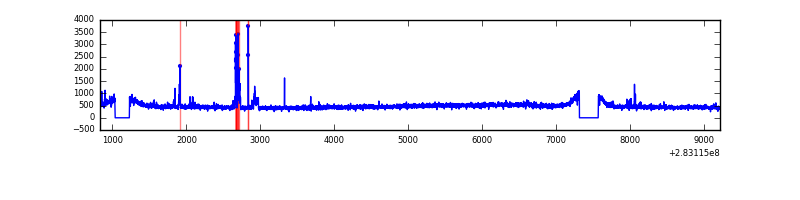 |
| B | 8384 | 7936 | 21 | 21 | 0.25% | 0.26% | 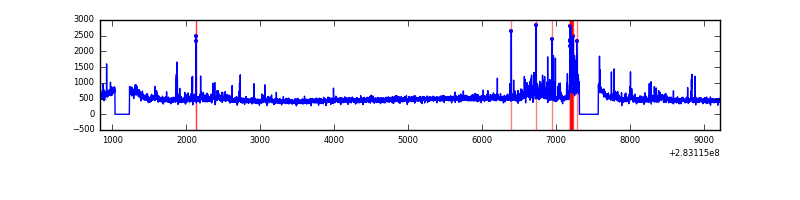 |
| C | 8384 | 7936 | 0 | 0 | 0.00% | 0.00% | 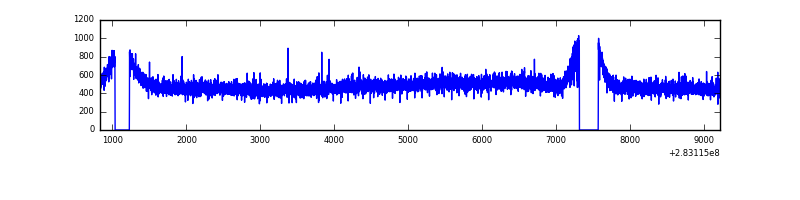 |
| D | 8384 | 7936 | 331 | 331 | 3.95% | 4.17% | 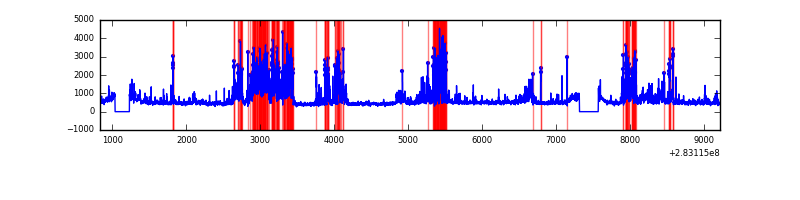 |
Top three noisy pixels from each quadrant. If the there are fewer than three noisy pixels in the level2.evt file, extra rows are filled as -1
| Pixel properties | Quadrant properties | ||||||
|---|---|---|---|---|---|---|---|
| Quadrant | DetID | PixID | Counts | Sigma | Mean | Median | Sigma |
| A | 15 | 174 | 149555 | 755.92 | 964 | 943 | 196.6 |
| A | 13 | 210 | 9318 | 42.6 | 964 | 943 | 196.6 |
| A | 0 | 226 | 8352 | 37.69 | 964 | 943 | 196.6 |
| B | 7 | 220 | 158366 | 850.35 | 962 | 938 | 185.1 |
| B | 0 | 189 | 49003 | 259.62 | 962 | 938 | 185.1 |
| B | 15 | 35 | 33469 | 175.72 | 962 | 938 | 185.1 |
| C | 14 | 238 | 141010 | 646.4 | 923 | 928 | 216.7 |
| C | 5 | 218 | 87385 | 398.95 | 923 | 928 | 216.7 |
| C | 5 | 219 | 21476 | 94.82 | 923 | 928 | 216.7 |
| D | 13 | 189 | 978769 | 4320.37 | 921 | 891 | 226.3 |
| D | 10 | 70 | 588672 | 2596.88 | 921 | 891 | 226.3 |
| D | 7 | 238 | 508349 | 2242.0 | 921 | 891 | 226.3 |
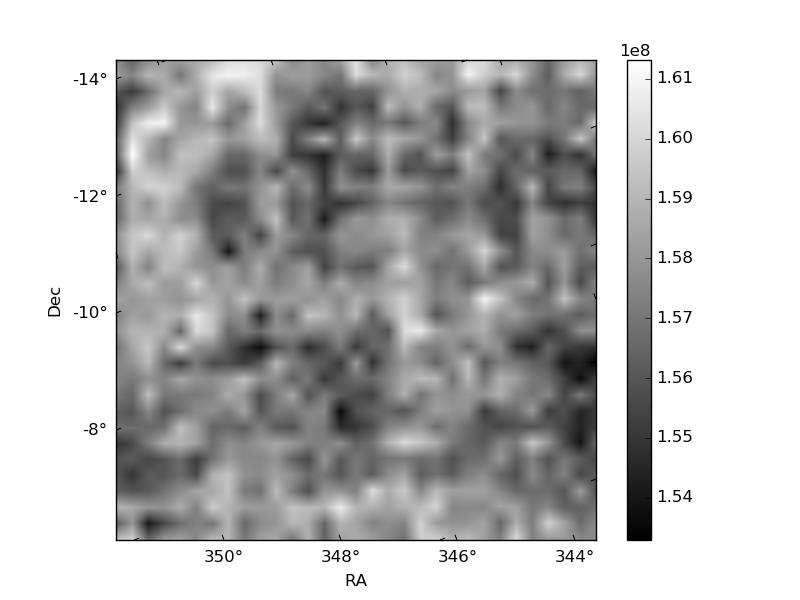
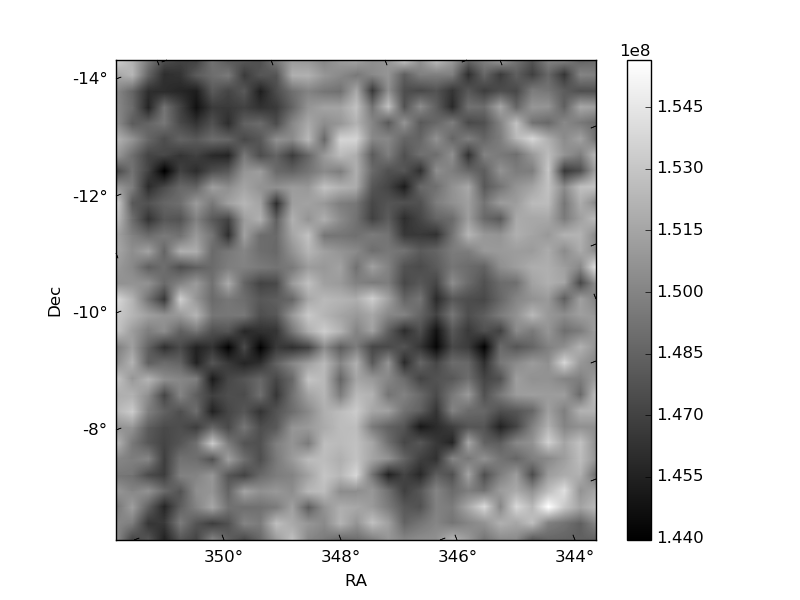
Histogram calculated using DETX and DETY for each event in the final _common_clean file
| Quadrant A | 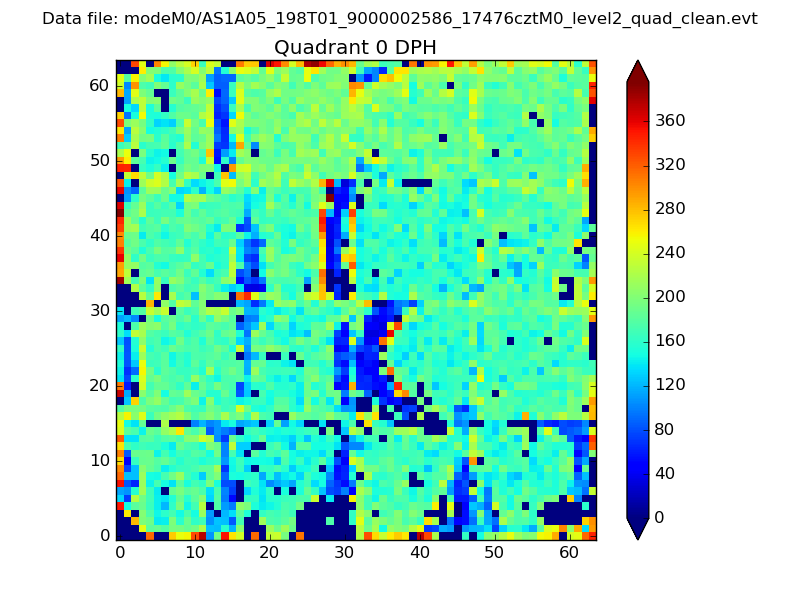 |
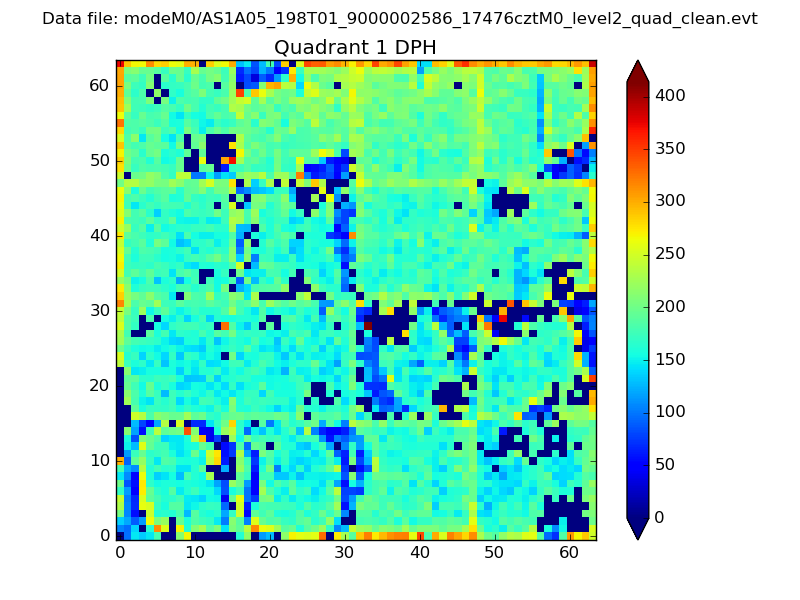 |
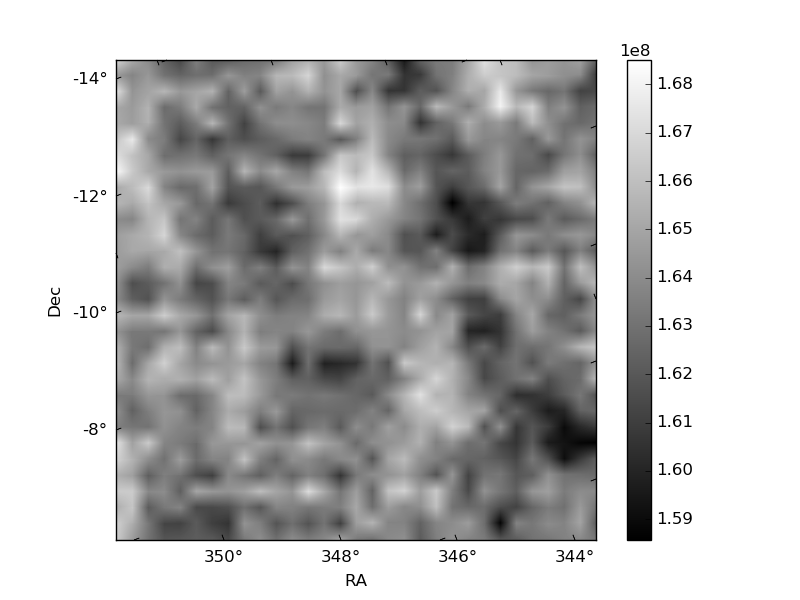
Quadrant B |
|---|---|---|---|
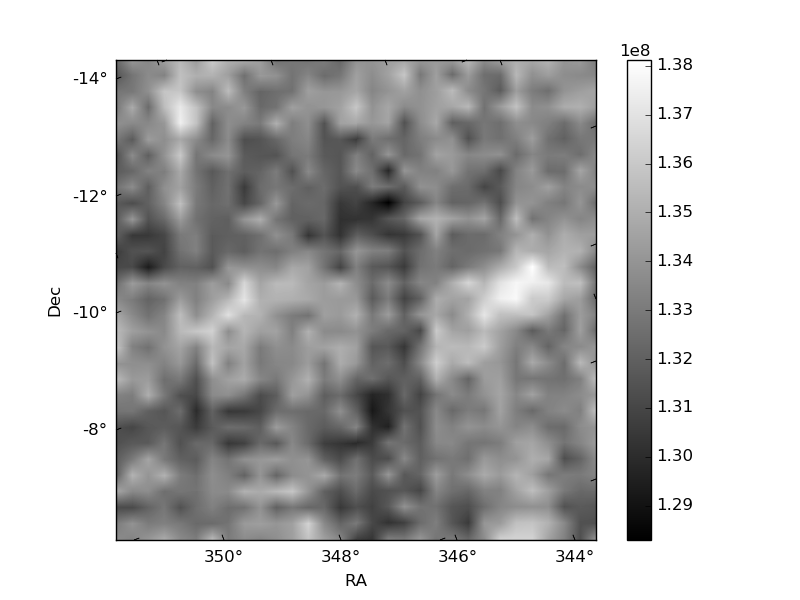
| Quadrant D |  |
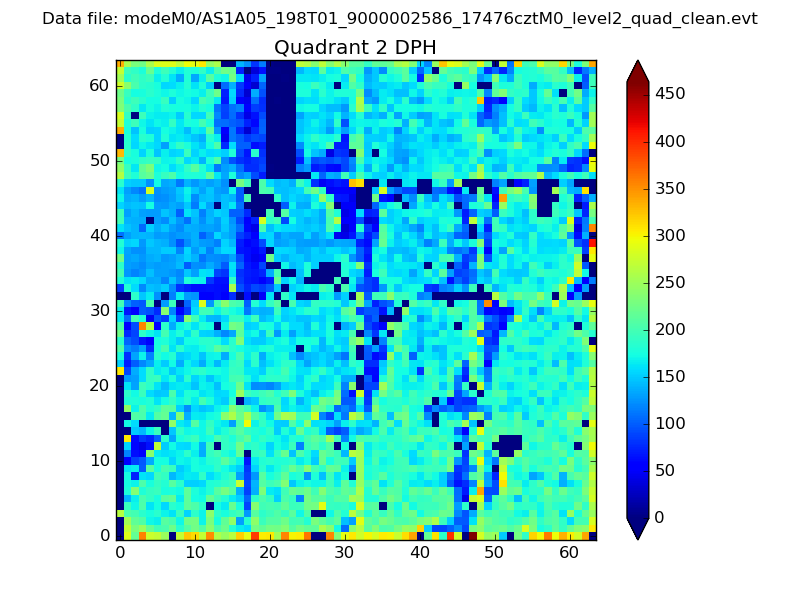 |
Quadrant C |
| Plot type | Count rate plots | Images |
|---|---|---|
| Comparison with Poisson distribution Blue bars denote a histogram of data divided into 1 sec bins. Red curve is a Poisson curve with rate = median count rate of data. |
 |
 |
| Quadrant-wise count rates Data is divided into 100 sec bins |
 |
|
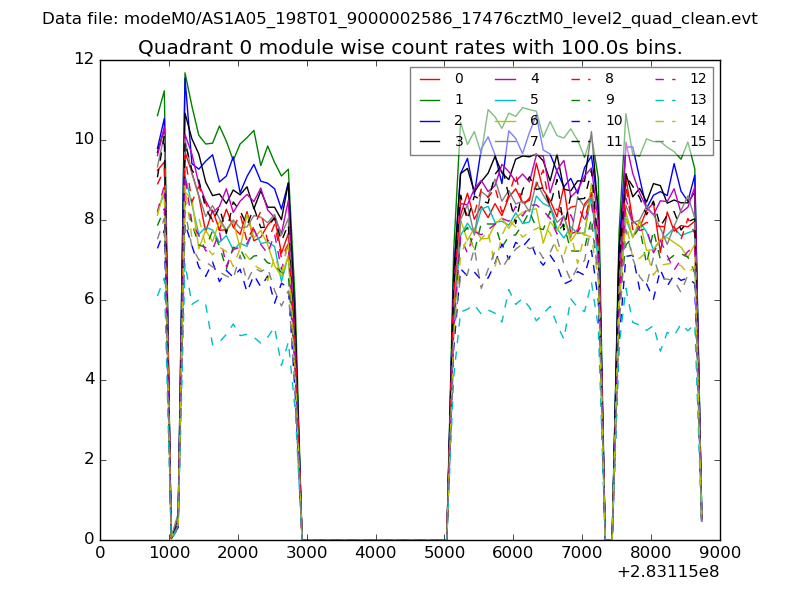
| Module-wise count rates for Quadrant A Data is divided into 100 sec bins |
 |
 |
| Module-wise count rates for Quadrant B Data is divided into 100 sec bins |
 |
 |
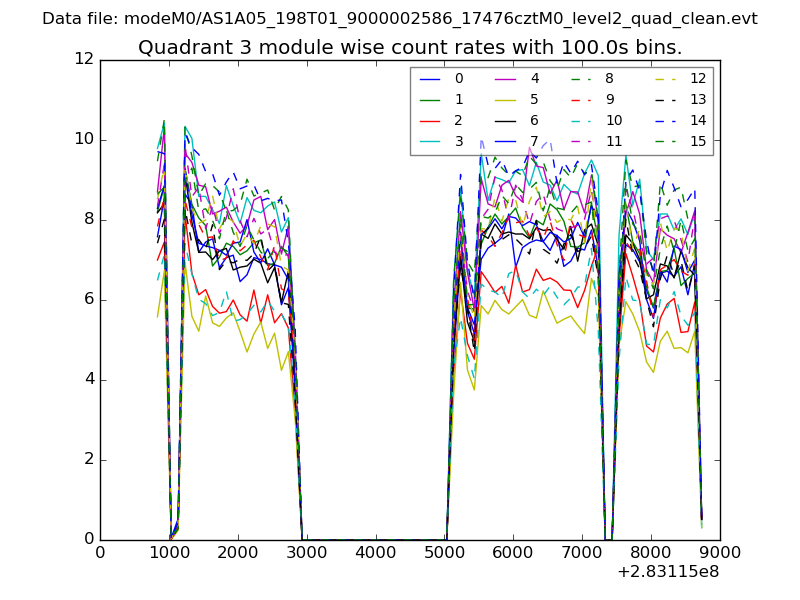
| Module-wise count rates for Quadrant C Data is divided into 100 sec bins |
 |
 |
| Module-wise count rates for Quadrant D Data is divided into 100 sec bins |
 |
 |
| Parameter | Plot |
|---|---|
| CZT HV Monitor | 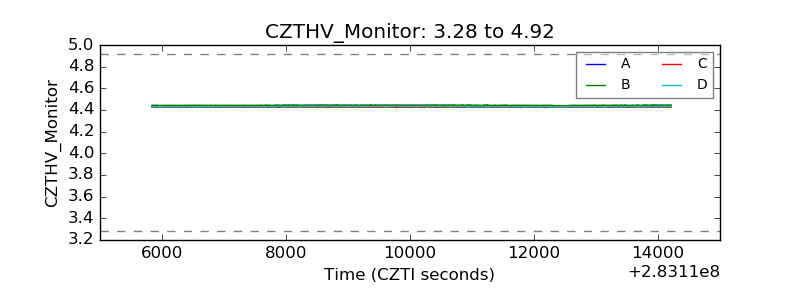 |
| D_VDD | 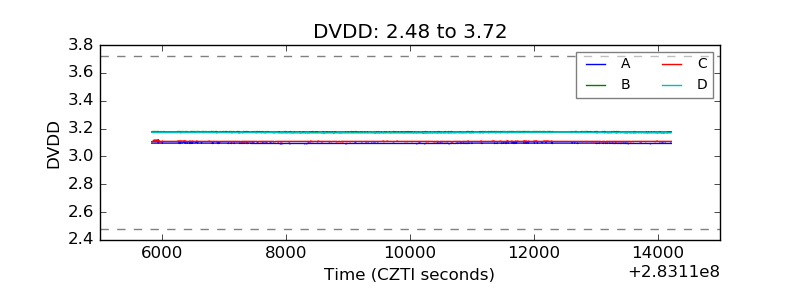 |
| Temperature 1 | 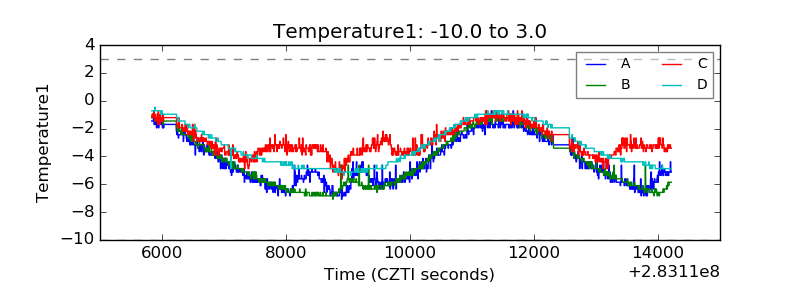 |
| Veto HV Monitor |  |
| Veto LLD | 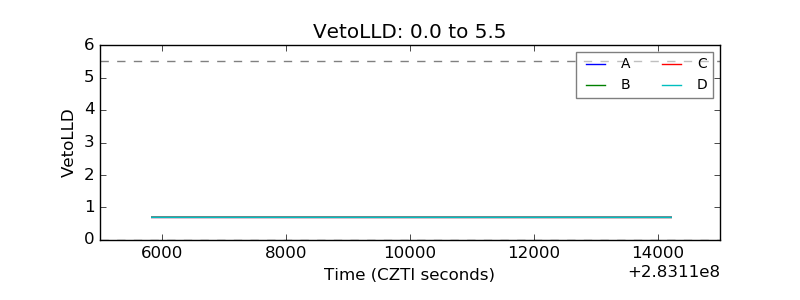 |
| Alpha Counter |  |
| _CPM_Rate |  |
| CZT Counter |  |
| +2.5 Volts monitor | 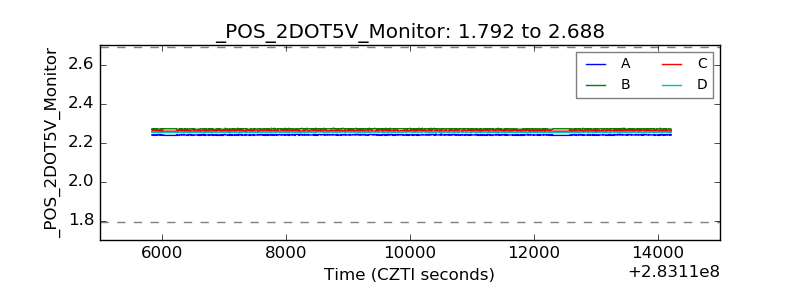 |
| +5 Volts monitor |  |
| _ROLL_ROT | 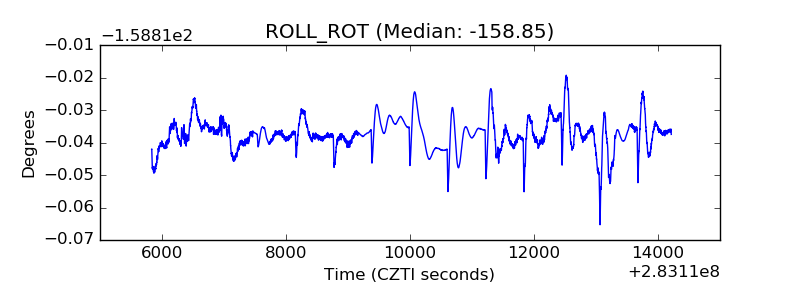 |
| _Roll_DEC | 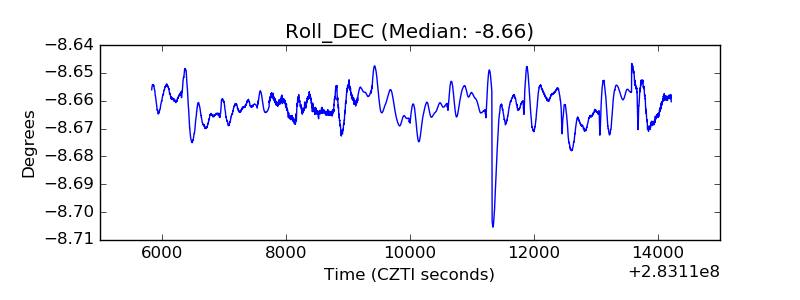 |
| _Roll_RA |  |
| Veto Counter | 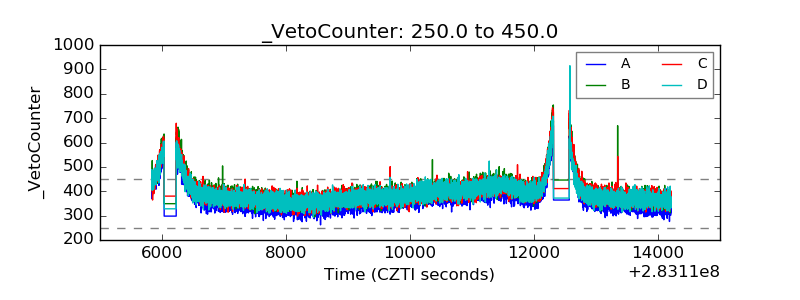 |