| Param | Original file | Final file |
|---|---|---|
| Filename | modeM0/AS1A05_198T01_9000002586_17478cztM0_level2.evt | modeM0/AS1A05_198T01_9000002586_17478cztM0_level2_quad_clean.evt |
| Size (bytes) | 855,659,520 | 141,644,160 |
| Size | 816.0 MB | 135.1 MB |
| Events in quadrant A | 5,772,342 | 878,220 |
| Events in quadrant B | 5,921,312 | 888,936 |
| Events in quadrant C | 5,686,572 | 856,557 |
| Events in quadrant D | 7,722,681 | 837,885 |
| Mode SS | |||
|---|---|---|---|
| Quadrant | BADHDUFLAG | Total packets | Discarded packets |
| A | 0 | 242 | 0 |
| B | 0 | 242 | 0 |
| C | 0 | 242 | 0 |
| D | 0 | 242 | 0 |
| Mode M0 | |||
|---|---|---|---|
| Quadrant | BADHDUFLAG | Total packets | Discarded packets |
| A | 0 | 25157 | 2 |
| B | 0 | 25246 | 2 |
| C | 0 | 24335 | 2 |
| D | 0 | 30798 | 2 |
| Mode M9 | |||
|---|---|---|---|
| Quadrant | BADHDUFLAG | Total packets | Discarded packets |
| A | 0 | 12 | 0 |
| B | 0 | 12 | 0 |
| C | 0 | 12 | 0 |
| D | 0 | 12 | 0 |
| Quadrant | Total seconds | Saturated seconds | Saturation percentage |
|---|---|---|---|
| A | 11980 | 114 | 0.951586% |
| B | 11981 | 98 | 0.817962% |
| C | 11981 | 103 | 0.859695% |
| D | 11981 | 500 | 4.173274% |
Noise dominated data is calculated using 1-second bins in cleaned event files. If a bin has >2000 counts, and if more than 50% of those come from <1% of pixels, then it is considered to be noise-dominated and hence unusable.
| Quadrant | # 1 sec bins | Bins with >0 counts | Bins with >2000 counts | High rate bins dominated by noise | Noise dominated (total time) | Noise dominated (detector-on time) | Marked lightcurve |
|---|---|---|---|---|---|---|---|
| A | 13120 | 11982 | 34 | 34 | 0.26% | 0.28% | 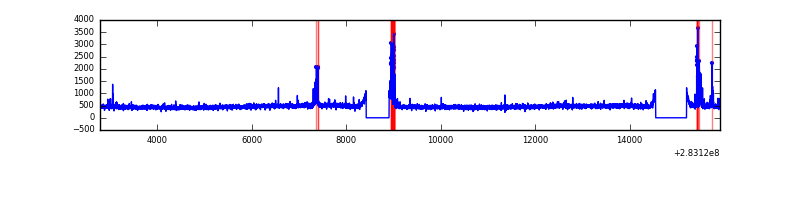 |
| B | 13121 | 11983 | 4 | 4 | 0.03% | 0.03% | 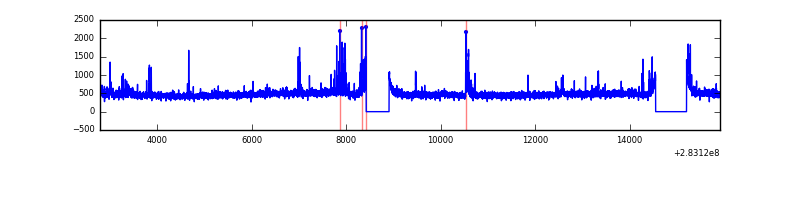 |
| C | 13121 | 11983 | 0 | 0 | 0.00% | 0.00% | 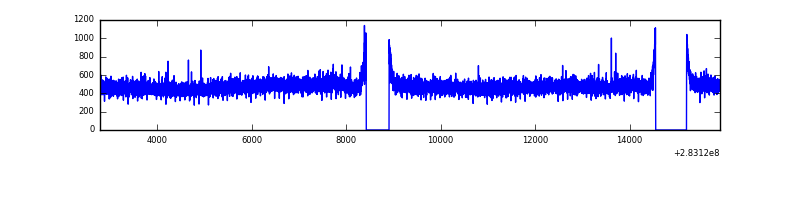 |
| D | 13121 | 11983 | 371 | 371 | 2.83% | 3.10% | 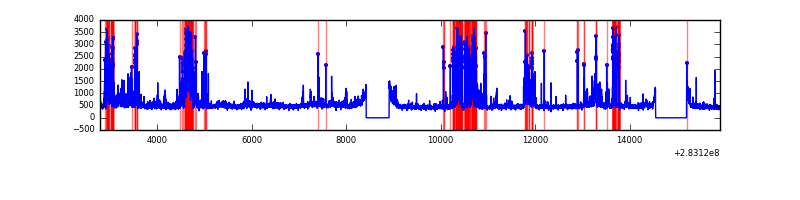 |
Top three noisy pixels from each quadrant. If the there are fewer than three noisy pixels in the level2.evt file, extra rows are filled as -1
| Pixel properties | Quadrant properties | ||||||
|---|---|---|---|---|---|---|---|
| Quadrant | DetID | PixID | Counts | Sigma | Mean | Median | Sigma |
| A | 15 | 174 | 269259 | 926.62 | 1428 | 1396 | 289.1 |
| A | 0 | 226 | 12575 | 38.67 | 1428 | 1396 | 289.1 |
| A | 12 | 194 | 10610 | 31.87 | 1428 | 1396 | 289.1 |
| B | 0 | 197 | 85675 | 306.1 | 1428 | 1390 | 275.4 |
| B | 10 | 16 | 82356 | 294.04 | 1428 | 1390 | 275.4 |
| B | 0 | 230 | 68161 | 242.49 | 1428 | 1390 | 275.4 |
| C | 14 | 238 | 211786 | 650.34 | 1368 | 1380 | 323.5 |
| C | 5 | 218 | 91822 | 279.55 | 1368 | 1380 | 323.5 |
| C | 5 | 219 | 26807 | 78.59 | 1368 | 1380 | 323.5 |
| D | 10 | 70 | 1379536 | 4150.04 | 1367 | 1329 | 332.1 |
| D | 7 | 238 | 728681 | 2190.19 | 1367 | 1329 | 332.1 |
| D | 11 | 176 | 296879 | 889.95 | 1367 | 1329 | 332.1 |
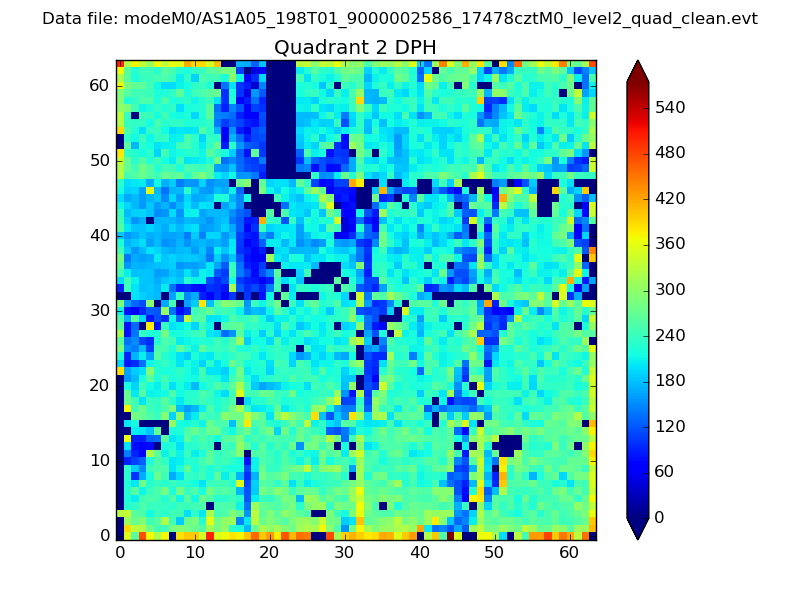
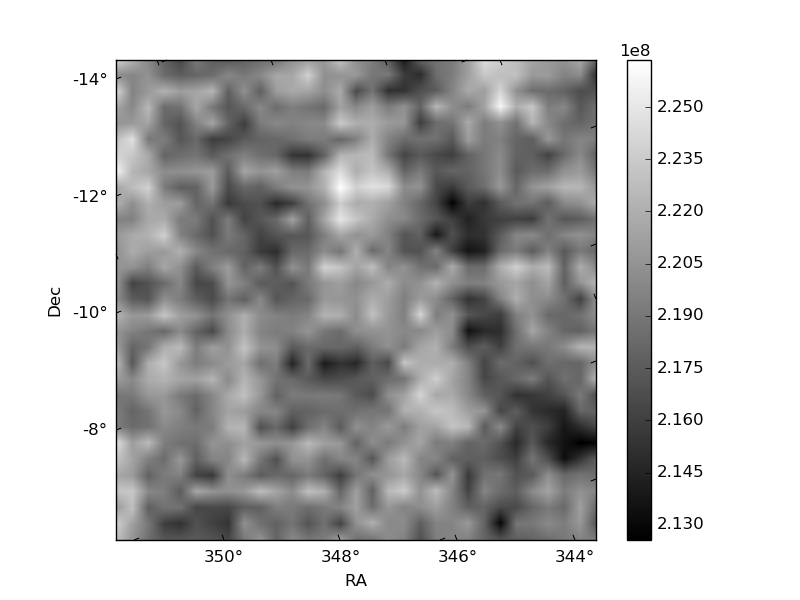
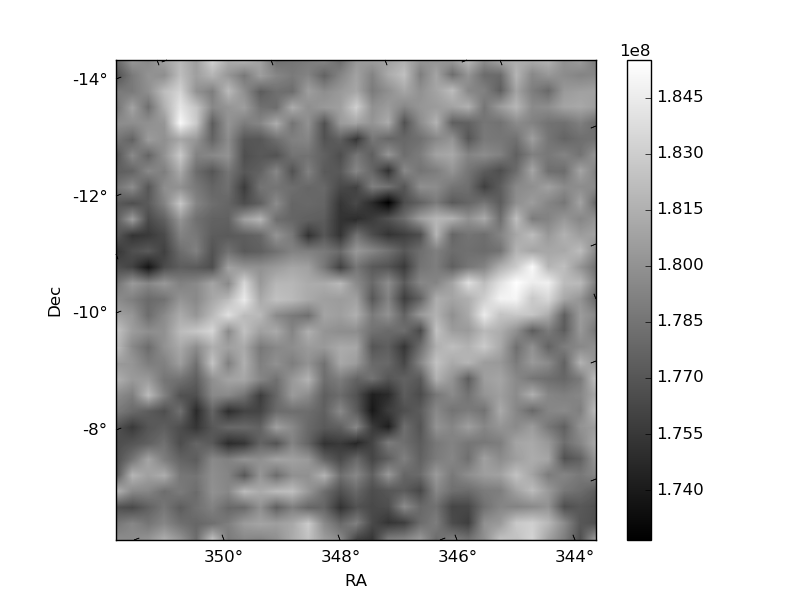
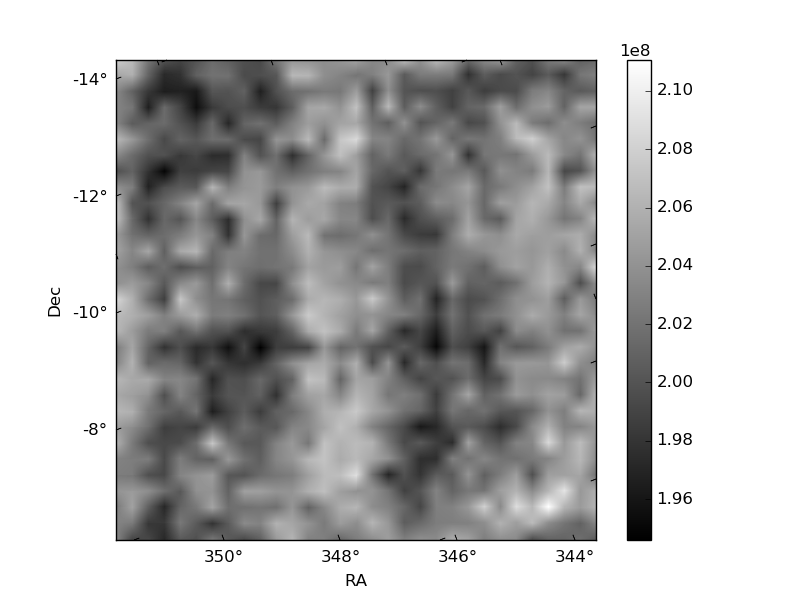
Histogram calculated using DETX and DETY for each event in the final _common_clean file
| Quadrant A | 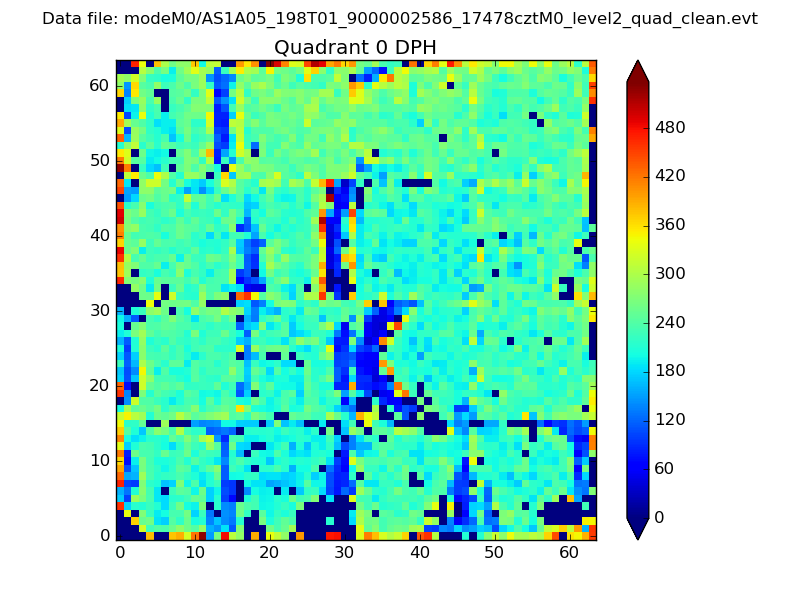 |
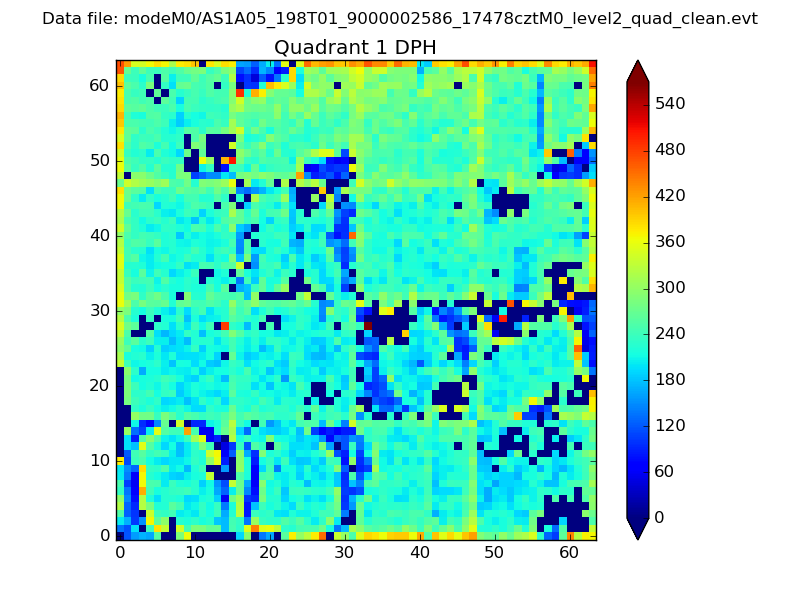 |
Quadrant B |
|---|---|---|---|
| Quadrant D | 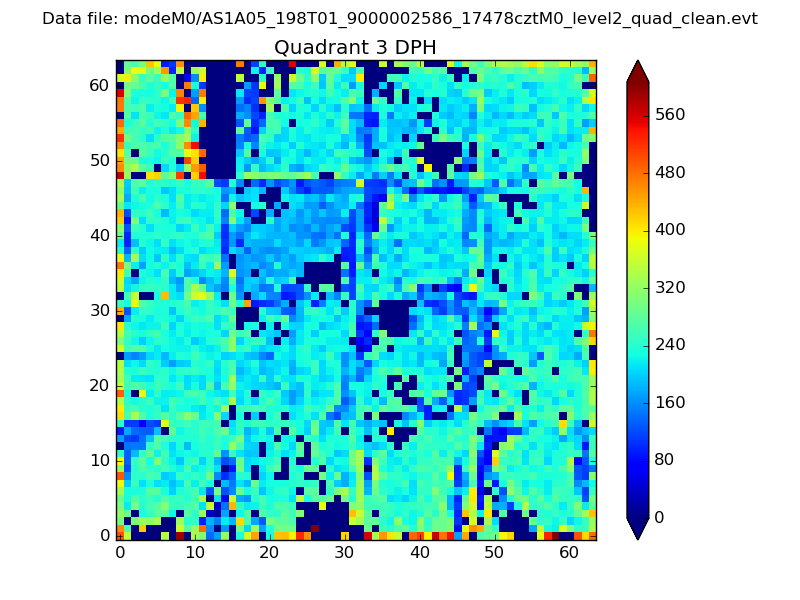 |
 |
Quadrant C |
| Plot type | Count rate plots | Images |
|---|---|---|
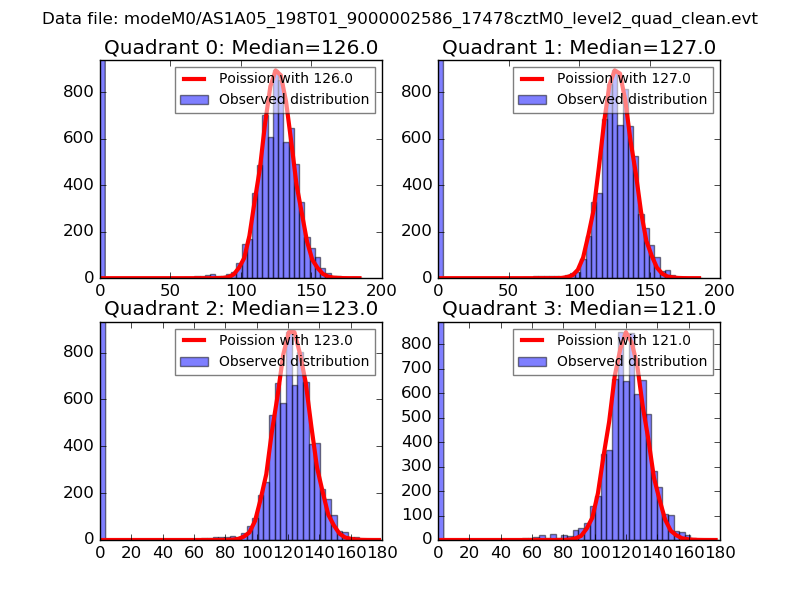
| Comparison with Poisson distribution Blue bars denote a histogram of data divided into 1 sec bins. Red curve is a Poisson curve with rate = median count rate of data. |
 |
 |
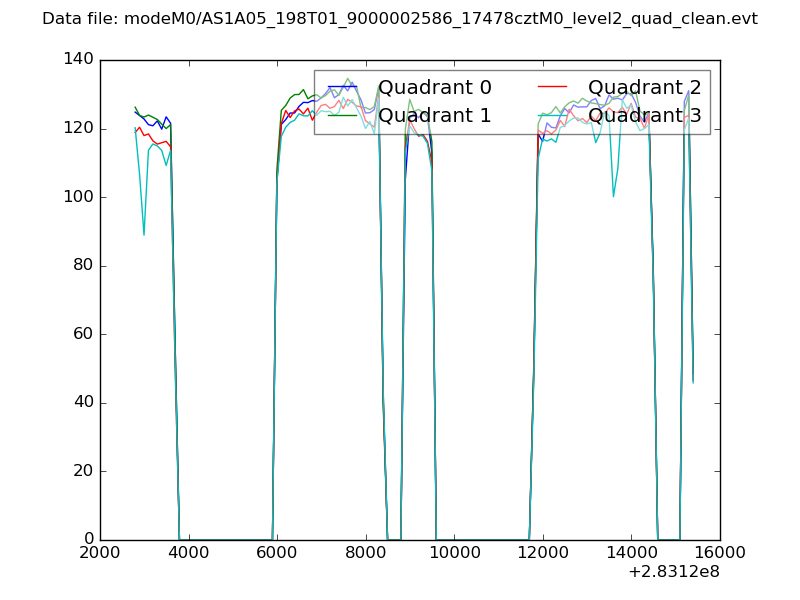
| Quadrant-wise count rates Data is divided into 100 sec bins |
 |
|
| Module-wise count rates for Quadrant A Data is divided into 100 sec bins |
 |
 |
| Module-wise count rates for Quadrant B Data is divided into 100 sec bins |
 |
 |
| Module-wise count rates for Quadrant C Data is divided into 100 sec bins |
 |
 |
| Module-wise count rates for Quadrant D Data is divided into 100 sec bins |
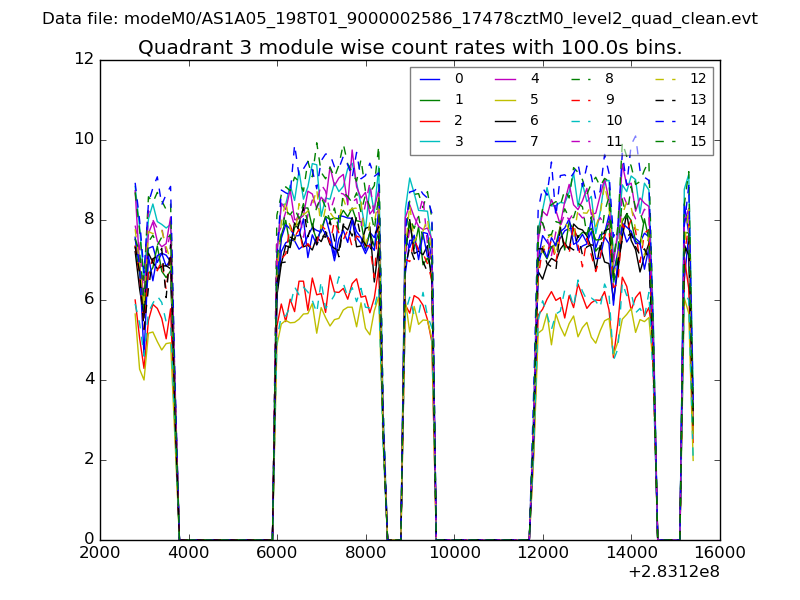 |
 |
| Parameter | Plot |
|---|---|
| CZT HV Monitor | 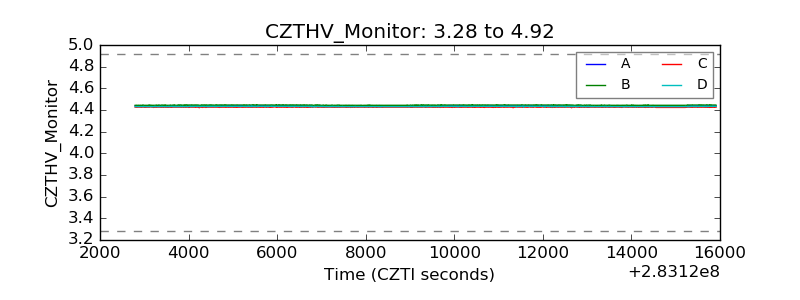 |
| D_VDD | 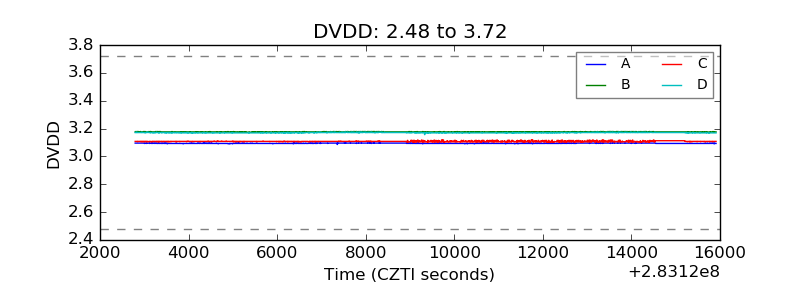 |
| Temperature 1 | 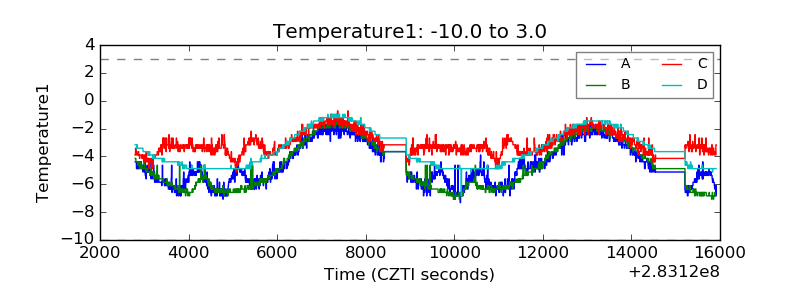 |
| Veto HV Monitor | 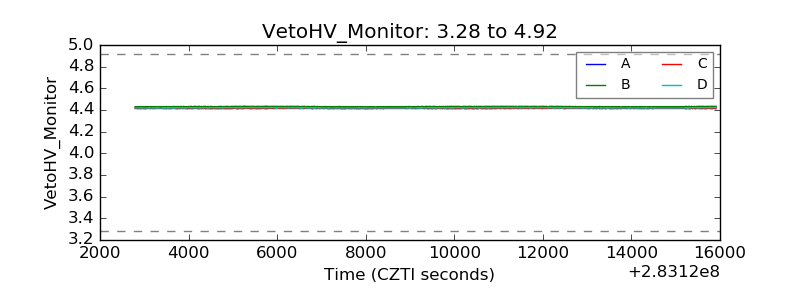 |
| Veto LLD | 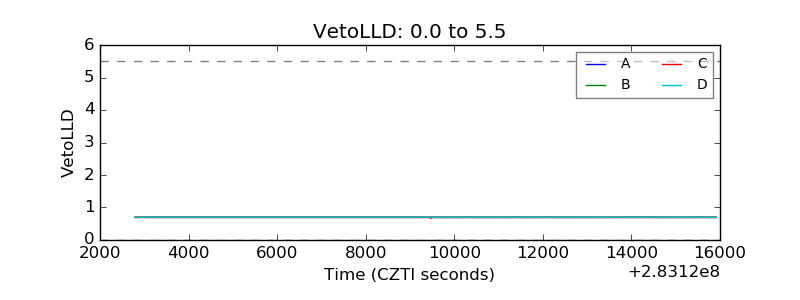 |
| Alpha Counter |  |
| _CPM_Rate | 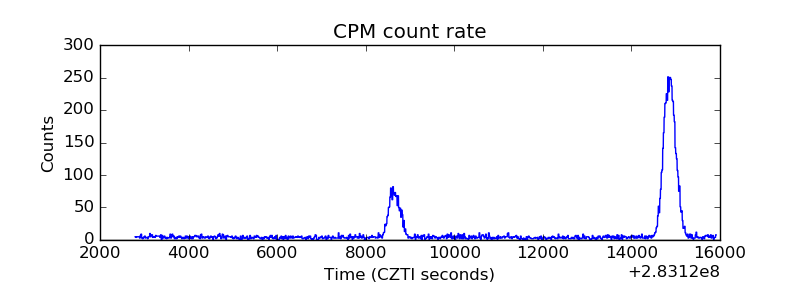 |
| CZT Counter | 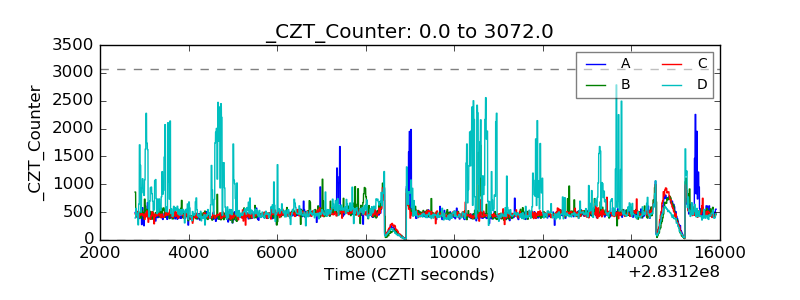 |
| +2.5 Volts monitor |  |
| +5 Volts monitor |  |
| _ROLL_ROT | 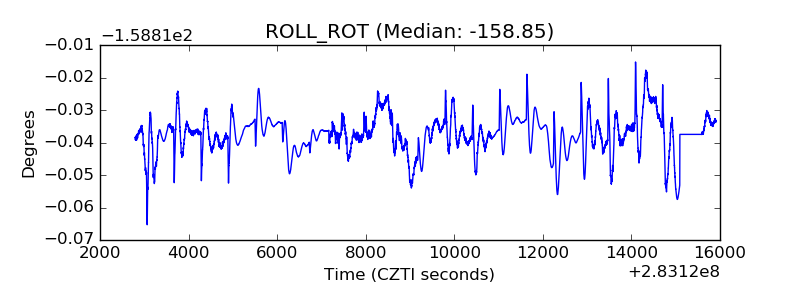 |
| _Roll_DEC | 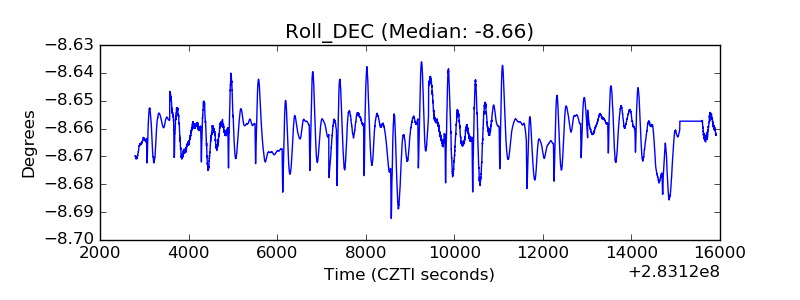 |
| _Roll_RA | 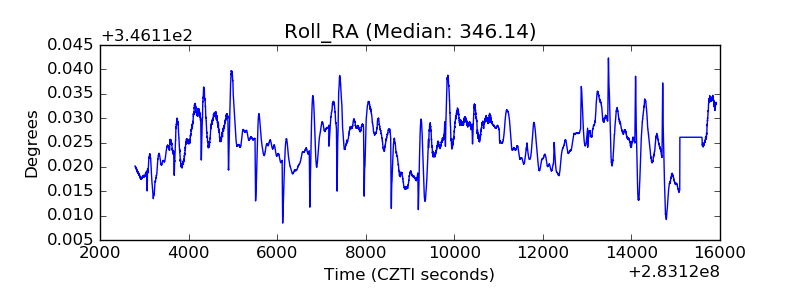 |
| Veto Counter | 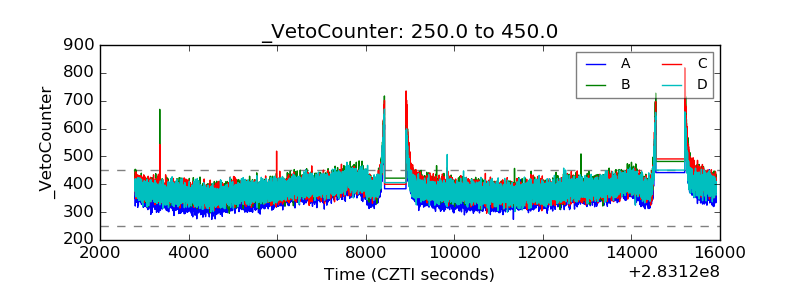 |