| Param | Original file | Final file |
|---|---|---|
| Filename | modeM0/AS1A05_198T01_9000002586_17479cztM0_level2.evt | modeM0/AS1A05_198T01_9000002586_17479cztM0_level2_quad_clean.evt |
| Size (bytes) | 379,673,280 | 55,969,920 |
| Size | 362.1 MB | 53.4 MB |
| Events in quadrant A | 3,390,693 | 341,865 |
| Events in quadrant B | 2,212,228 | 352,773 |
| Events in quadrant C | 2,197,611 | 341,148 |
| Events in quadrant D | 3,378,434 | 328,768 |
| Mode SS | |||
|---|---|---|---|
| Quadrant | BADHDUFLAG | Total packets | Discarded packets |
| A | 0 | 94 | 0 |
| B | 0 | 94 | 0 |
| C | 0 | 94 | 0 |
| D | 0 | 94 | 0 |
| Mode M0 | |||
|---|---|---|---|
| Quadrant | BADHDUFLAG | Total packets | Discarded packets |
| A | 0 | 13212 | 0 |
| B | 0 | 9583 | 0 |
| C | 0 | 9429 | 0 |
| D | 0 | 13295 | 0 |
| Quadrant | Total seconds | Saturated seconds | Saturation percentage |
|---|---|---|---|
| A | 4695 | 299 | 6.368477% |
| B | 4696 | 8 | 0.170358% |
| C | 4696 | 11 | 0.234242% |
| D | 4696 | 68 | 1.448041% |
Noise dominated data is calculated using 1-second bins in cleaned event files. If a bin has >2000 counts, and if more than 50% of those come from <1% of pixels, then it is considered to be noise-dominated and hence unusable.
| Quadrant | # 1 sec bins | Bins with >0 counts | Bins with >2000 counts | High rate bins dominated by noise | Noise dominated (total time) | Noise dominated (detector-on time) | Marked lightcurve |
|---|---|---|---|---|---|---|---|
| A | 4695 | 4695 | 212 | 212 | 4.52% | 4.52% | 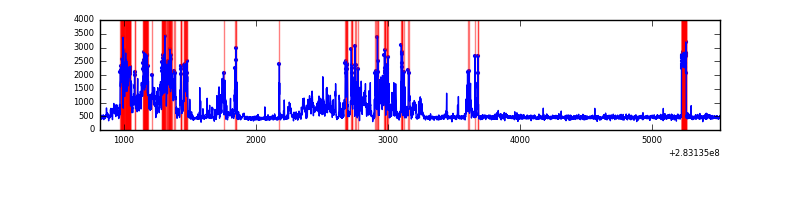 |
| B | 4696 | 4696 | 3 | 3 | 0.06% | 0.06% | 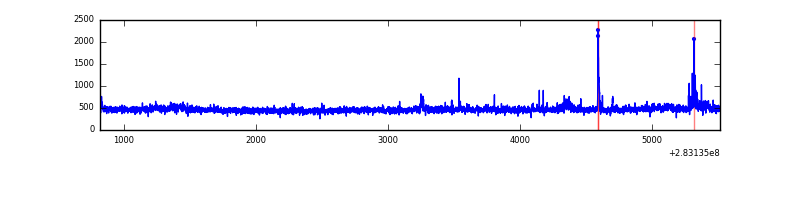 |
| C | 4696 | 4696 | 0 | 0 | 0.00% | 0.00% | 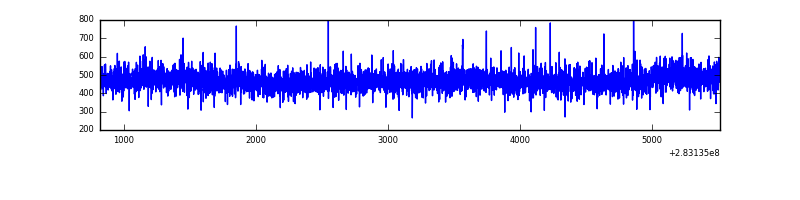 |
| D | 4696 | 4696 | 90 | 90 | 1.92% | 1.92% | 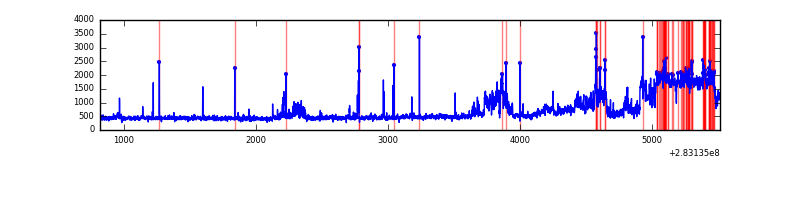 |
Top three noisy pixels from each quadrant. If the there are fewer than three noisy pixels in the level2.evt file, extra rows are filled as -1
| Pixel properties | Quadrant properties | ||||||
|---|---|---|---|---|---|---|---|
| Quadrant | DetID | PixID | Counts | Sigma | Mean | Median | Sigma |
| A | 15 | 174 | 1323048 | 11968.32 | 537 | 524 | 110.5 |
| A | 0 | 226 | 4735 | 38.11 | 537 | 524 | 110.5 |
| A | 12 | 194 | 4089 | 32.26 | 537 | 524 | 110.5 |
| B | 3 | 209 | 22748 | 211.15 | 545 | 533 | 105.2 |
| B | 0 | 197 | 16113 | 148.09 | 545 | 533 | 105.2 |
| B | 12 | 111 | 12656 | 115.23 | 545 | 533 | 105.2 |
| C | 14 | 238 | 79193 | 633.17 | 521 | 524 | 124.2 |
| C | 5 | 218 | 60954 | 486.37 | 521 | 524 | 124.2 |
| C | 5 | 219 | 12194 | 93.93 | 521 | 524 | 124.2 |
| D | 7 | 238 | 1001388 | 7690.11 | 526 | 510 | 130.2 |
| D | 11 | 176 | 240078 | 1840.69 | 526 | 510 | 130.2 |
| D | 5 | 222 | 83351 | 636.5 | 526 | 510 | 130.2 |
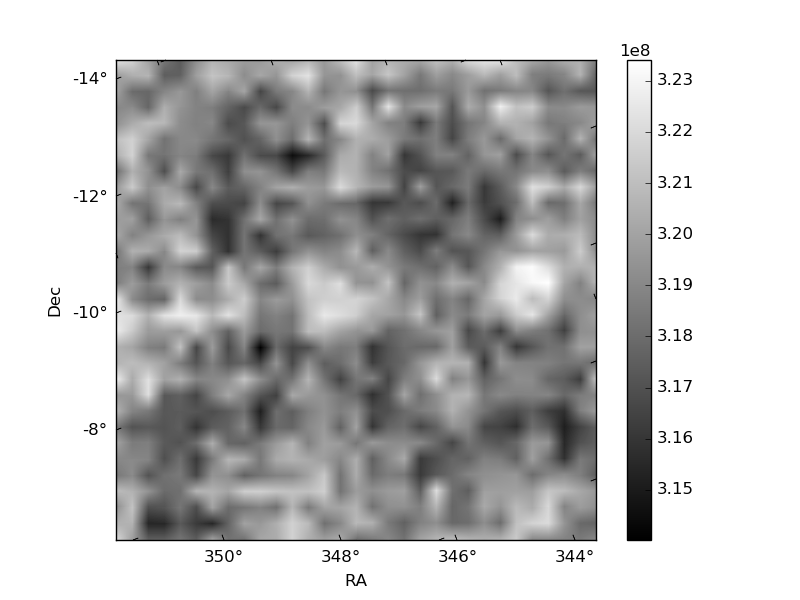
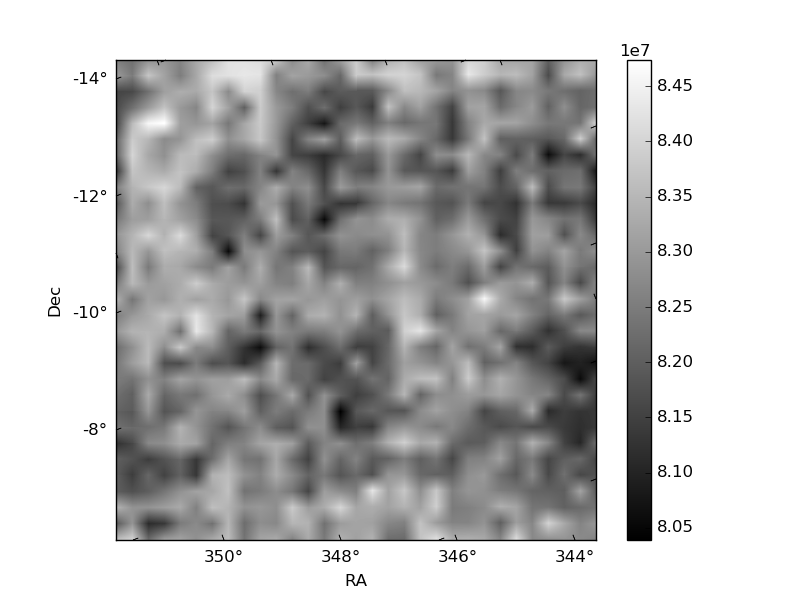
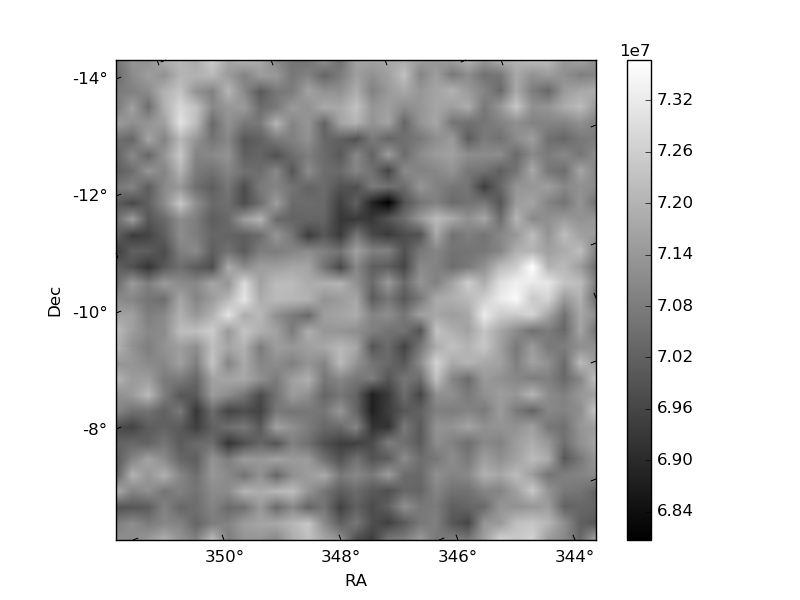
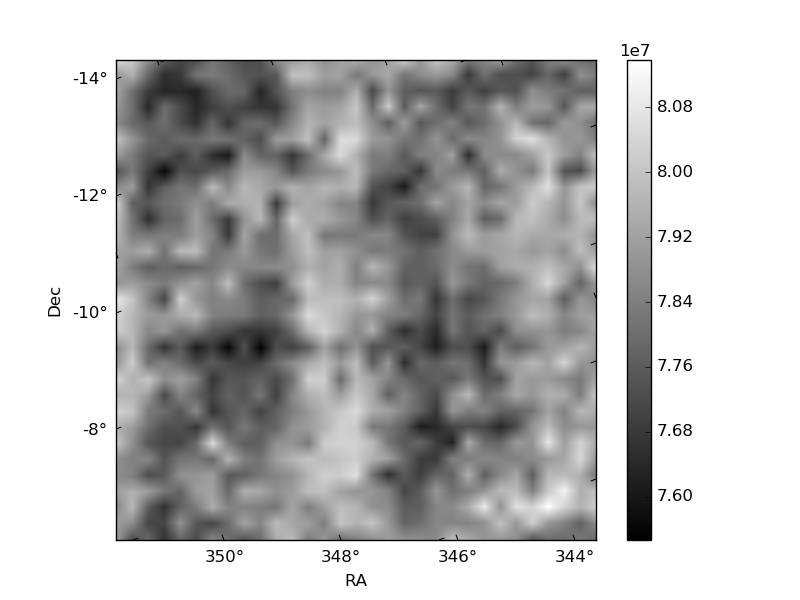
Histogram calculated using DETX and DETY for each event in the final _common_clean file
| Quadrant A | 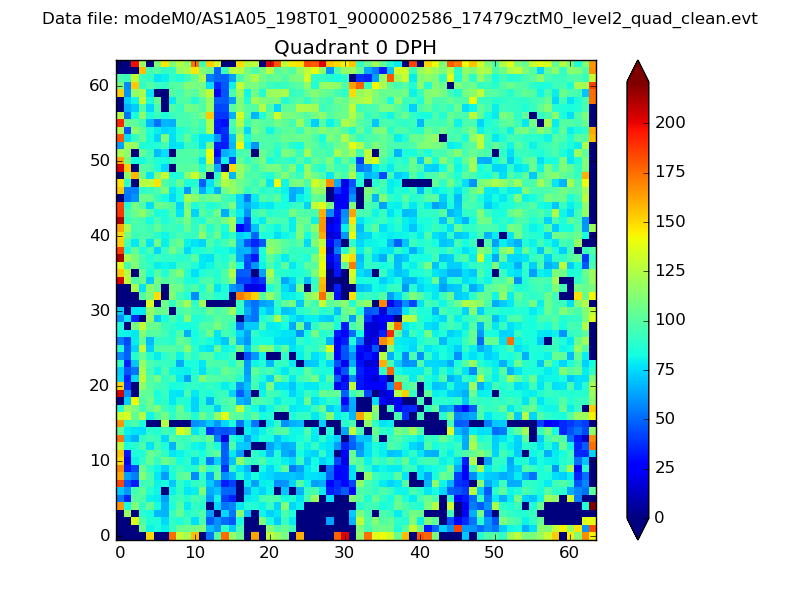 |
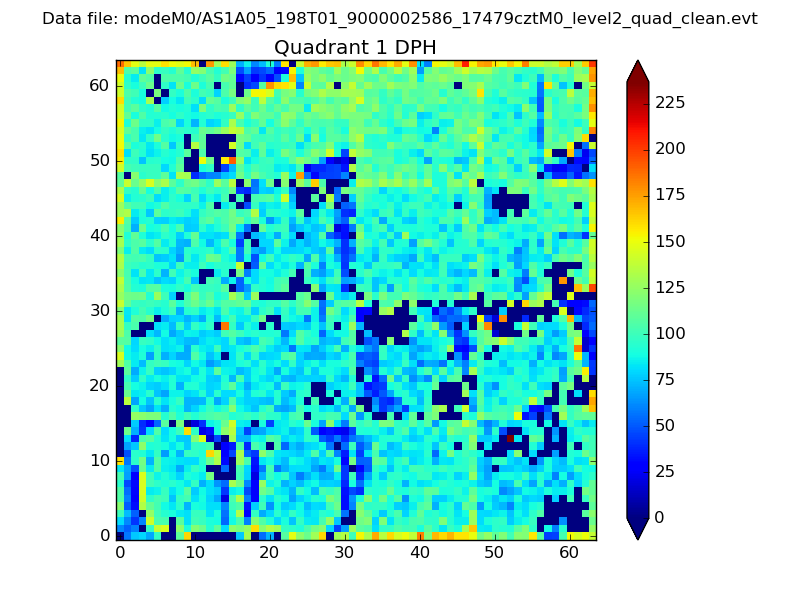 |
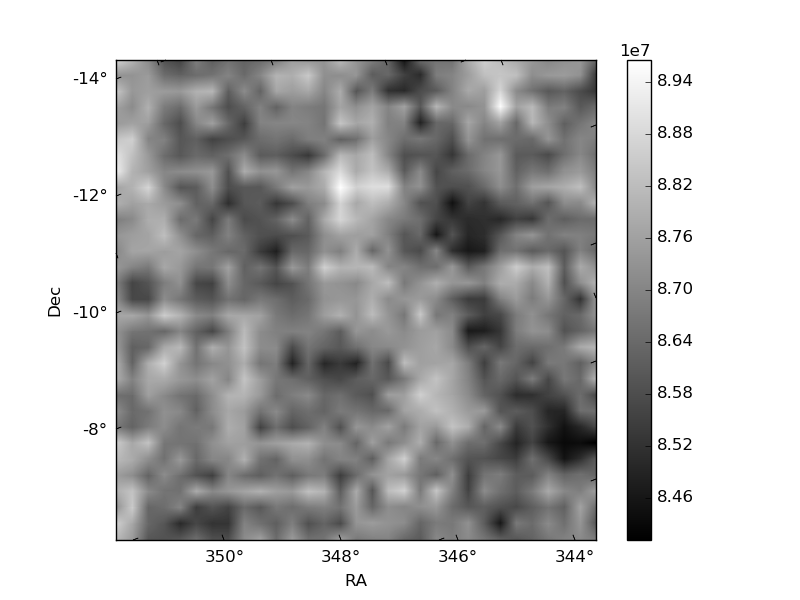
Quadrant B |
|---|---|---|---|
| Quadrant D | 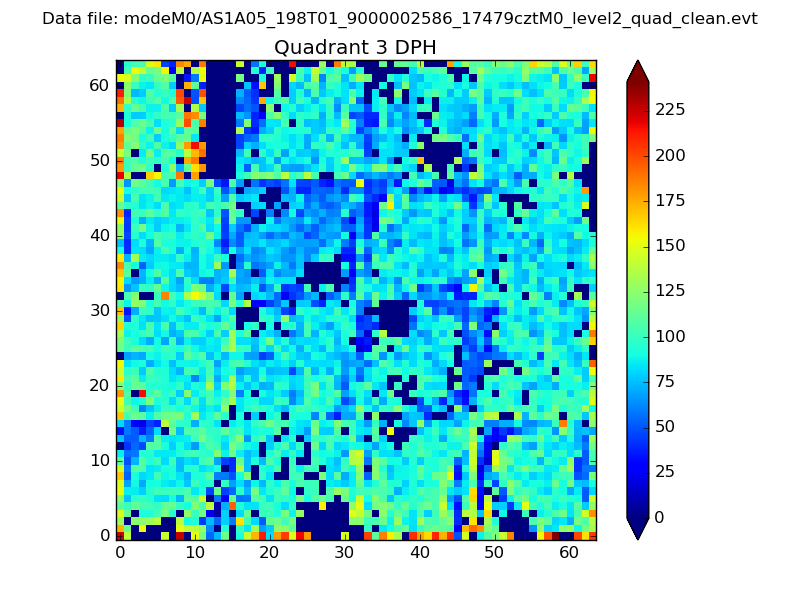 |
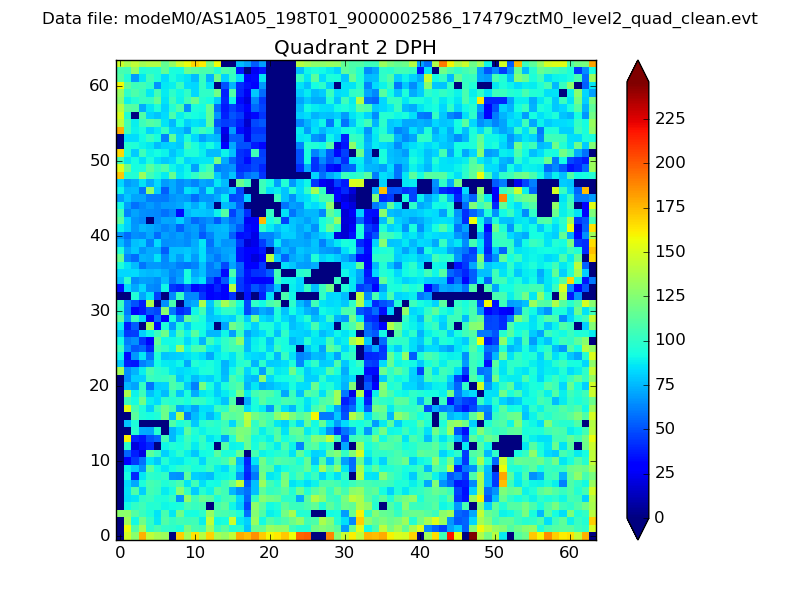 |
Quadrant C |
| Plot type | Count rate plots | Images |
|---|---|---|
| Comparison with Poisson distribution Blue bars denote a histogram of data divided into 1 sec bins. Red curve is a Poisson curve with rate = median count rate of data. |
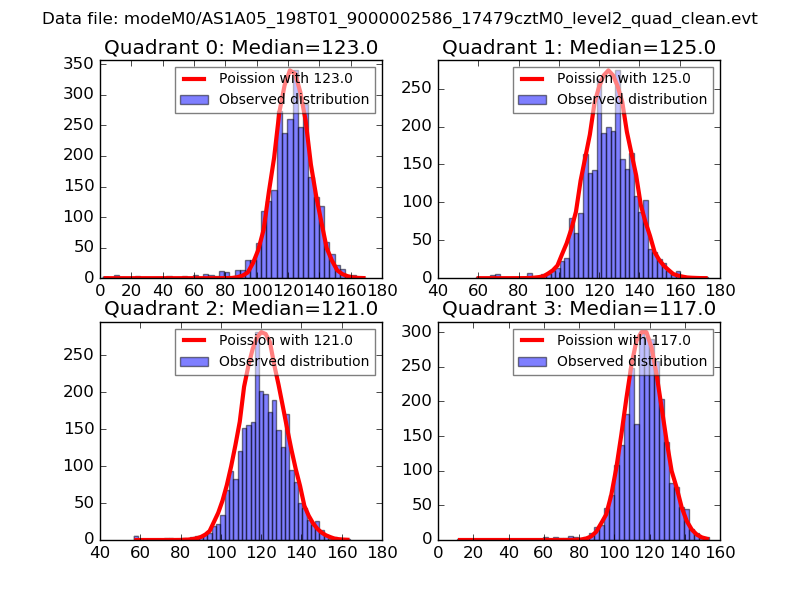 |
 |
| Quadrant-wise count rates Data is divided into 100 sec bins |
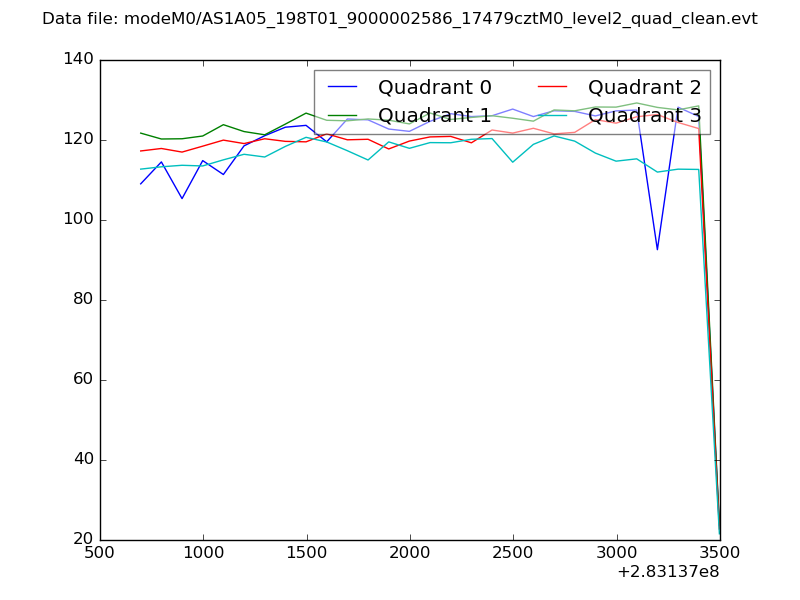 |
|
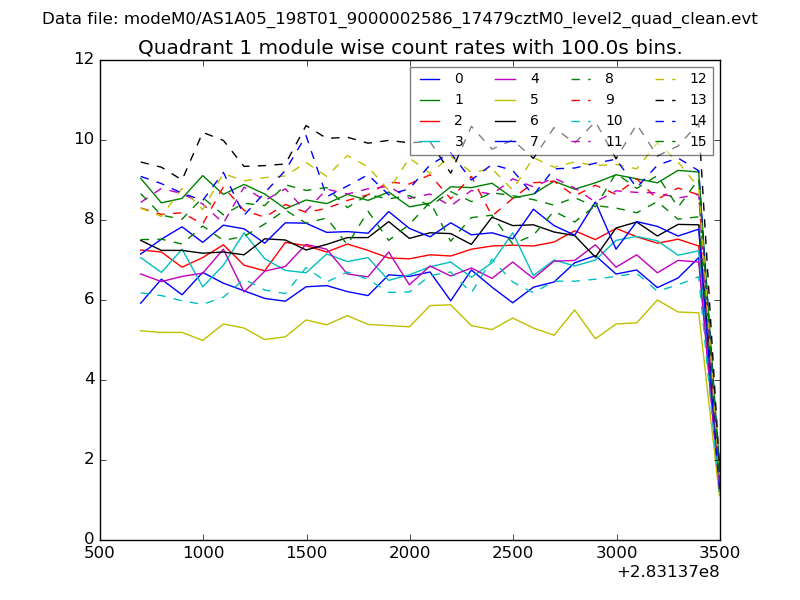
| Module-wise count rates for Quadrant A Data is divided into 100 sec bins |
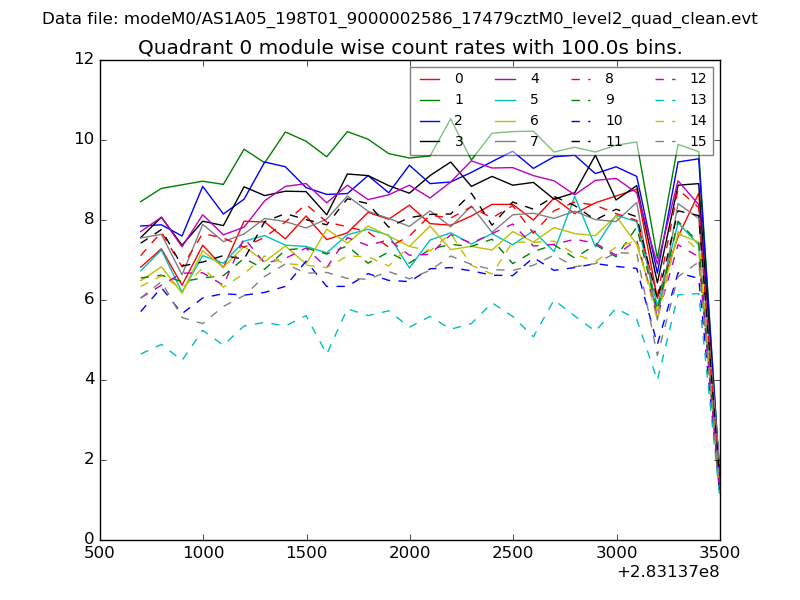 |
 |
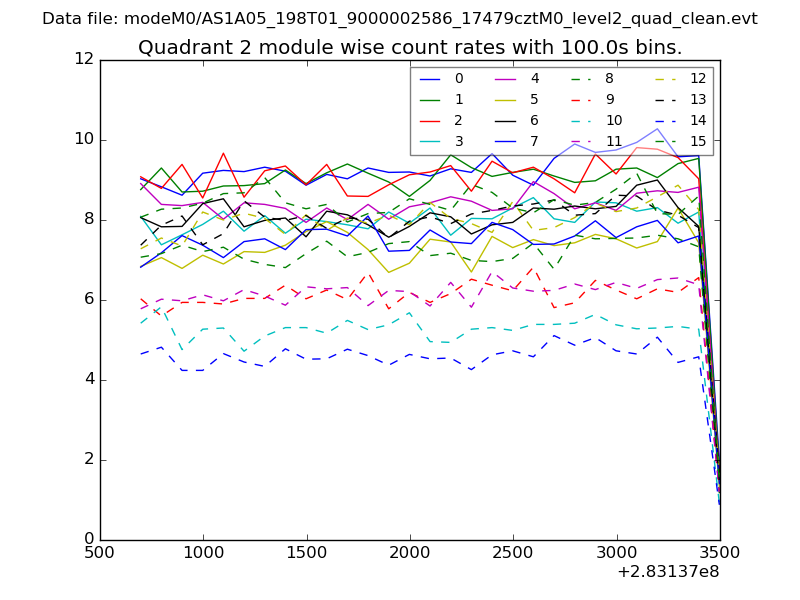
| Module-wise count rates for Quadrant B Data is divided into 100 sec bins |
 |
 |
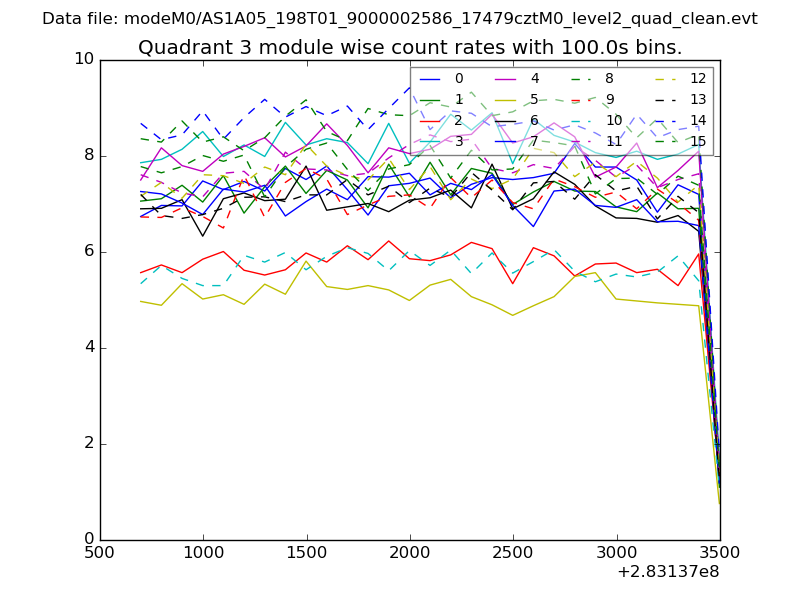
| Module-wise count rates for Quadrant C Data is divided into 100 sec bins |
 |
 |
| Module-wise count rates for Quadrant D Data is divided into 100 sec bins |
 |
 |
| Parameter | Plot |
|---|---|
| CZT HV Monitor | 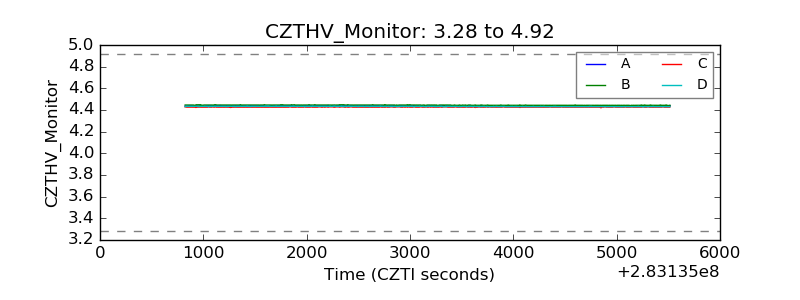 |
| D_VDD | 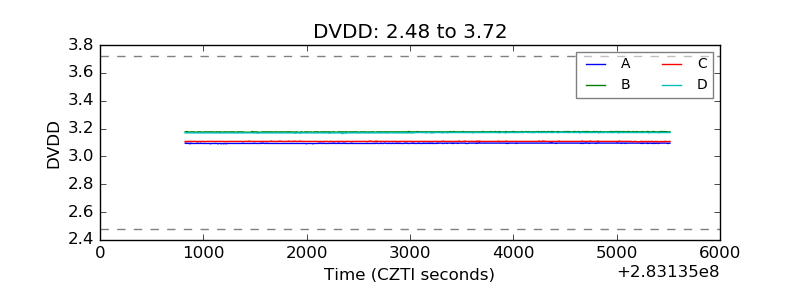 |
| Temperature 1 | 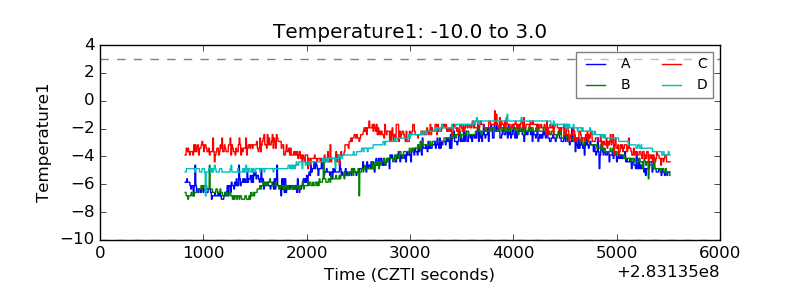 |
| Veto HV Monitor | 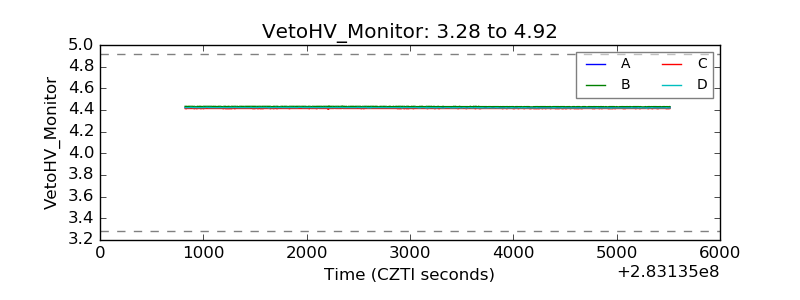 |
| Veto LLD | 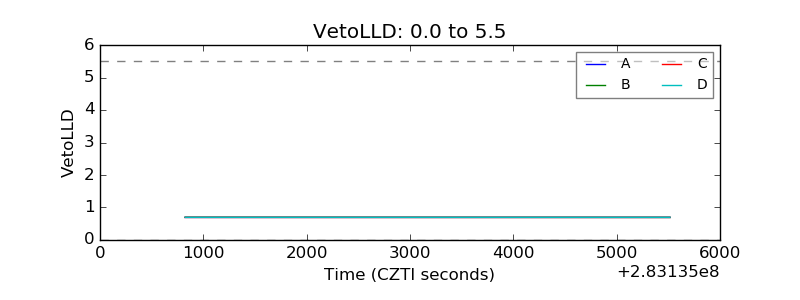 |
| Alpha Counter | 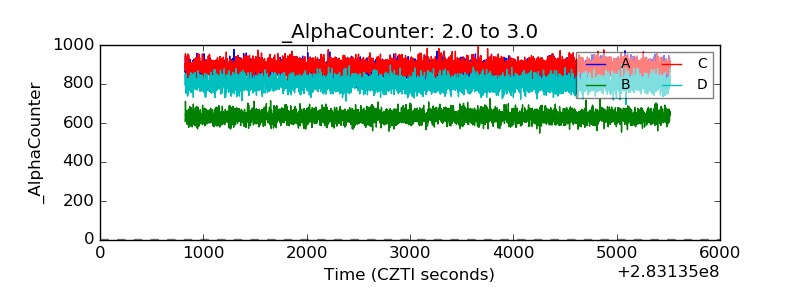 |
| _CPM_Rate |  |
| CZT Counter | 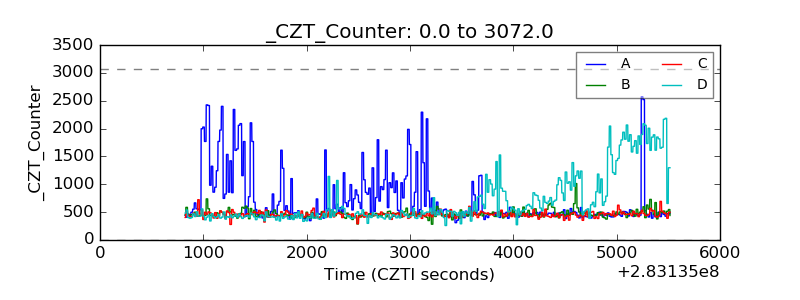 |
| +2.5 Volts monitor | 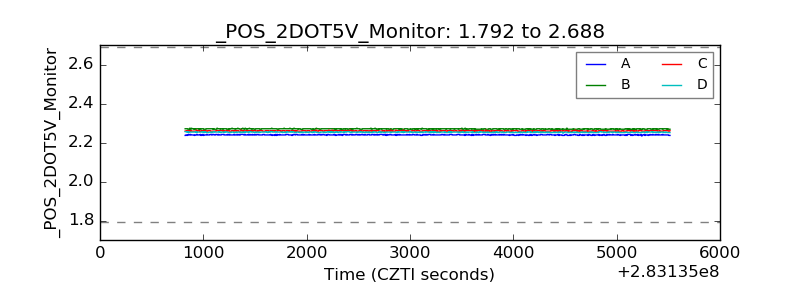 |
| +5 Volts monitor |  |
| _ROLL_ROT | 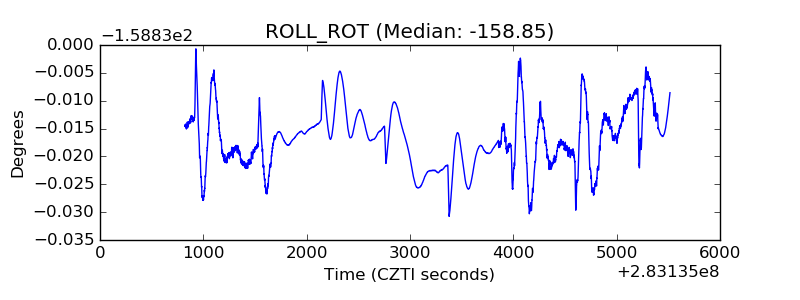 |
| _Roll_DEC | 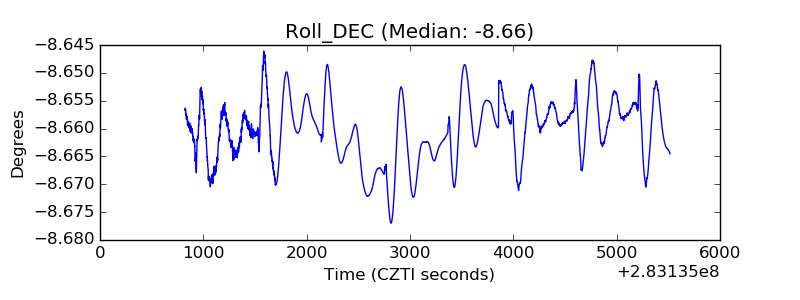 |
| _Roll_RA | 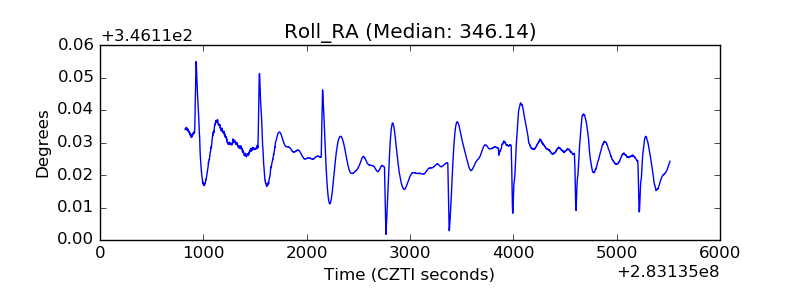 |
| Veto Counter | 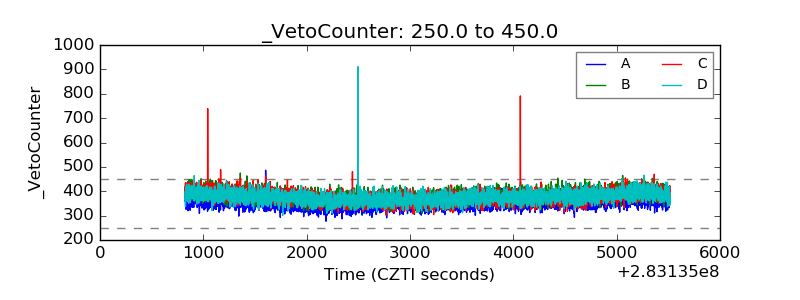 |