| Param | Original file | Final file |
|---|---|---|
| Filename | modeM0/AS1A05_149T03_9000002590cztM0_level2.fits | modeM0/AS1A05_149T03_9000002590cztM0_level2_quad_clean.evt |
| Size (bytes) | 135,512,640 | 121,014,720 |
| Size | 129.2 MB | 115.4 MB |
| Events in quadrant A | 850,910 | 744,675 |
| Events in quadrant B | 811,696 | 731,285 |
| Events in quadrant C | 830,978 | 703,991 |
| Events in quadrant D | 656,374 | 531,232 |
| Mode M0 | |||
|---|---|---|---|
| Quadrant | BADHDUFLAG | Total packets | Discarded packets |
| A | 0 | 29016 | 0 |
| B | 0 | 29740 | 0 |
| C | 0 | 28708 | 0 |
| D | 0 | 50561 | 0 |
| Mode M9 | |||
|---|---|---|---|
| Quadrant | BADHDUFLAG | Total packets | Discarded packets |
| A | 0 | 31 | 0 |
| B | 0 | 31 | 0 |
| C | 0 | 31 | 0 |
| D | 0 | 31 | 0 |
| Mode SS | |||
|---|---|---|---|
| Quadrant | BADHDUFLAG | Total packets | Discarded packets |
| A | 0 | 280 | 0 |
| B | 0 | 280 | 0 |
| C | 0 | 280 | 0 |
| D | 0 | 280 | 0 |
| Quadrant | Total seconds | Saturated seconds | Saturation percentage |
|---|---|---|---|
| A | 13804 | 342 | 2.477543% |
| B | 13804 | 319 | 2.310924% |
| C | 13804 | 343 | 2.484787% |
| D | 13804 | 2649 | 19.190090% |
Noise dominated data is calculated using 1-second bins in cleaned event files. If a bin has >2000 counts, and if more than 50% of those come from <1% of pixels, then it is considered to be noise-dominated and hence unusable.
| Quadrant | # 1 sec bins | Bins with >0 counts | Bins with >2000 counts | High rate bins dominated by noise | Noise dominated (total time) | Noise dominated (detector-on time) | Marked lightcurve |
|---|---|---|---|---|---|---|---|
| A | 16829 | 13801 | 0 | 0 | 0.00% | 0.00% | 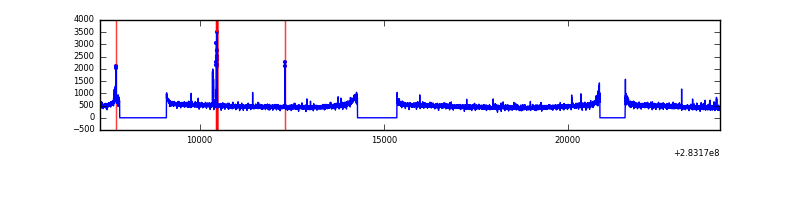 |
| B | 16829 | 13802 | 0 | 0 | 0.00% | 0.00% | 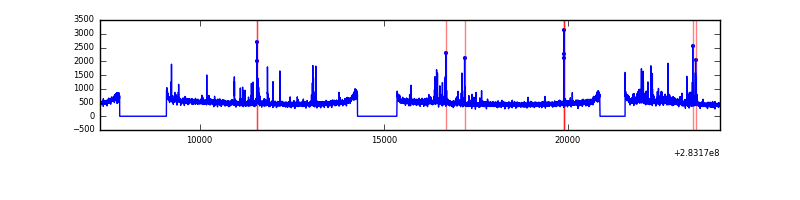 |
| C | 16829 | 13804 | 0 | 0 | 0.00% | 0.00% | 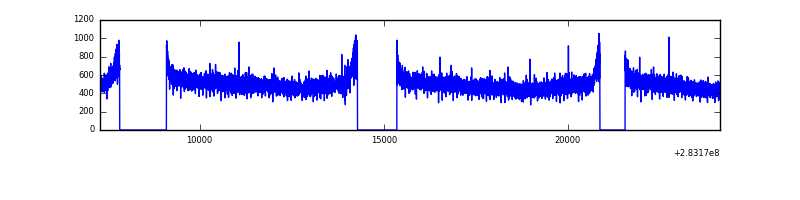 |
| D | 16829 | 13720 | 0 | 0 | 0.00% | 0.00% | 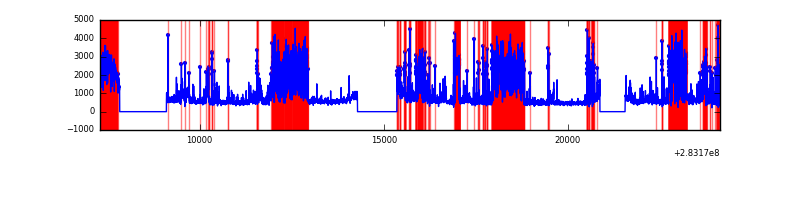 |
Top three noisy pixels from each quadrant. If the there are fewer than three noisy pixels in the level2.evt file, extra rows are filled as -1
| Pixel properties | Quadrant properties | ||||||
|---|---|---|---|---|---|---|---|
| Quadrant | DetID | PixID | Counts | Sigma | Mean | Median | Sigma |
| A | 0 | 29 | 818 | 10.87 | 222 | 209 | 56.0 |
| A | 7 | 110 | 671 | 8.24 | 222 | 209 | 56.0 |
| A | 0 | 30 | 628 | 7.48 | 222 | 209 | 56.0 |
| B | 2 | 9 | 601 | 8.84 | 215 | 206 | 44.7 |
| B | 2 | 8 | 533 | 7.32 | 215 | 206 | 44.7 |
| B | 5 | 255 | 528 | 7.2 | 215 | 206 | 44.7 |
| C | 12 | 241 | 587 | 6.71 | 219 | 206 | 56.8 |
| C | 7 | 111 | 583 | 6.64 | 219 | 206 | 56.8 |
| C | 2 | 191 | 567 | 6.35 | 219 | 206 | 56.8 |
| D | 15 | 142 | 493 | 6.33 | 187 | 171 | 50.9 |
| D | 15 | 46 | 485 | 6.17 | 187 | 171 | 50.9 |
| D | 6 | 67 | 482 | 6.11 | 187 | 171 | 50.9 |
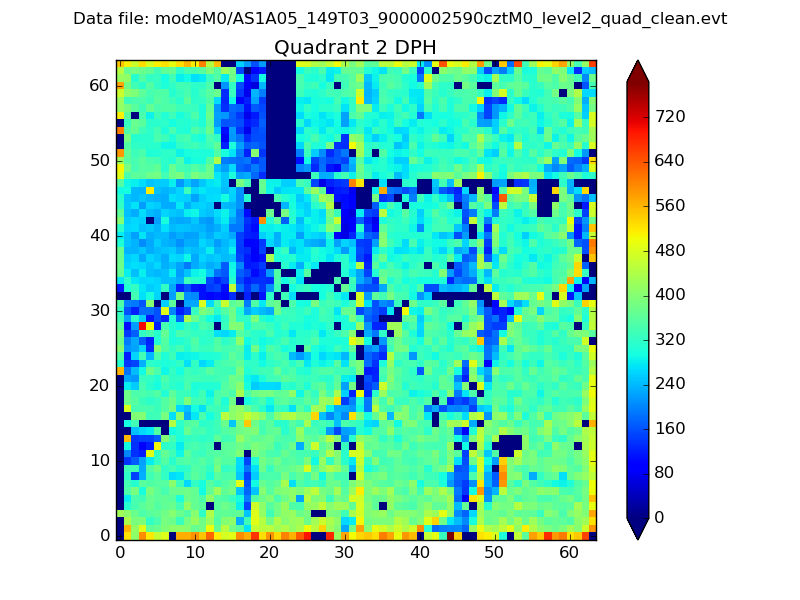
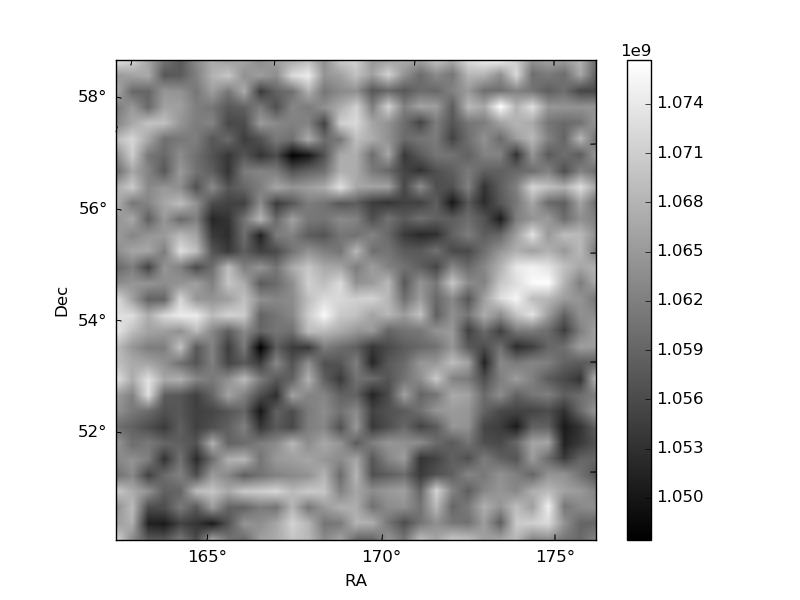
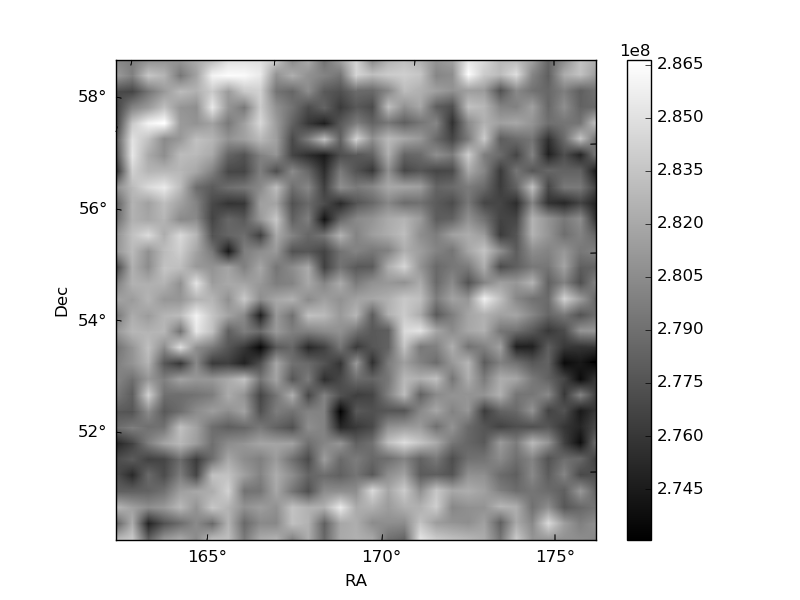
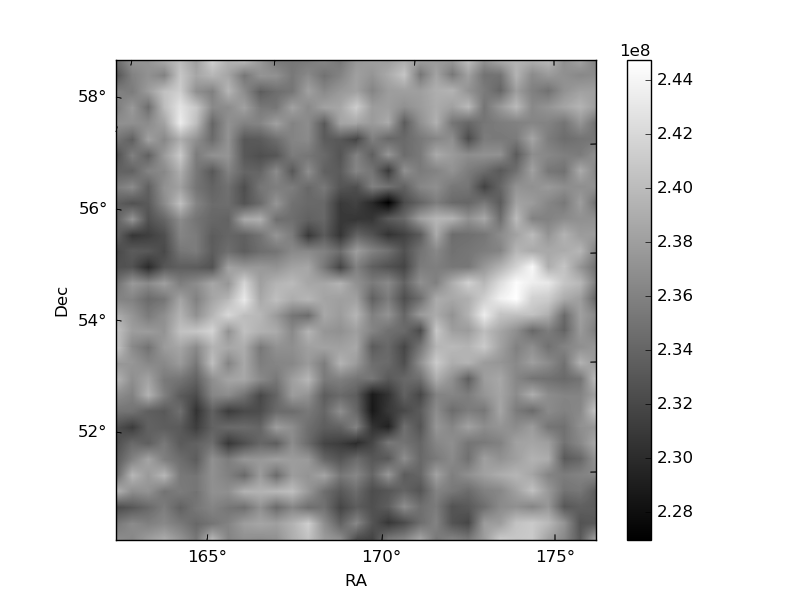
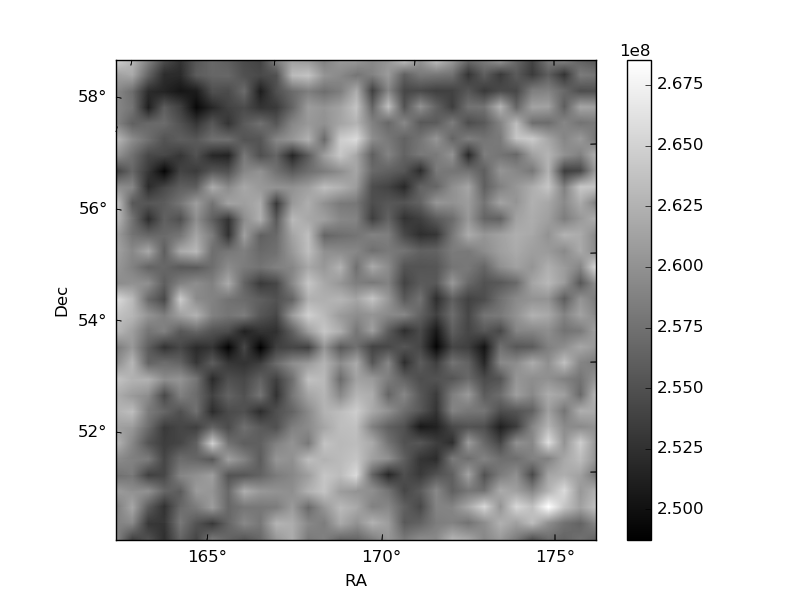
Histogram calculated using DETX and DETY for each event in the final _common_clean file
| Quadrant A | 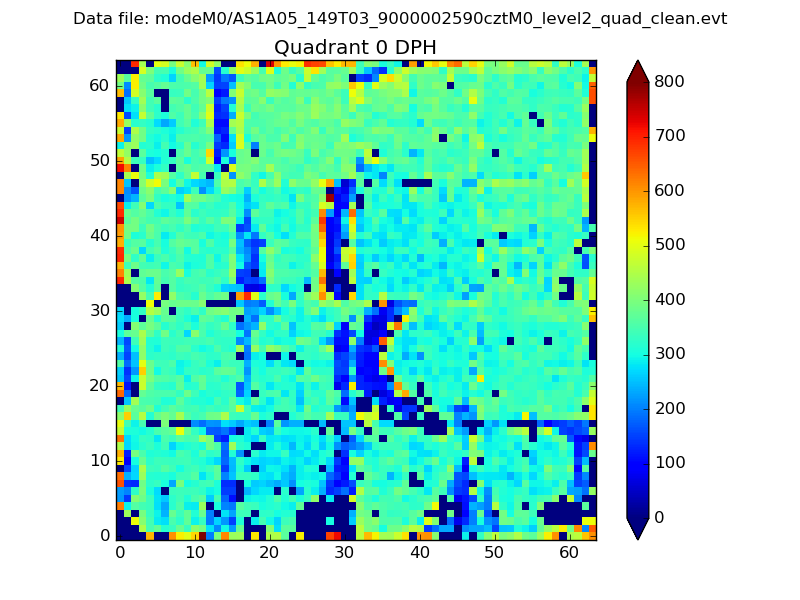 |
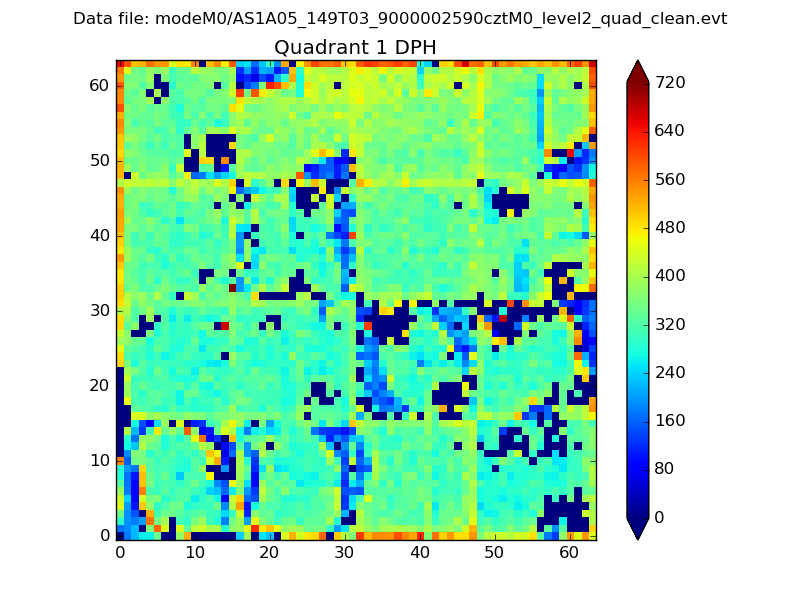 |
Quadrant B |
|---|---|---|---|
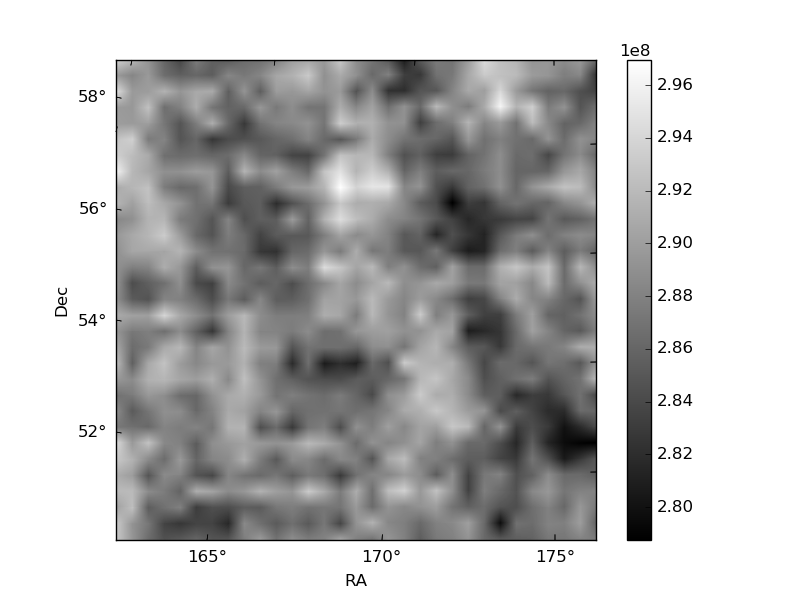
| Quadrant D | 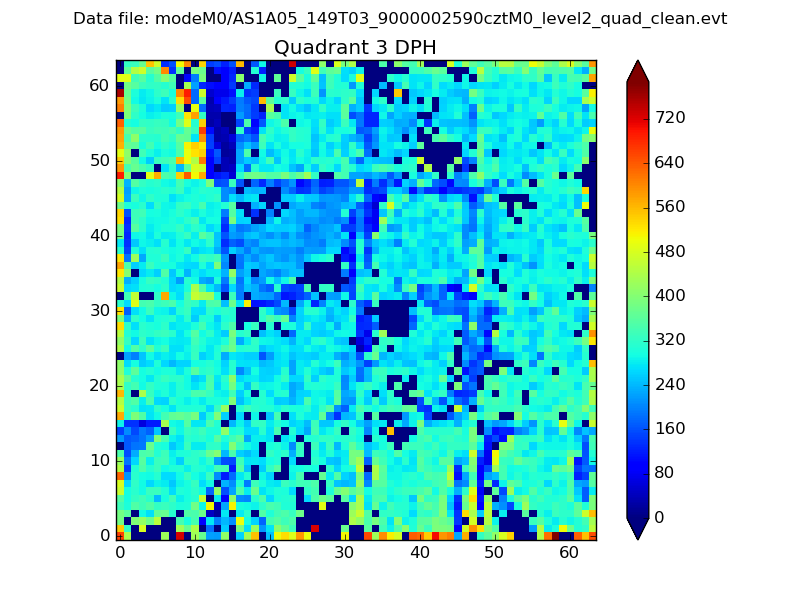 |
 |
Quadrant C |
| Plot type | Count rate plots | Images |
|---|---|---|
| Comparison with Poisson distribution Blue bars denote a histogram of data divided into 1 sec bins. Red curve is a Poisson curve with rate = median count rate of data. |
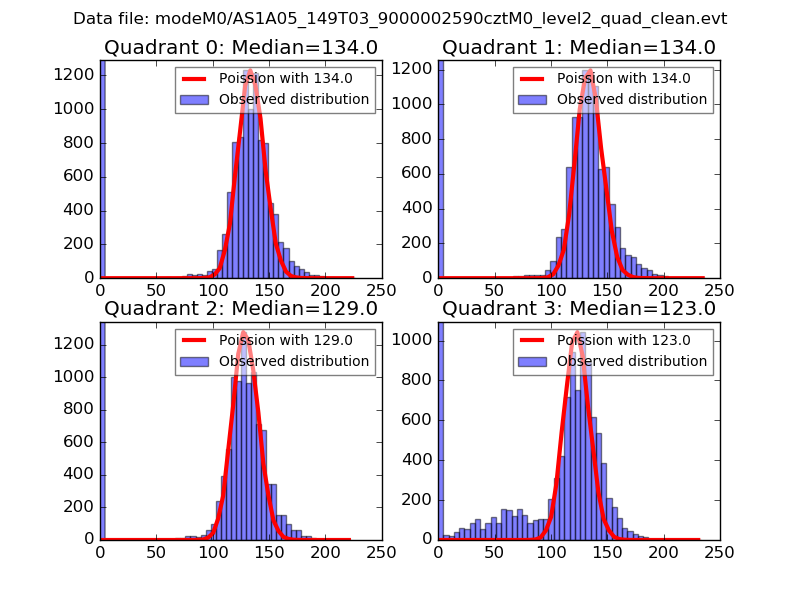 |
 |
| Quadrant-wise count rates Data is divided into 100 sec bins |
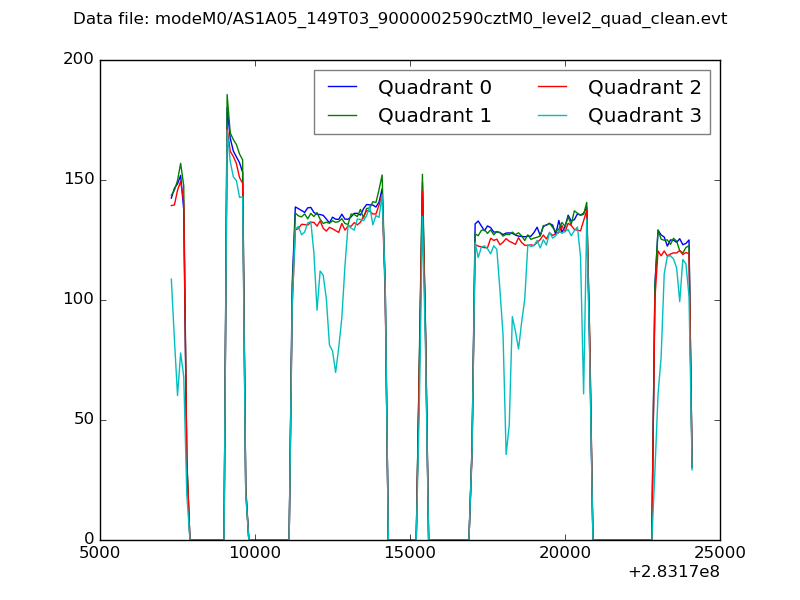 |
|
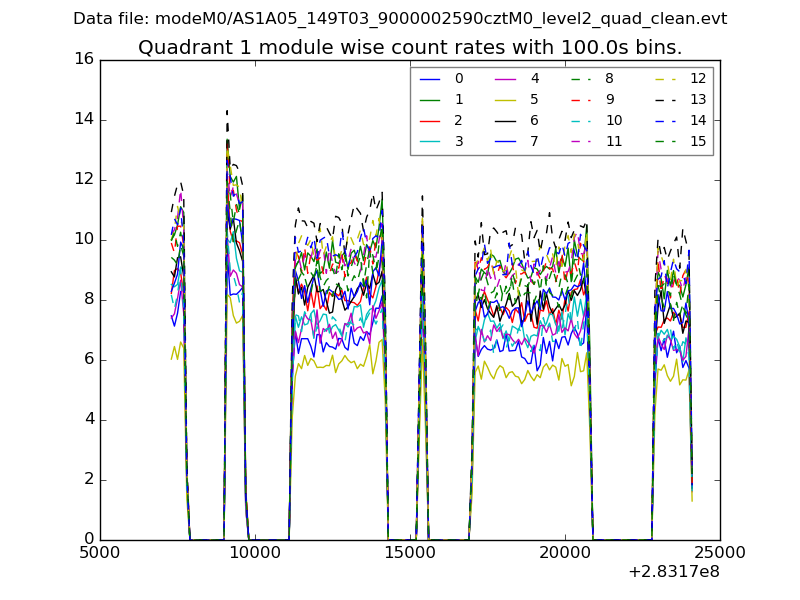
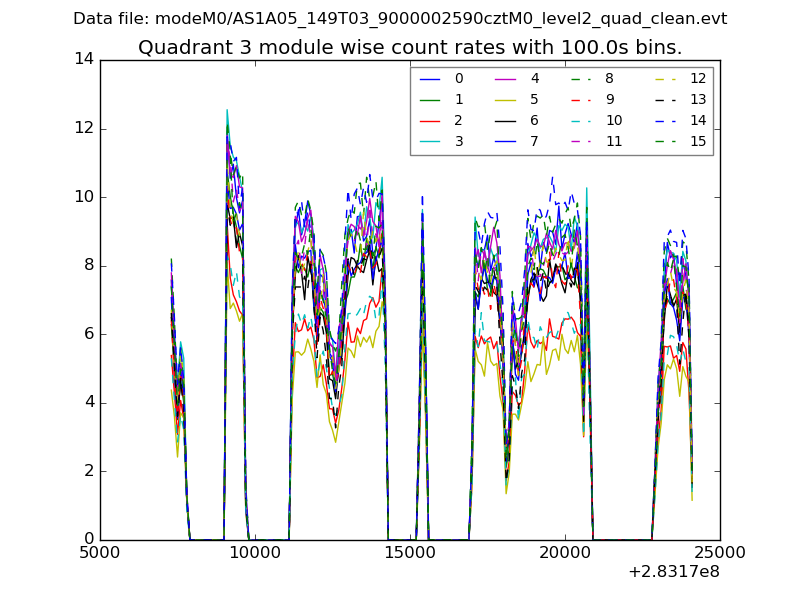
| Module-wise count rates for Quadrant A Data is divided into 100 sec bins |
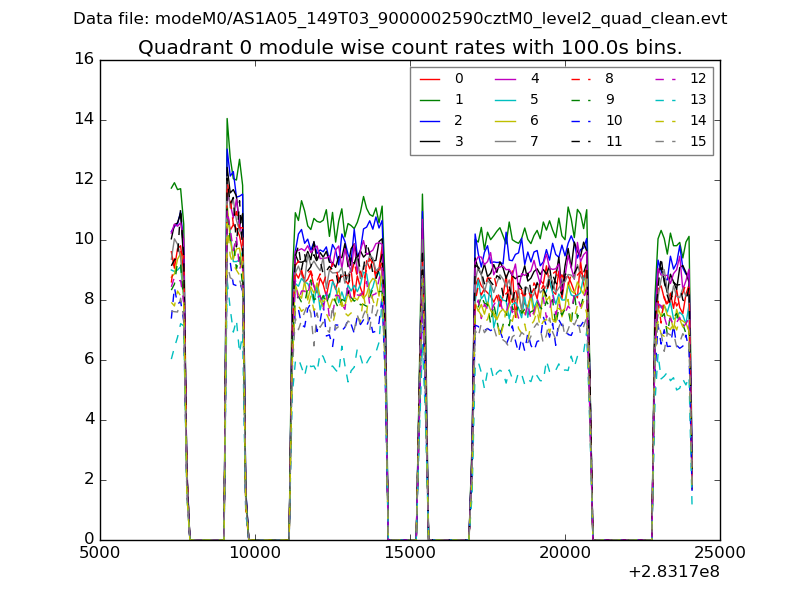 |
 |
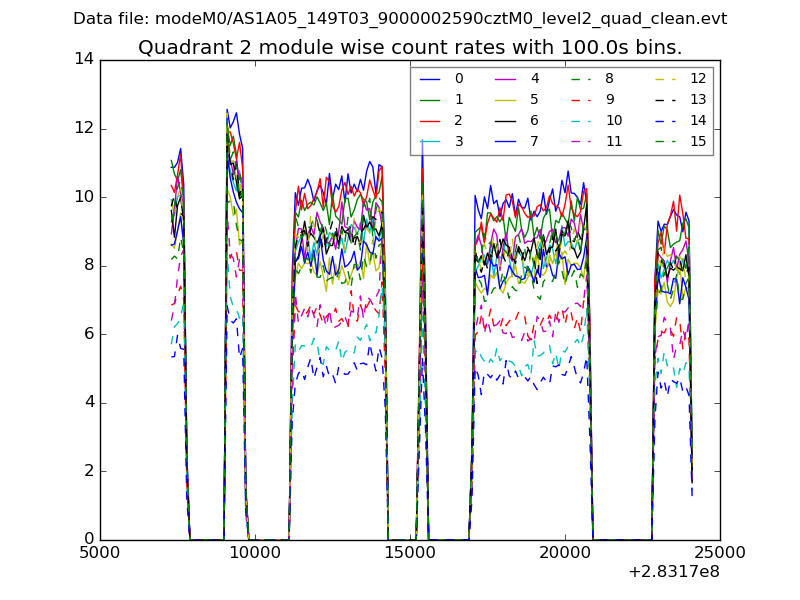
| Module-wise count rates for Quadrant B Data is divided into 100 sec bins |
 |
 |
| Module-wise count rates for Quadrant C Data is divided into 100 sec bins |
 |
 |
| Module-wise count rates for Quadrant D Data is divided into 100 sec bins |
 |
 |
| Parameter | Plot |
|---|---|
| CZT HV Monitor | 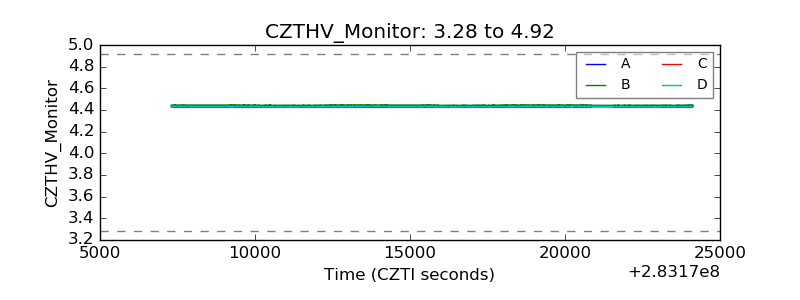 |
| D_VDD | 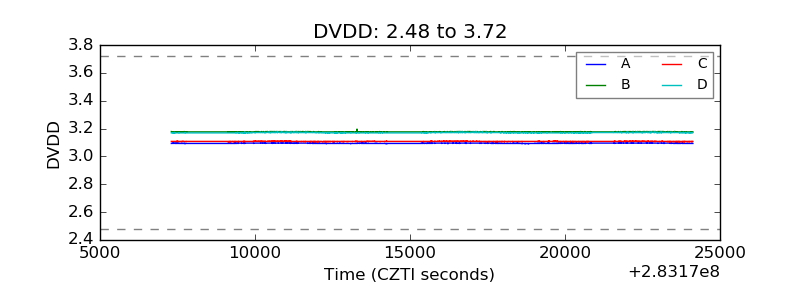 |
| Temperature 1 | 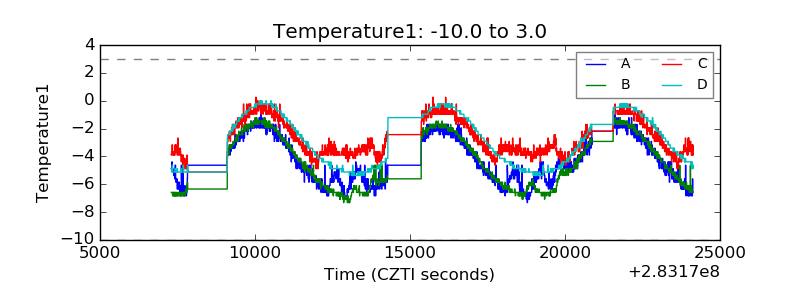 |
| Veto HV Monitor | 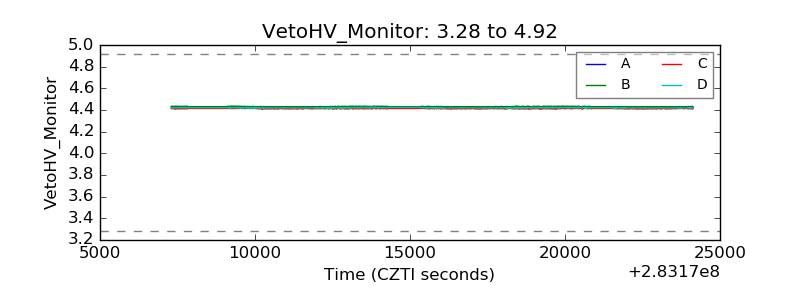 |
| Veto LLD | 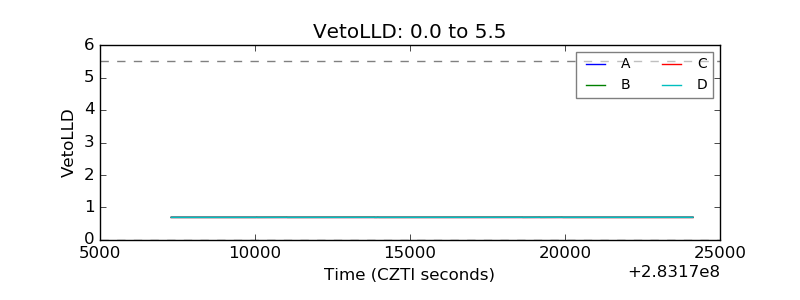 |
| Alpha Counter | 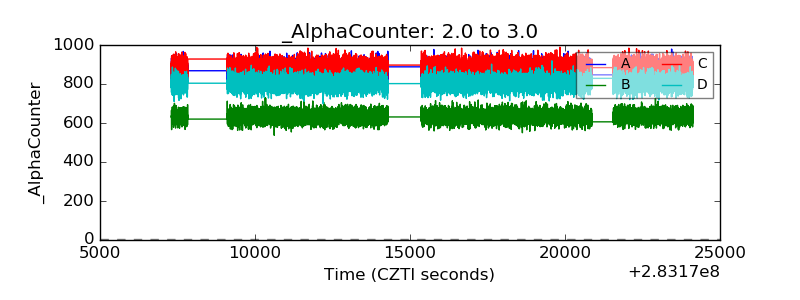 |
| _CPM_Rate | 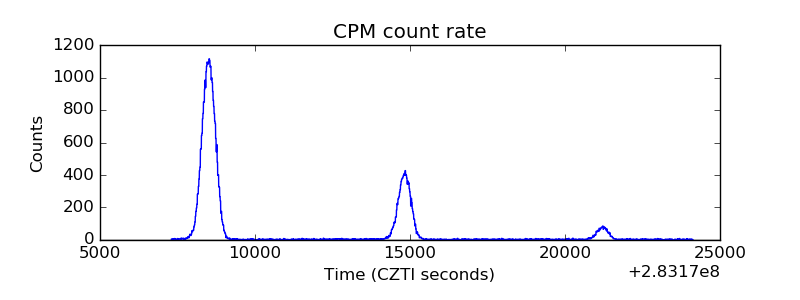 |
| CZT Counter | 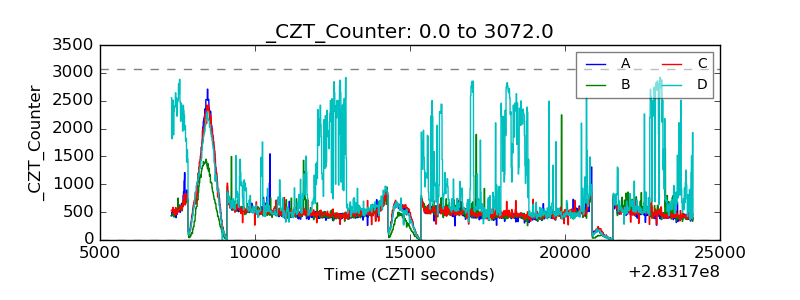 |
| +2.5 Volts monitor | 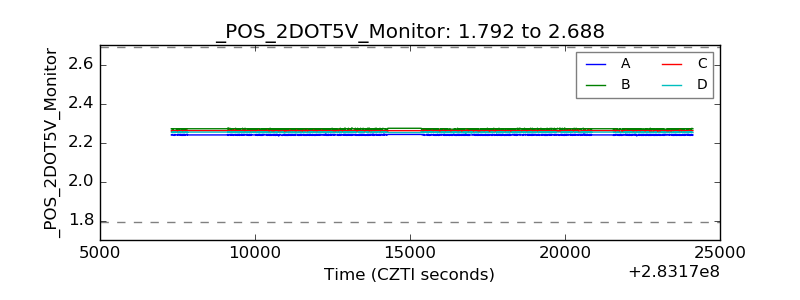 |
| +5 Volts monitor | 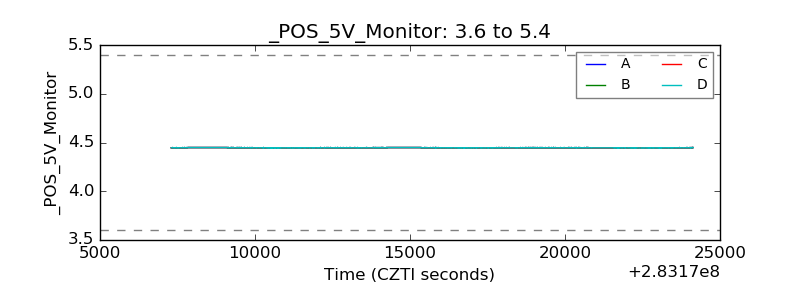 |
| _ROLL_ROT | 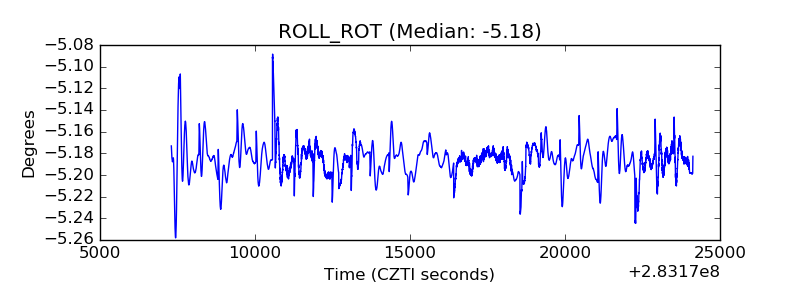 |
| _Roll_DEC | 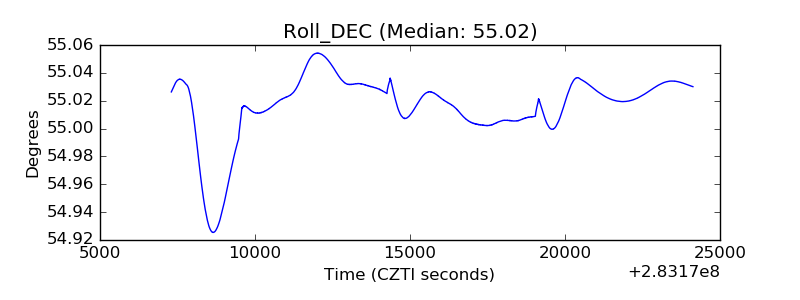 |
| _Roll_RA | 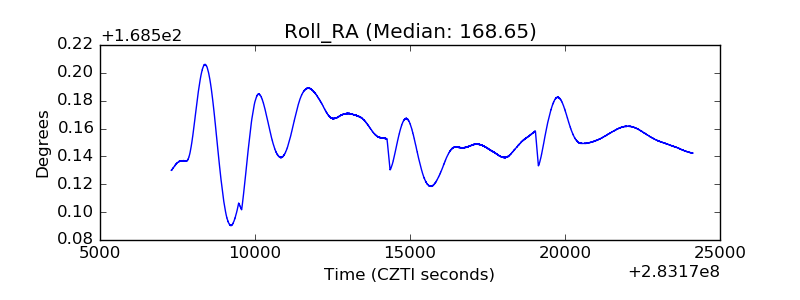 |
| Veto Counter | 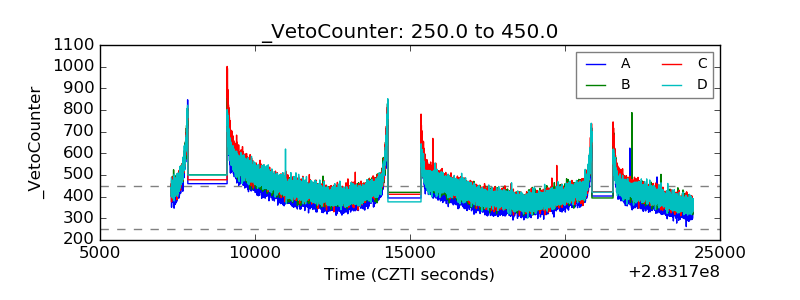 |