| Param | Original file | Final file |
|---|---|---|
| Filename | modeM0/AS1A05_149T03_9000002590_17486cztM0_level2.evt | modeM0/AS1A05_149T03_9000002590_17486cztM0_level2_quad_clean.evt |
| Size (bytes) | 199,981,440 | 27,031,680 |
| Size | 190.7 MB | 25.8 MB |
| Events in quadrant A | 1,252,467 | 176,602 |
| Events in quadrant B | 1,193,861 | 181,508 |
| Events in quadrant C | 1,177,098 | 172,225 |
| Events in quadrant D | 2,287,401 | 134,430 |
| Mode M0 | |||
|---|---|---|---|
| Quadrant | BADHDUFLAG | Total packets | Discarded packets |
| A | 0 | 4925 | 1 |
| B | 0 | 4781 | 1 |
| C | 0 | 4689 | 1 |
| D | 0 | 8199 | 1 |
| Mode M9 | |||
|---|---|---|---|
| Quadrant | BADHDUFLAG | Total packets | Discarded packets |
| A | 0 | 13 | 0 |
| B | 0 | 13 | 0 |
| C | 0 | 13 | 0 |
| D | 0 | 13 | 0 |
| Mode SS | |||
|---|---|---|---|
| Quadrant | BADHDUFLAG | Total packets | Discarded packets |
| A | 0 | 42 | 0 |
| B | 0 | 42 | 0 |
| C | 0 | 42 | 0 |
| D | 0 | 42 | 0 |
| Quadrant | Total seconds | Saturated seconds | Saturation percentage |
|---|---|---|---|
| A | 2120 | 153 | 7.216981% |
| B | 2120 | 111 | 5.235849% |
| C | 2120 | 122 | 5.754717% |
| D | 2120 | 512 | 24.150943% |
Noise dominated data is calculated using 1-second bins in cleaned event files. If a bin has >2000 counts, and if more than 50% of those come from <1% of pixels, then it is considered to be noise-dominated and hence unusable.
| Quadrant | # 1 sec bins | Bins with >0 counts | Bins with >2000 counts | High rate bins dominated by noise | Noise dominated (total time) | Noise dominated (detector-on time) | Marked lightcurve |
|---|---|---|---|---|---|---|---|
| A | 3390 | 2120 | 15 | 15 | 0.44% | 0.71% | 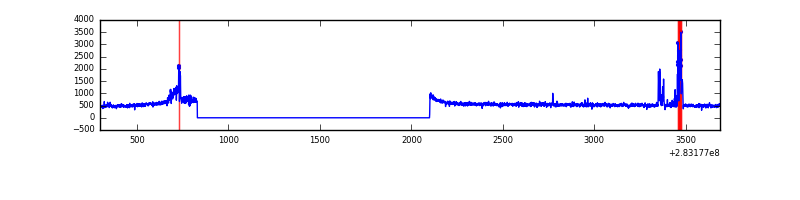 |
| B | 3390 | 2120 | 0 | 0 | 0.00% | 0.00% | 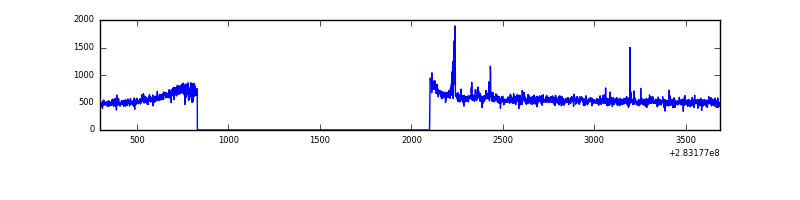 |
| C | 3390 | 2121 | 0 | 0 | 0.00% | 0.00% | 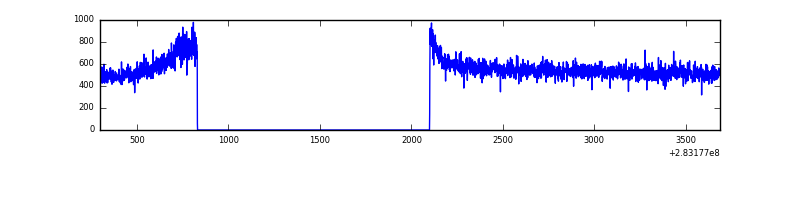 |
| D | 3390 | 2120 | 377 | 377 | 11.12% | 17.78% | 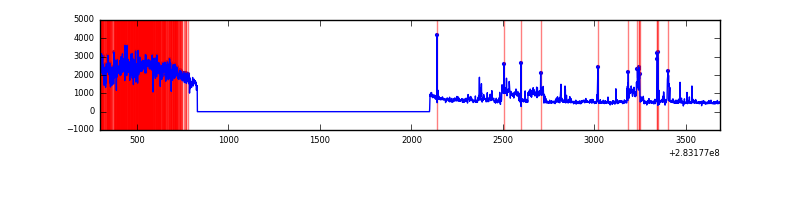 |
Top three noisy pixels from each quadrant. If the there are fewer than three noisy pixels in the level2.evt file, extra rows are filled as -1
| Pixel properties | Quadrant properties | ||||||
|---|---|---|---|---|---|---|---|
| Quadrant | DetID | PixID | Counts | Sigma | Mean | Median | Sigma |
| A | 15 | 174 | 98503 | 1595.95 | 299 | 292 | 61.5 |
| A | 0 | 226 | 2784 | 40.5 | 299 | 292 | 61.5 |
| A | 12 | 194 | 2324 | 33.02 | 299 | 292 | 61.5 |
| B | 0 | 230 | 13453 | 229.52 | 296 | 289 | 57.4 |
| B | 4 | 48 | 8711 | 146.84 | 296 | 289 | 57.4 |
| B | 12 | 111 | 6197 | 103.01 | 296 | 289 | 57.4 |
| C | 14 | 238 | 44026 | 657.43 | 284 | 285 | 66.5 |
| C | 5 | 218 | 17322 | 256.07 | 284 | 285 | 66.5 |
| C | 5 | 219 | 4608 | 64.97 | 284 | 285 | 66.5 |
| D | 1 | 52 | 1150639 | 18073.8 | 261 | 253 | 63.6 |
| D | 13 | 189 | 60441 | 945.62 | 261 | 253 | 63.6 |
| D | 7 | 238 | 27660 | 430.59 | 261 | 253 | 63.6 |
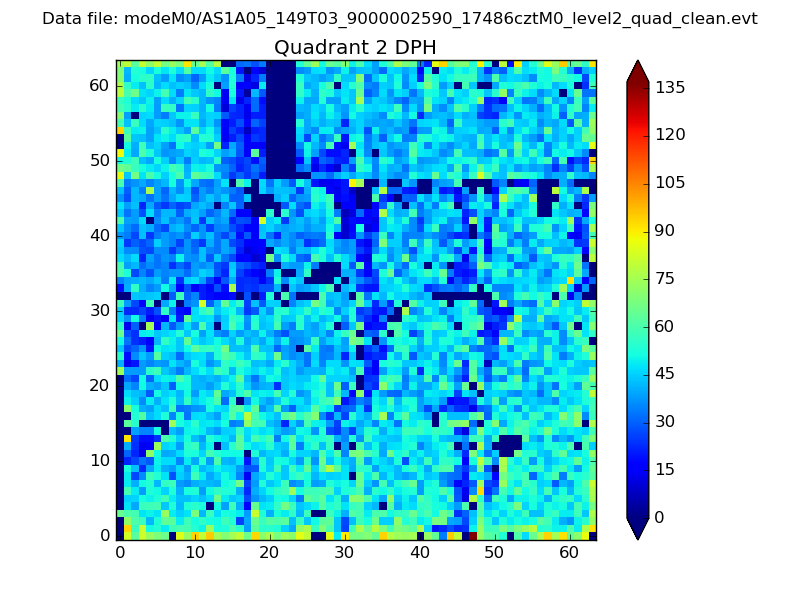
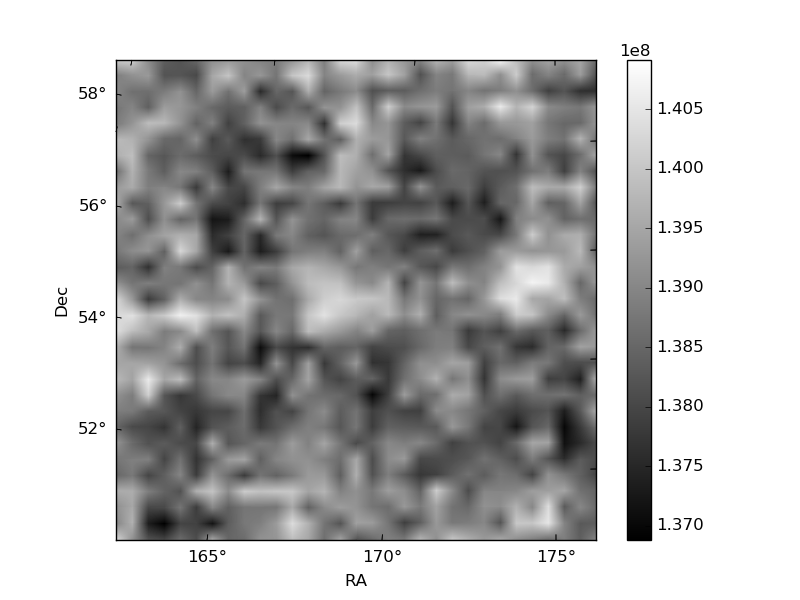
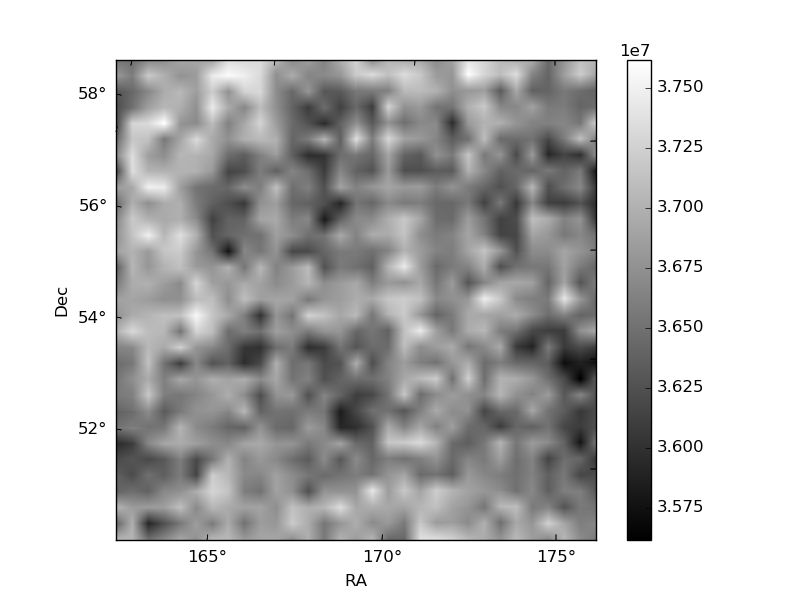
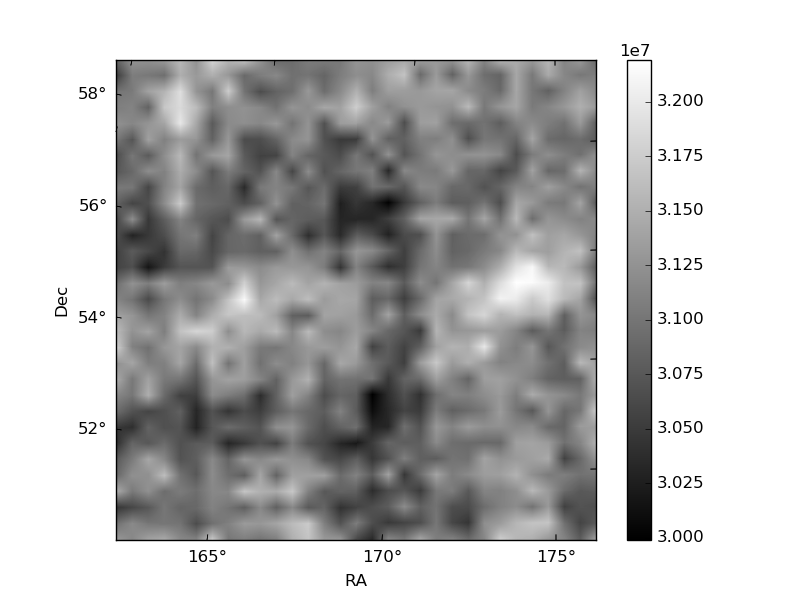
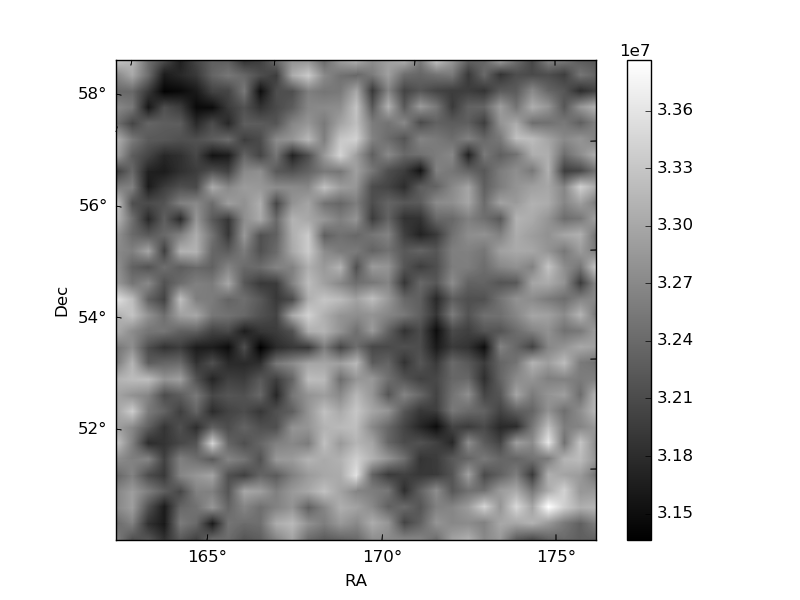
Histogram calculated using DETX and DETY for each event in the final _common_clean file
| Quadrant A | 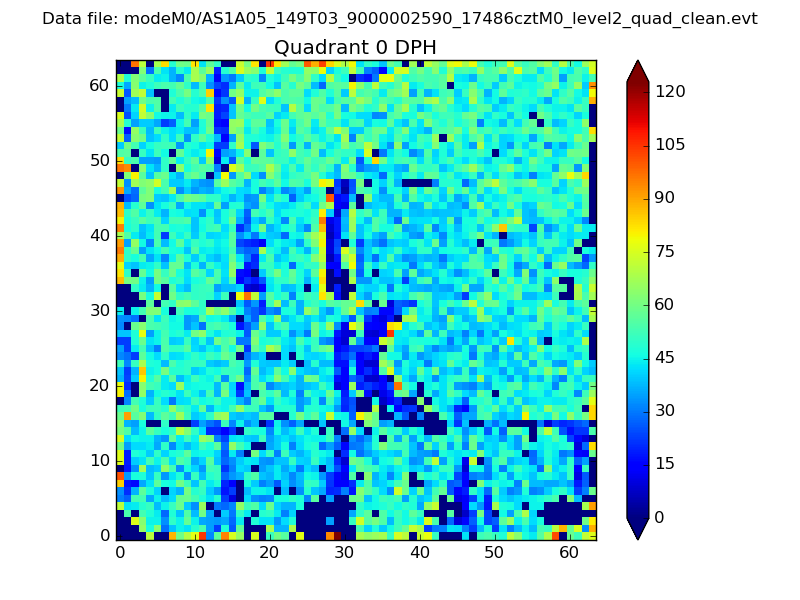 |
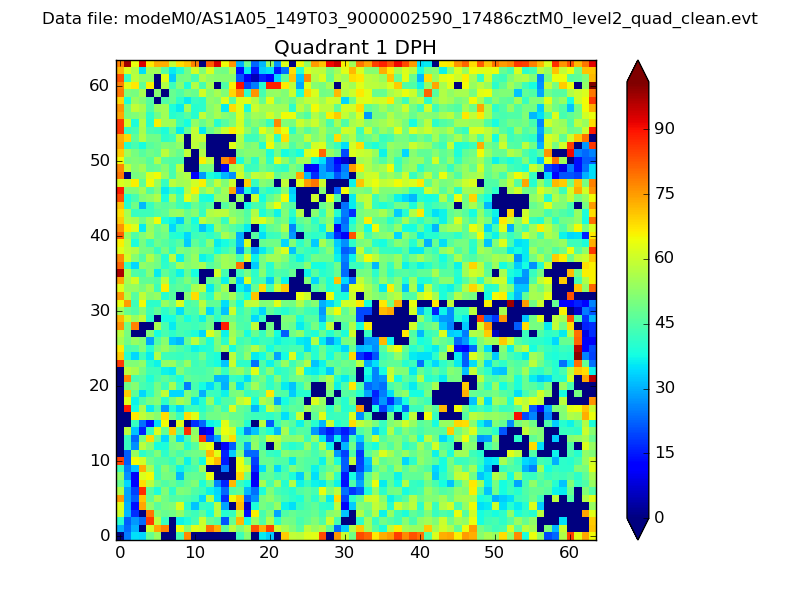 |
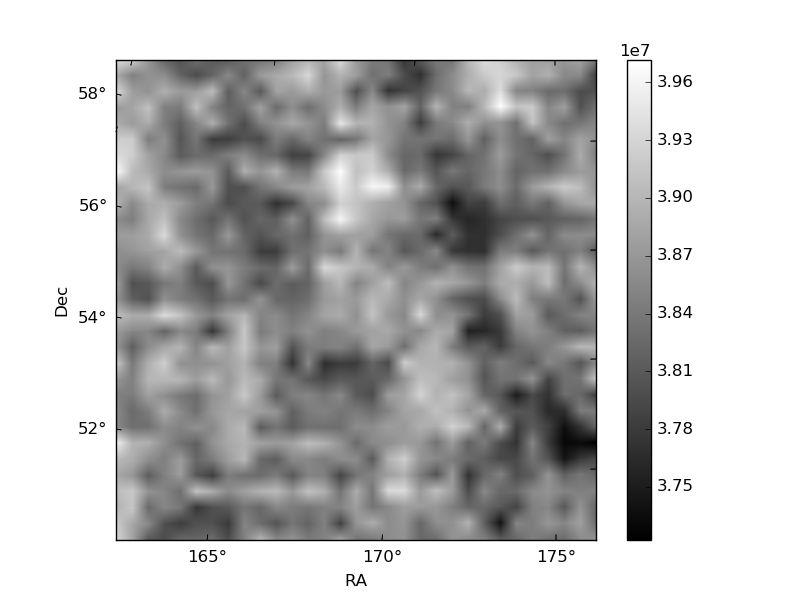
Quadrant B |
|---|---|---|---|
| Quadrant D | 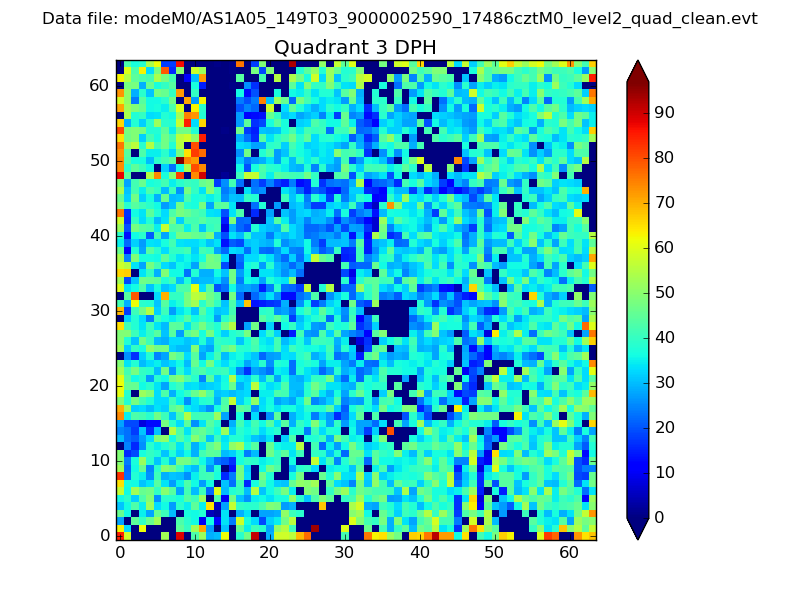 |
 |
Quadrant C |
| Plot type | Count rate plots | Images |
|---|---|---|
| Comparison with Poisson distribution Blue bars denote a histogram of data divided into 1 sec bins. Red curve is a Poisson curve with rate = median count rate of data. |
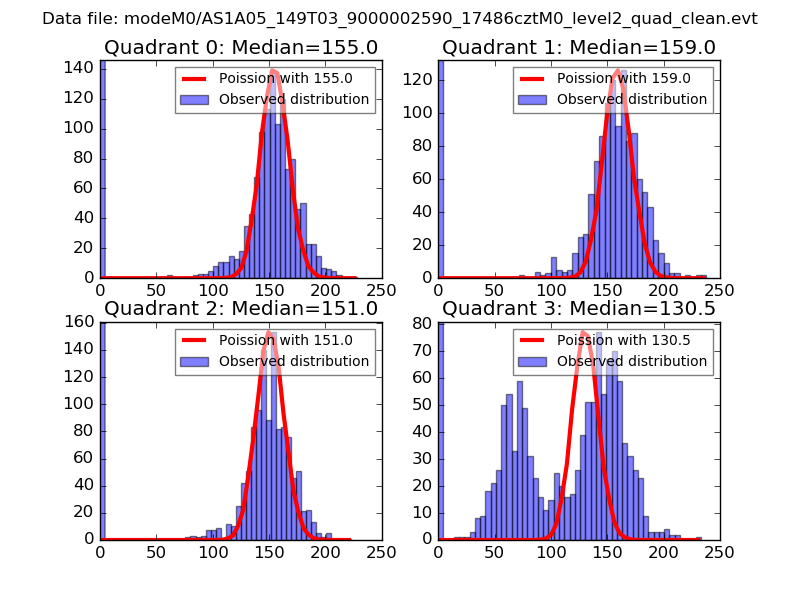 |
 |
| Quadrant-wise count rates Data is divided into 100 sec bins |
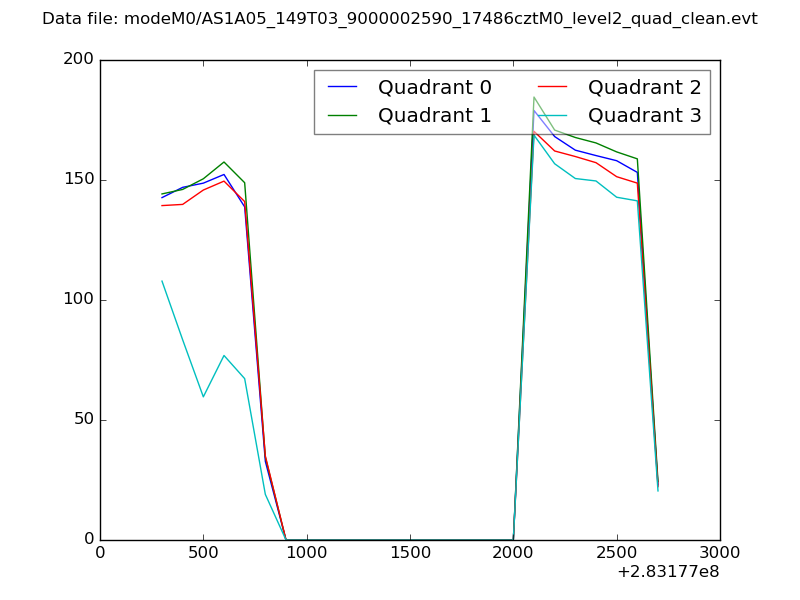 |
|
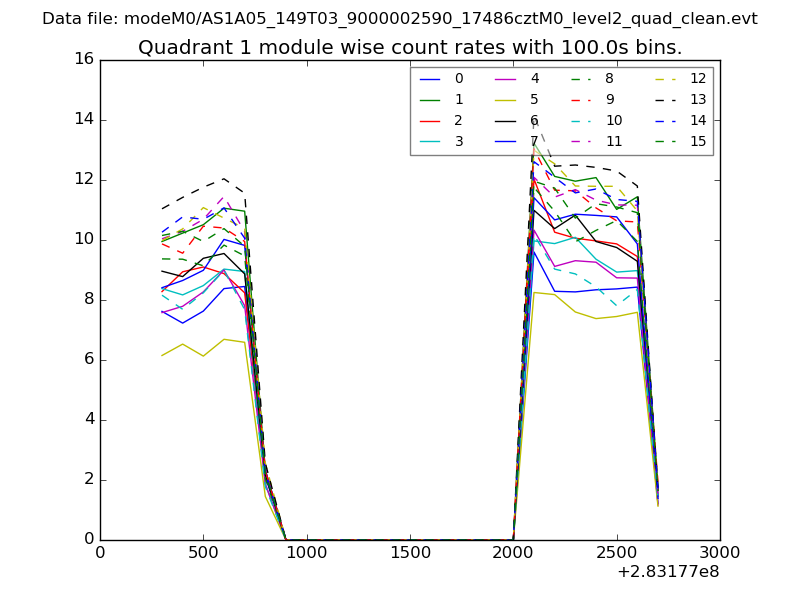
| Module-wise count rates for Quadrant A Data is divided into 100 sec bins |
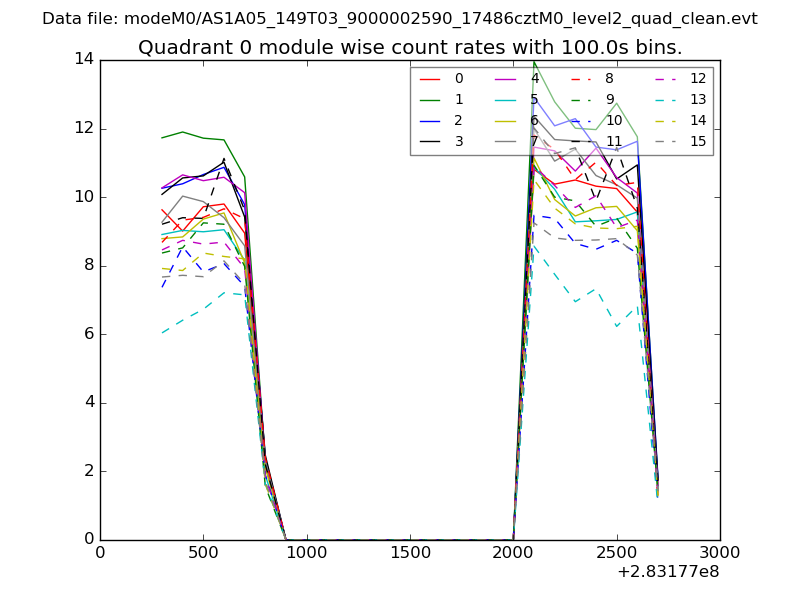 |
 |
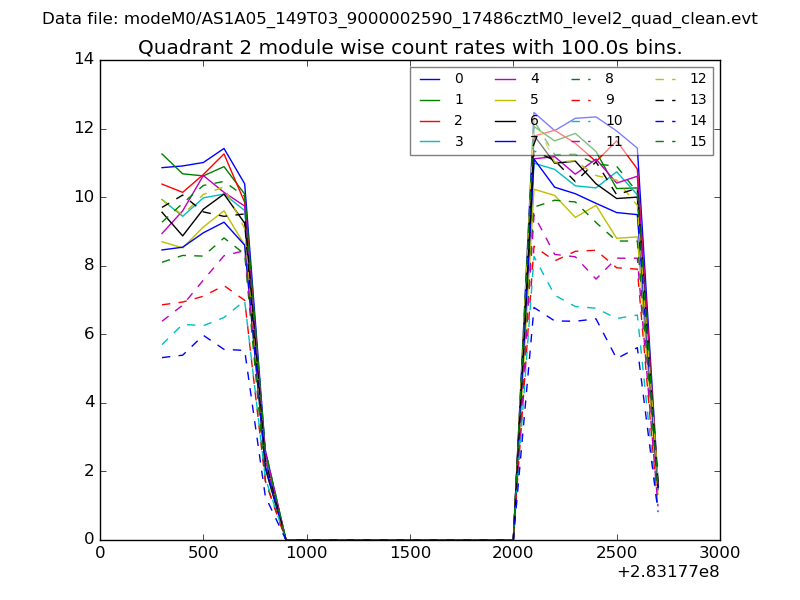
| Module-wise count rates for Quadrant B Data is divided into 100 sec bins |
 |
 |
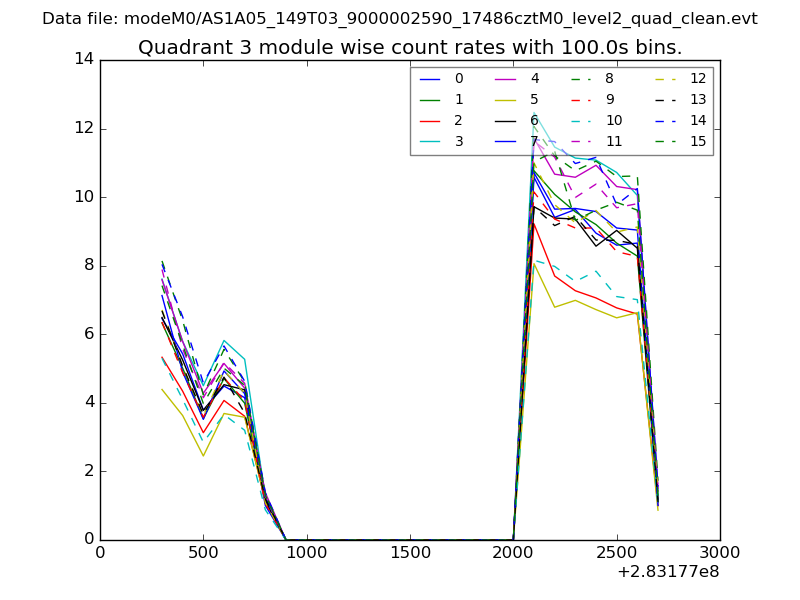
| Module-wise count rates for Quadrant C Data is divided into 100 sec bins |
 |
 |
| Module-wise count rates for Quadrant D Data is divided into 100 sec bins |
 |
 |
| Parameter | Plot |
|---|---|
| CZT HV Monitor | 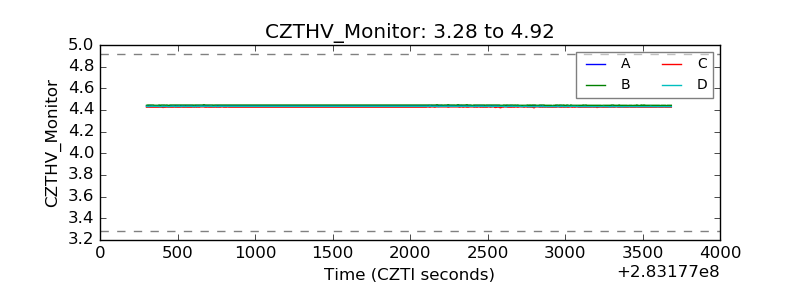 |
| D_VDD | 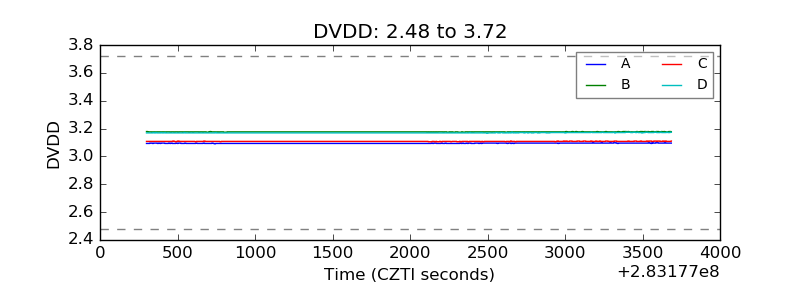 |
| Temperature 1 | 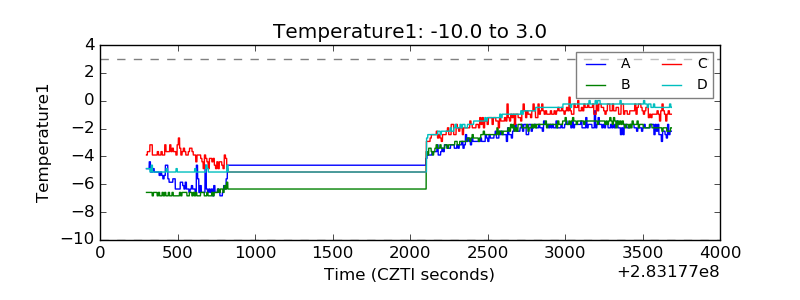 |
| Veto HV Monitor | 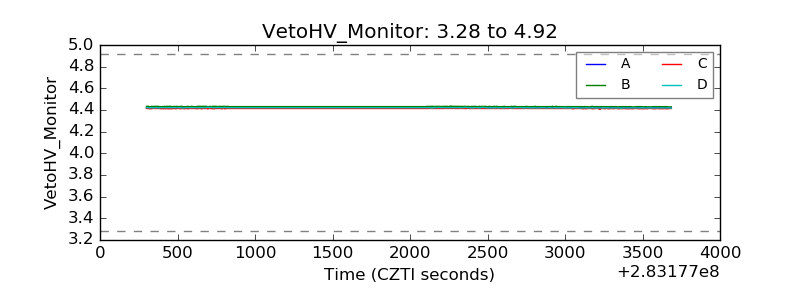 |
| Veto LLD | 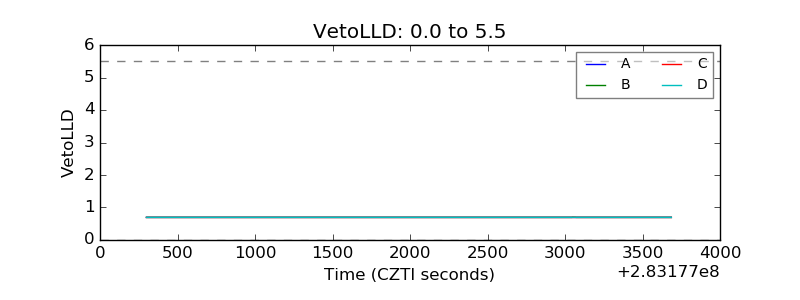 |
| Alpha Counter | 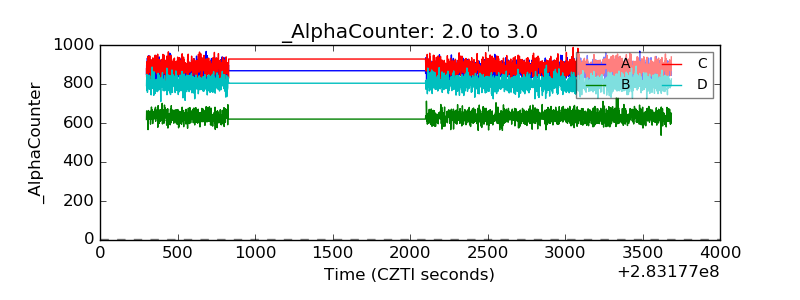 |
| _CPM_Rate | 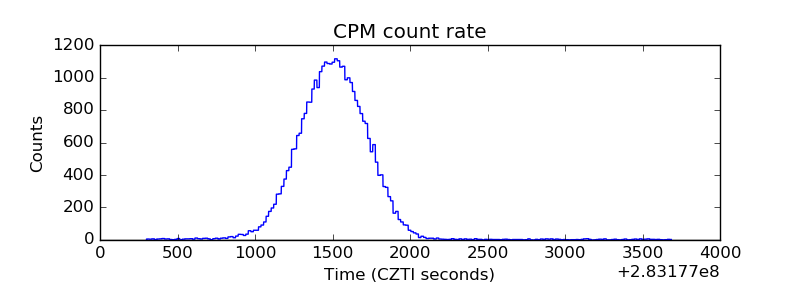 |
| CZT Counter | 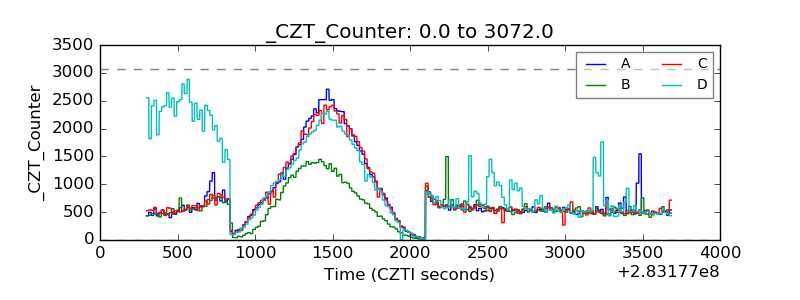 |
| +2.5 Volts monitor |  |
| +5 Volts monitor | 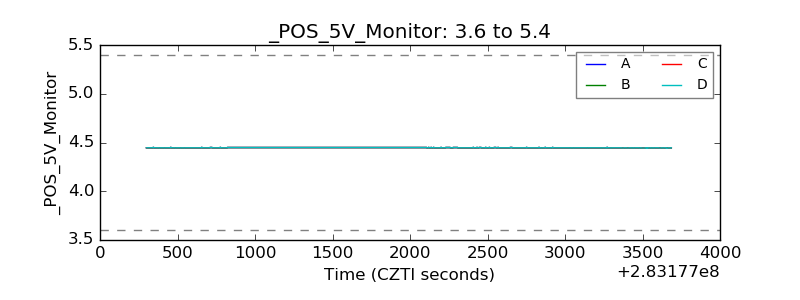 |
| _ROLL_ROT | 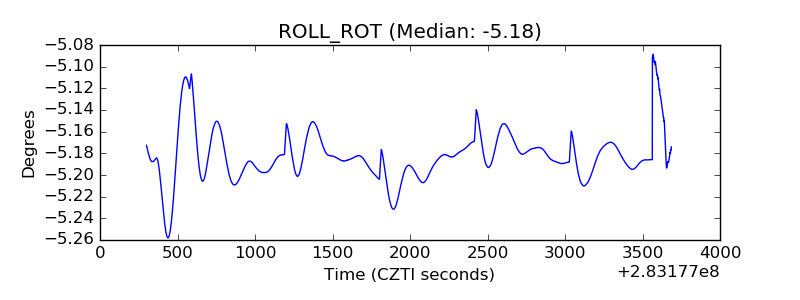 |
| _Roll_DEC | 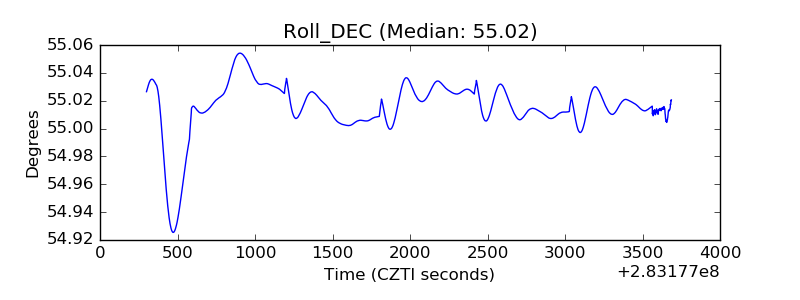 |
| _Roll_RA | 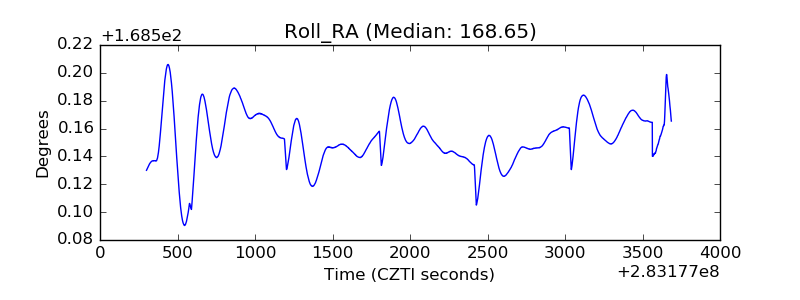 |
| Veto Counter | 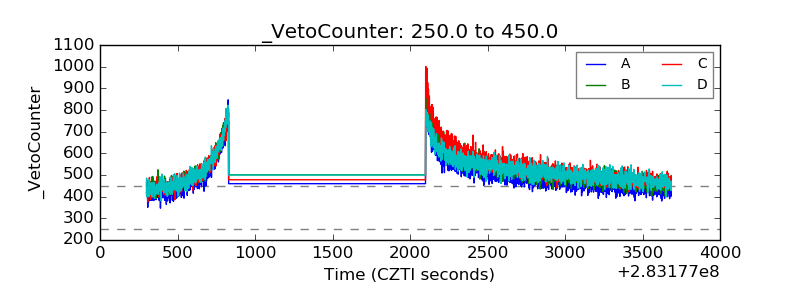 |