| Param | Original file | Final file |
|---|---|---|
| Filename | modeM0/AS1A05_149T03_9000002590_17487cztM0_level2.evt | modeM0/AS1A05_149T03_9000002590_17487cztM0_level2_quad_clean.evt |
| Size (bytes) | 564,327,360 | 85,406,400 |
| Size | 538.2 MB | 81.4 MB |
| Events in quadrant A | 3,423,597 | 548,577 |
| Events in quadrant B | 3,522,784 | 550,144 |
| Events in quadrant C | 3,462,554 | 530,362 |
| Events in quadrant D | 6,223,212 | 485,609 |
| Mode M0 | |||
|---|---|---|---|
| Quadrant | BADHDUFLAG | Total packets | Discarded packets |
| A | 0 | 14315 | 2 |
| B | 0 | 14582 | 2 |
| C | 0 | 14136 | 2 |
| D | 0 | 22930 | 2 |
| Mode M9 | |||
|---|---|---|---|
| Quadrant | BADHDUFLAG | Total packets | Discarded packets |
| A | 0 | 12 | 0 |
| B | 0 | 13 | 0 |
| C | 0 | 13 | 0 |
| D | 0 | 13 | 0 |
| Mode SS | |||
|---|---|---|---|
| Quadrant | BADHDUFLAG | Total packets | Discarded packets |
| A | 0 | 136 | 0 |
| B | 0 | 136 | 0 |
| C | 0 | 136 | 0 |
| D | 0 | 136 | 0 |
| Quadrant | Total seconds | Saturated seconds | Saturation percentage |
|---|---|---|---|
| A | 6767 | 133 | 1.965420% |
| B | 6767 | 112 | 1.655091% |
| C | 6767 | 138 | 2.039308% |
| D | 6767 | 836 | 12.354071% |
Noise dominated data is calculated using 1-second bins in cleaned event files. If a bin has >2000 counts, and if more than 50% of those come from <1% of pixels, then it is considered to be noise-dominated and hence unusable.
| Quadrant | # 1 sec bins | Bins with >0 counts | Bins with >2000 counts | High rate bins dominated by noise | Noise dominated (total time) | Noise dominated (detector-on time) | Marked lightcurve |
|---|---|---|---|---|---|---|---|
| A | 7837 | 6768 | 15 | 15 | 0.19% | 0.22% | 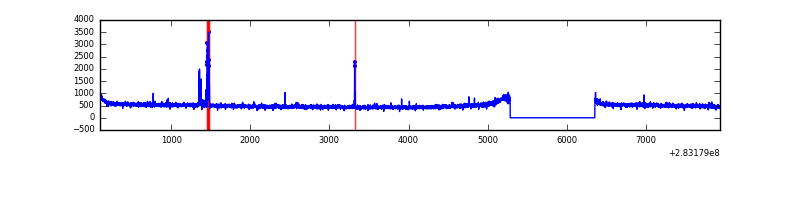 |
| B | 7837 | 6767 | 3 | 3 | 0.04% | 0.04% | 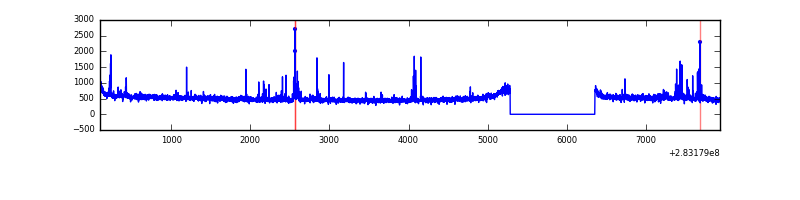 |
| C | 7837 | 6768 | 0 | 0 | 0.00% | 0.00% | 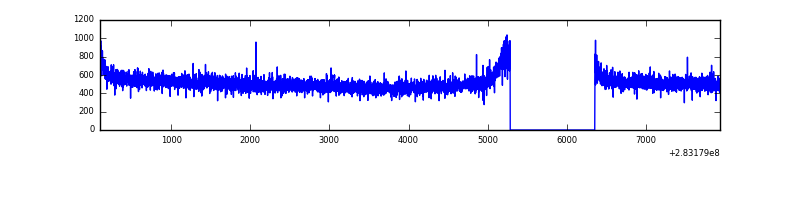 |
| D | 7837 | 6767 | 630 | 630 | 8.04% | 9.31% | 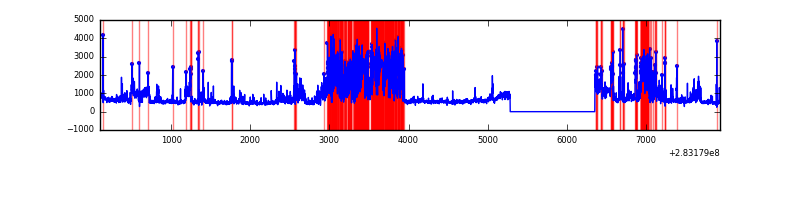 |
Top three noisy pixels from each quadrant. If the there are fewer than three noisy pixels in the level2.evt file, extra rows are filled as -1
| Pixel properties | Quadrant properties | ||||||
|---|---|---|---|---|---|---|---|
| Quadrant | DetID | PixID | Counts | Sigma | Mean | Median | Sigma |
| A | 15 | 174 | 81366 | 467.37 | 866 | 849 | 172.3 |
| A | 0 | 226 | 7766 | 40.15 | 866 | 849 | 172.3 |
| A | 12 | 194 | 6463 | 32.59 | 866 | 849 | 172.3 |
| B | 7 | 220 | 40813 | 248.02 | 859 | 840 | 161.2 |
| B | 4 | 142 | 20516 | 122.08 | 859 | 840 | 161.2 |
| B | 0 | 197 | 19450 | 115.47 | 859 | 840 | 161.2 |
| C | 14 | 238 | 128824 | 675.04 | 828 | 834 | 189.6 |
| C | 5 | 218 | 72660 | 378.82 | 828 | 834 | 189.6 |
| C | 5 | 219 | 19445 | 98.16 | 828 | 834 | 189.6 |
| D | 13 | 189 | 1567148 | 7404.73 | 803 | 788 | 211.5 |
| D | 1 | 52 | 749779 | 3540.74 | 803 | 788 | 211.5 |
| D | 11 | 176 | 419927 | 1981.42 | 803 | 788 | 211.5 |
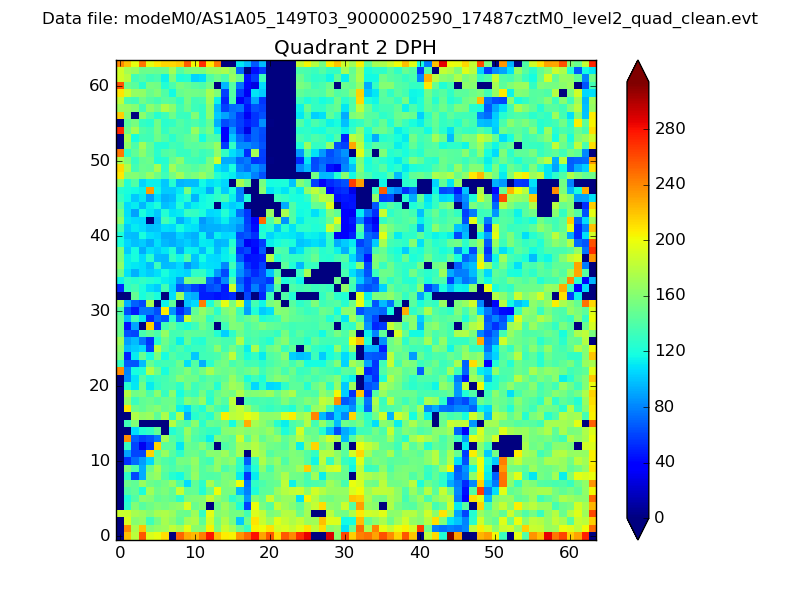
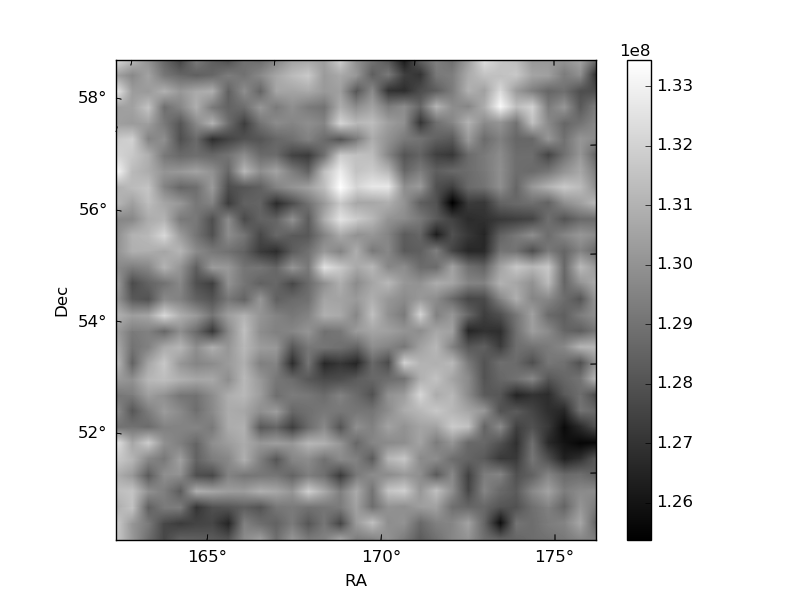
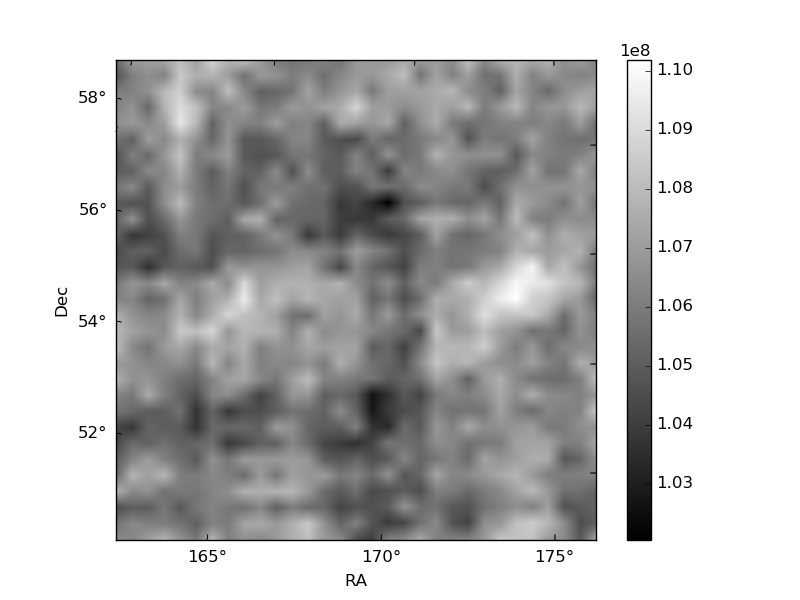
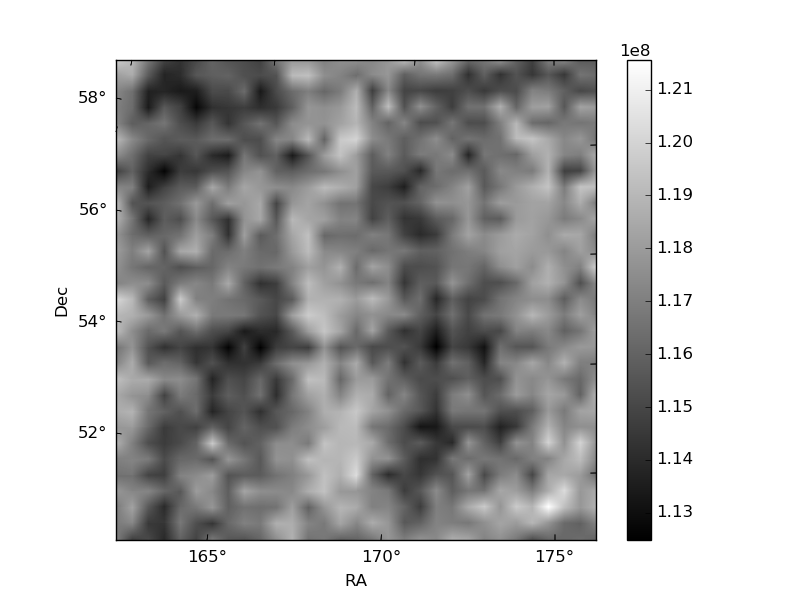
Histogram calculated using DETX and DETY for each event in the final _common_clean file
| Quadrant A | 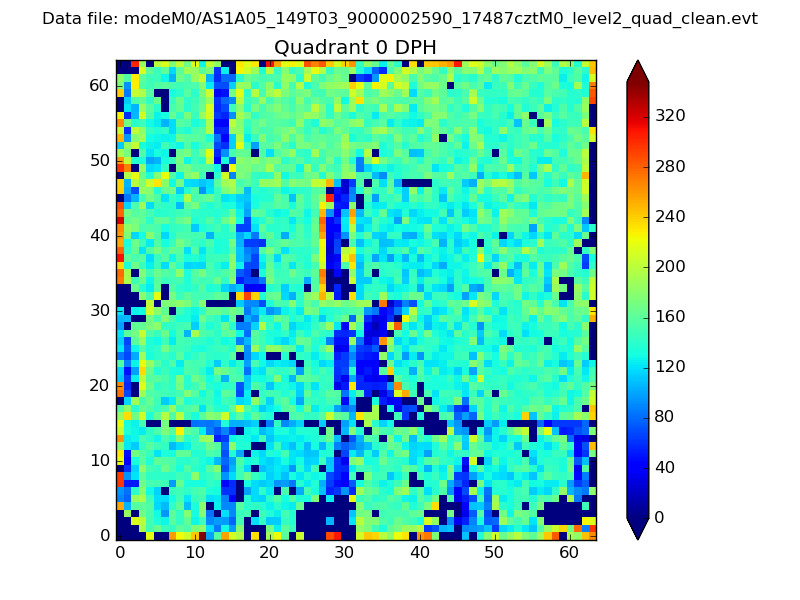 |
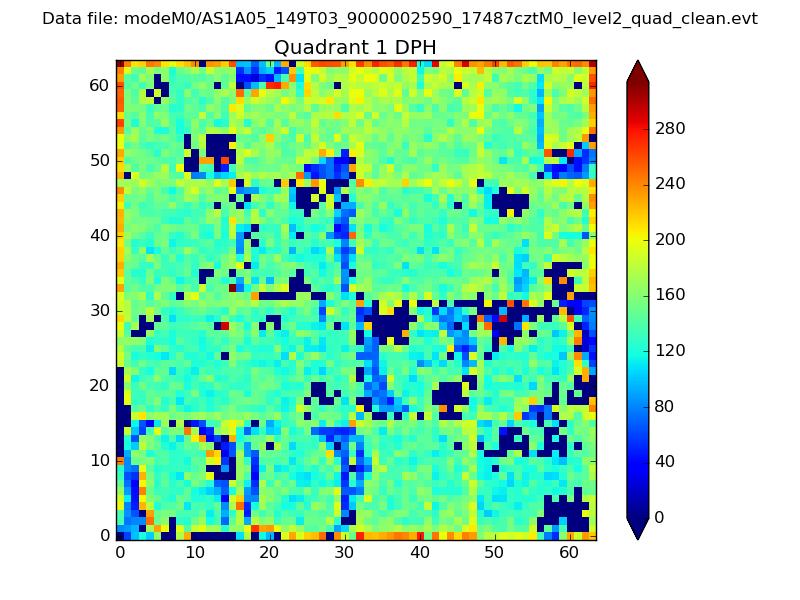 |
Quadrant B |
|---|---|---|---|
| Quadrant D | 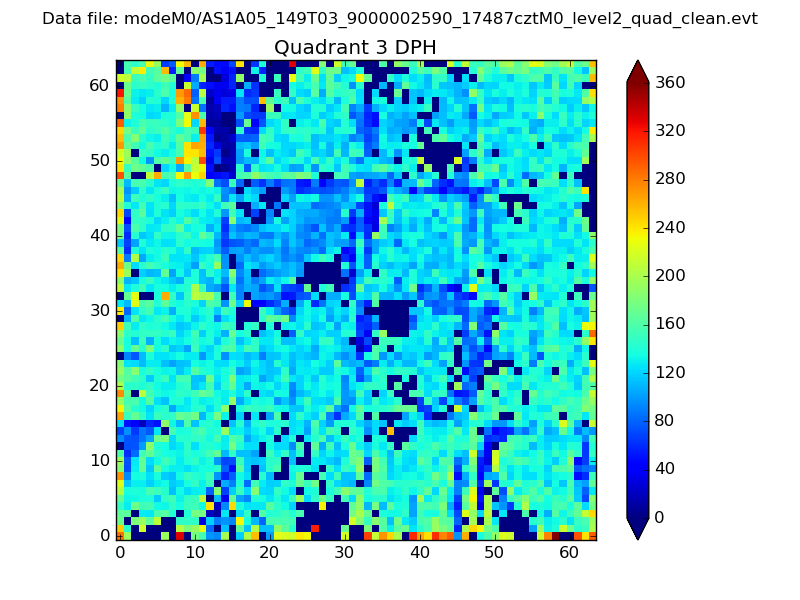 |
 |
Quadrant C |
| Plot type | Count rate plots | Images |
|---|---|---|
| Comparison with Poisson distribution Blue bars denote a histogram of data divided into 1 sec bins. Red curve is a Poisson curve with rate = median count rate of data. |
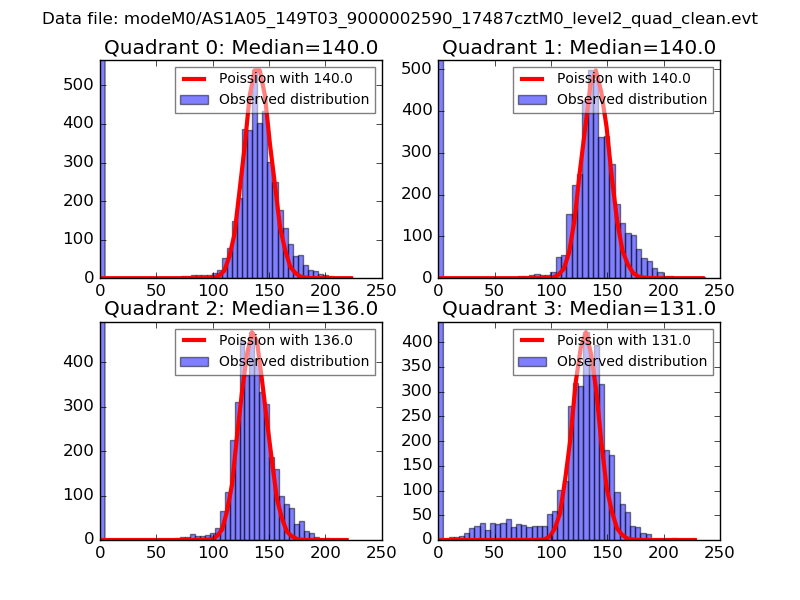 |
 |
| Quadrant-wise count rates Data is divided into 100 sec bins |
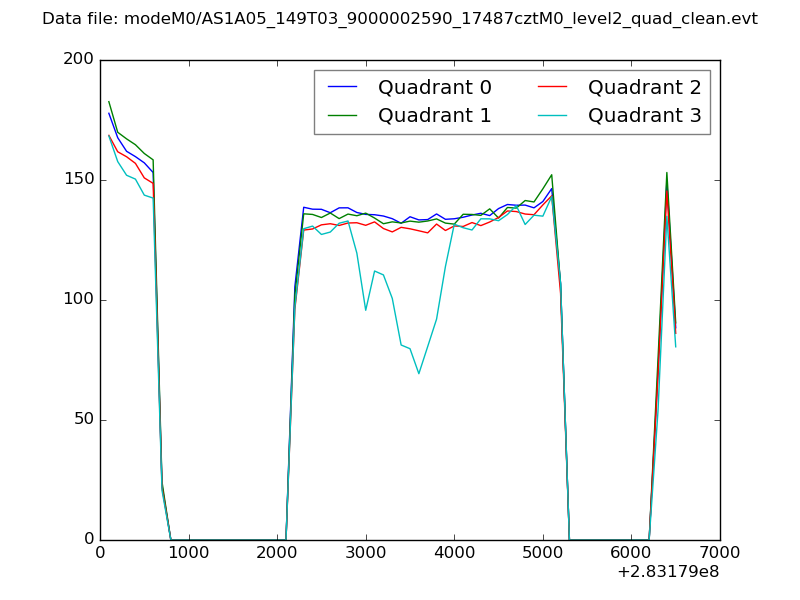 |
|
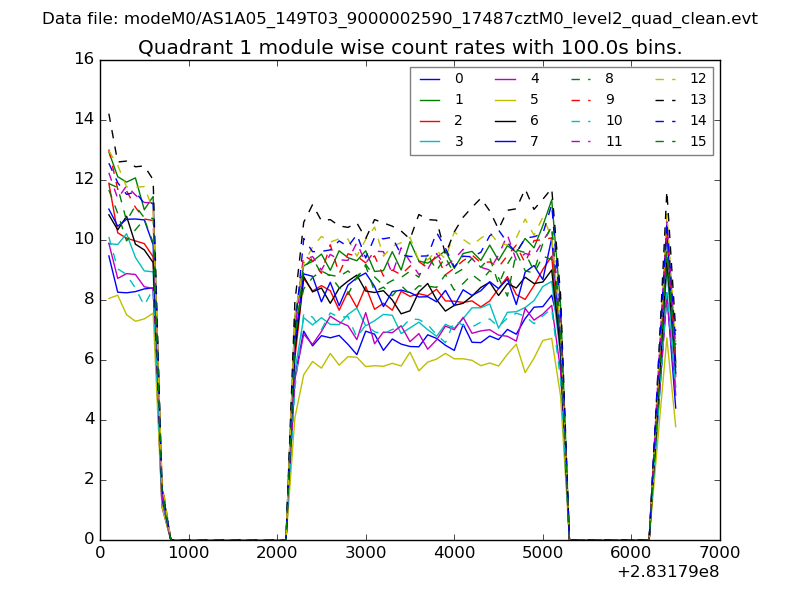
| Module-wise count rates for Quadrant A Data is divided into 100 sec bins |
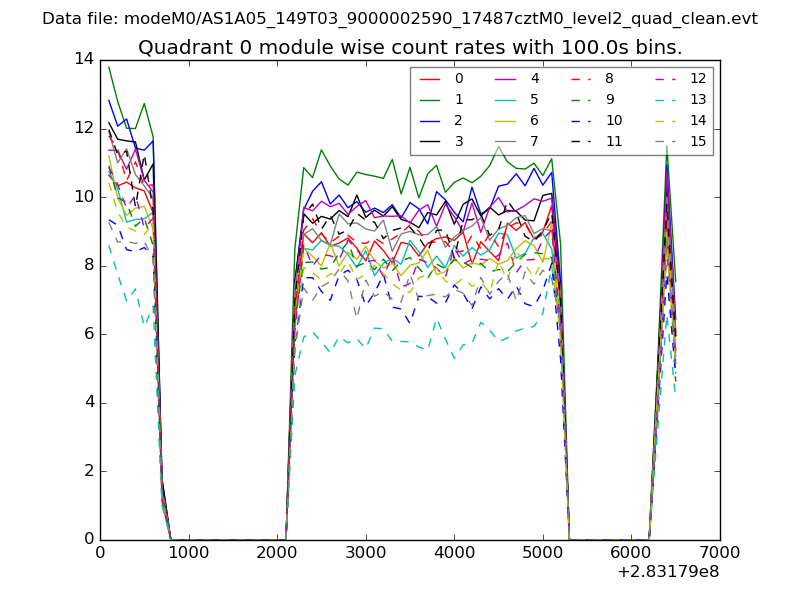 |
 |
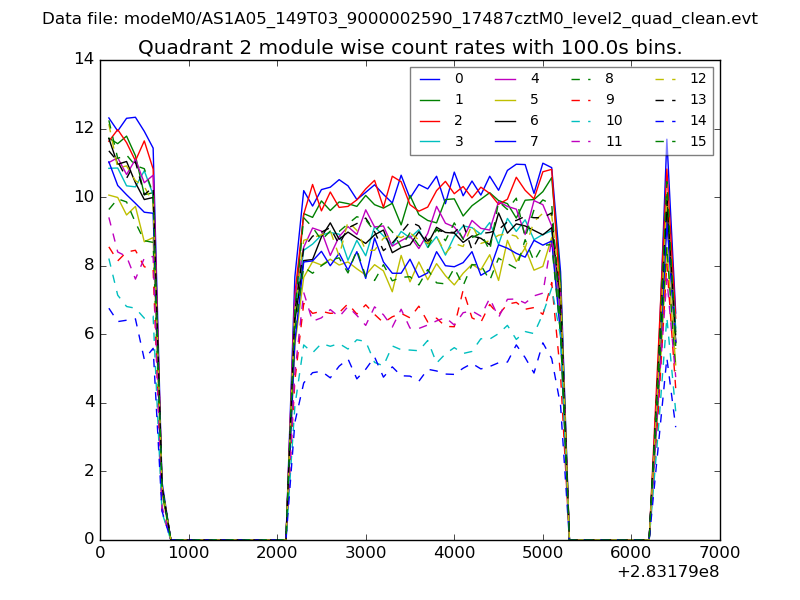
| Module-wise count rates for Quadrant B Data is divided into 100 sec bins |
 |
 |
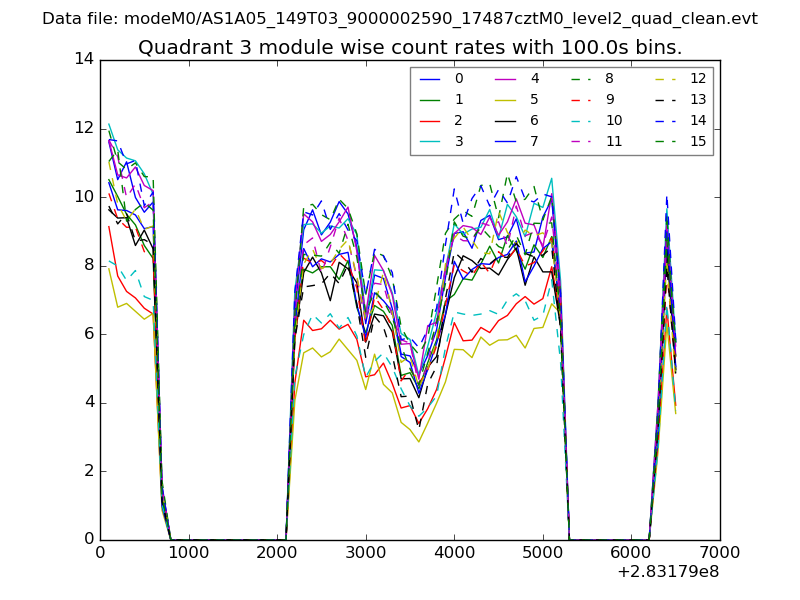
| Module-wise count rates for Quadrant C Data is divided into 100 sec bins |
 |
 |
| Module-wise count rates for Quadrant D Data is divided into 100 sec bins |
 |
 |
| Parameter | Plot |
|---|---|
| CZT HV Monitor | 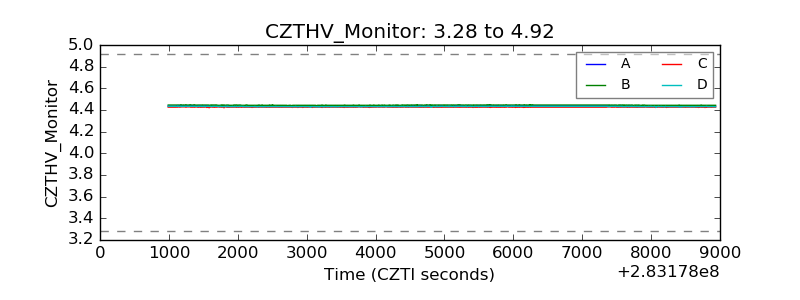 |
| D_VDD |  |
| Temperature 1 | 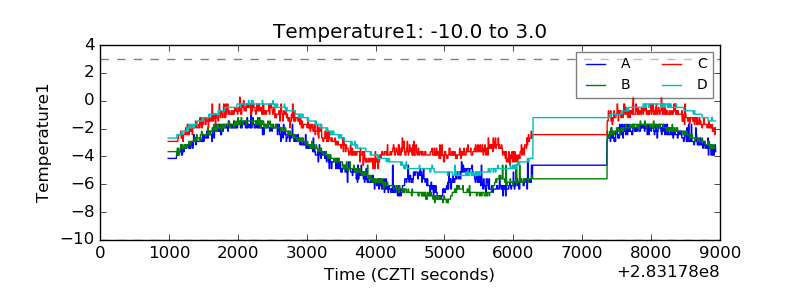 |
| Veto HV Monitor | 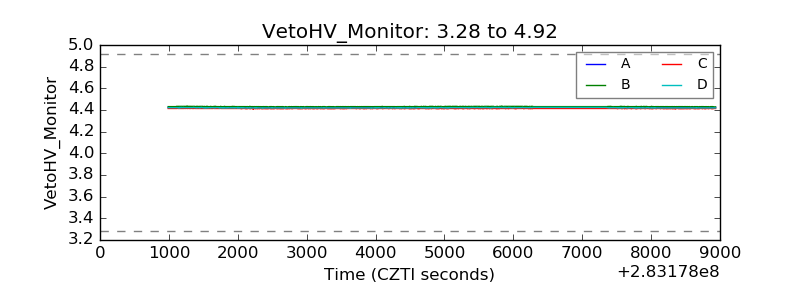 |
| Veto LLD | 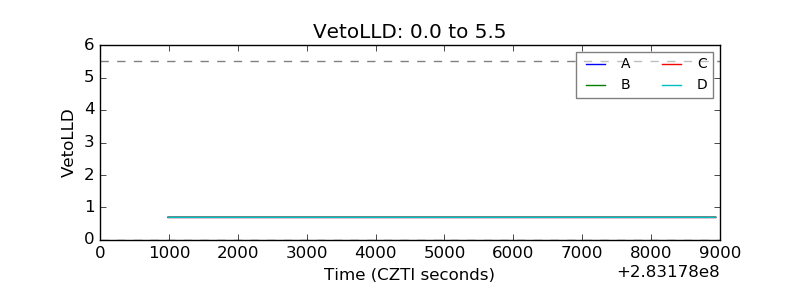 |
| Alpha Counter | 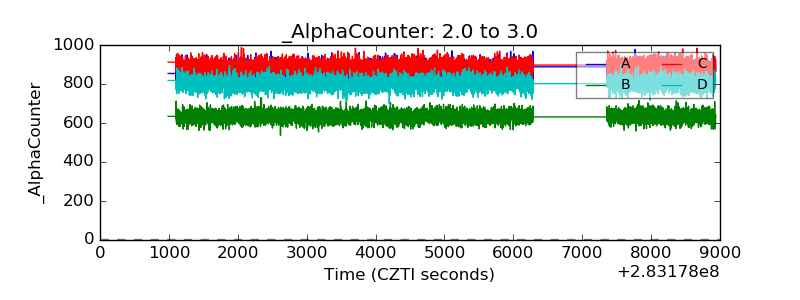 |
| _CPM_Rate |  |
| CZT Counter |  |
| +2.5 Volts monitor |  |
| +5 Volts monitor |  |
| _ROLL_ROT | 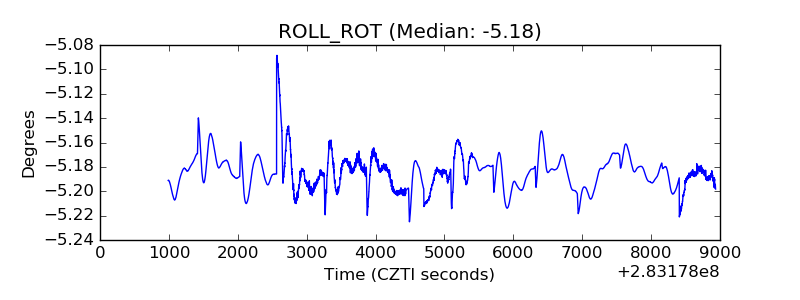 |
| _Roll_DEC | 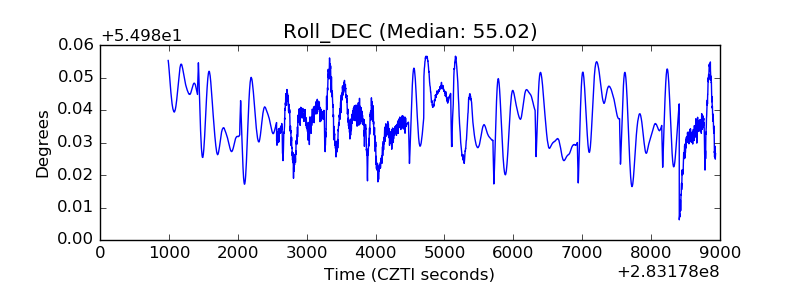 |
| _Roll_RA |  |
| Veto Counter | 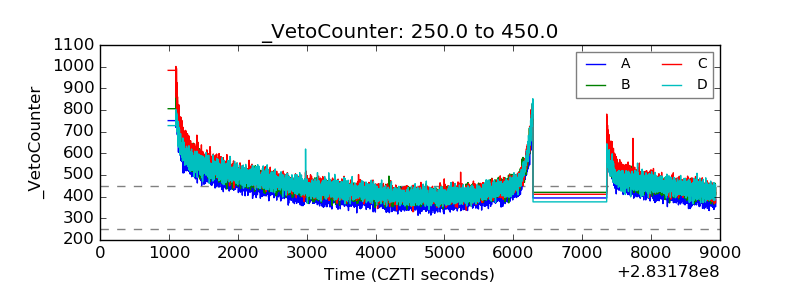 |