| Param | Original file | Final file |
|---|---|---|
| Filename | modeM0/AS1A05_149T03_9000002590_17488cztM0_level2.evt | modeM0/AS1A05_149T03_9000002590_17488cztM0_level2_quad_clean.evt |
| Size (bytes) | 575,386,560 | 83,044,800 |
| Size | 548.7 MB | 79.2 MB |
| Events in quadrant A | 3,307,446 | 531,239 |
| Events in quadrant B | 3,518,471 | 530,535 |
| Events in quadrant C | 3,397,738 | 514,499 |
| Events in quadrant D | 6,732,077 | 455,306 |
| Mode M0 | |||
|---|---|---|---|
| Quadrant | BADHDUFLAG | Total packets | Discarded packets |
| A | 0 | 14312 | 2 |
| B | 0 | 14918 | 2 |
| C | 0 | 14269 | 2 |
| D | 0 | 24603 | 2 |
| Mode M9 | |||
|---|---|---|---|
| Quadrant | BADHDUFLAG | Total packets | Discarded packets |
| A | 0 | 7 | 0 |
| B | 0 | 7 | 0 |
| C | 0 | 7 | 0 |
| D | 0 | 7 | 0 |
| Mode SS | |||
|---|---|---|---|
| Quadrant | BADHDUFLAG | Total packets | Discarded packets |
| A | 0 | 140 | 0 |
| B | 0 | 140 | 0 |
| C | 0 | 140 | 0 |
| D | 0 | 140 | 0 |
| Quadrant | Total seconds | Saturated seconds | Saturation percentage |
|---|---|---|---|
| A | 6931 | 93 | 1.341798% |
| B | 6931 | 109 | 1.572645% |
| C | 6930 | 108 | 1.558442% |
| D | 6930 | 1268 | 18.297258% |
Noise dominated data is calculated using 1-second bins in cleaned event files. If a bin has >2000 counts, and if more than 50% of those come from <1% of pixels, then it is considered to be noise-dominated and hence unusable.
| Quadrant | # 1 sec bins | Bins with >0 counts | Bins with >2000 counts | High rate bins dominated by noise | Noise dominated (total time) | Noise dominated (detector-on time) | Marked lightcurve |
|---|---|---|---|---|---|---|---|
| A | 7616 | 6931 | 0 | 0 | 0.00% | 0.00% | 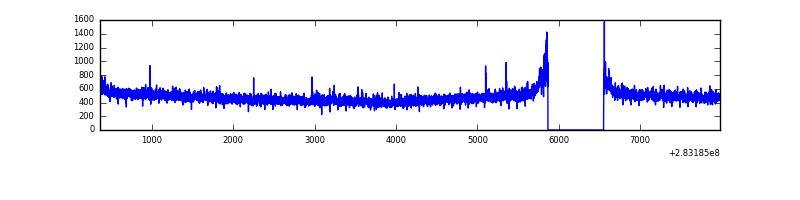 |
| B | 7616 | 6932 | 5 | 5 | 0.07% | 0.07% | 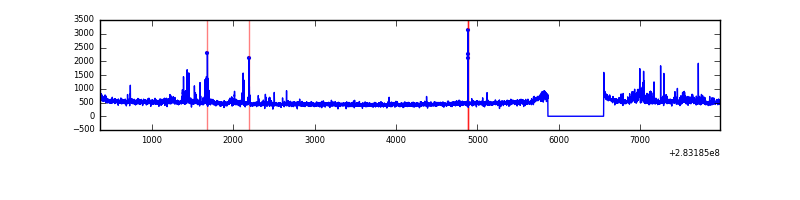 |
| C | 7615 | 6931 | 0 | 0 | 0.00% | 0.00% | 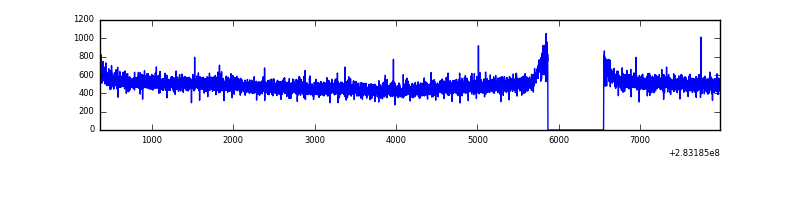 |
| D | 7614 | 6929 | 952 | 952 | 12.50% | 13.74% | 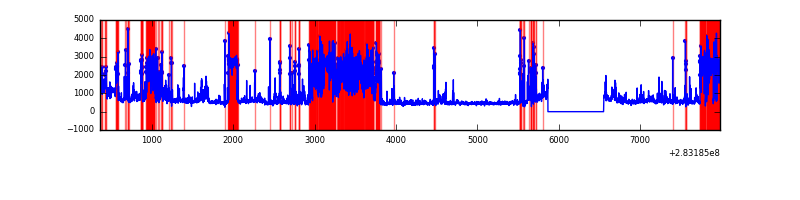 |
Top three noisy pixels from each quadrant. If the there are fewer than three noisy pixels in the level2.evt file, extra rows are filled as -1
| Pixel properties | Quadrant properties | ||||||
|---|---|---|---|---|---|---|---|
| Quadrant | DetID | PixID | Counts | Sigma | Mean | Median | Sigma |
| A | 4 | 2 | 20264 | 113.52 | 852 | 833 | 171.2 |
| A | 0 | 226 | 7480 | 38.83 | 852 | 833 | 171.2 |
| A | 15 | 174 | 7473 | 38.79 | 852 | 833 | 171.2 |
| B | 4 | 216 | 77022 | 477.83 | 847 | 827 | 159.5 |
| B | 7 | 220 | 67751 | 419.69 | 847 | 827 | 159.5 |
| B | 0 | 189 | 19562 | 117.49 | 847 | 827 | 159.5 |
| C | 14 | 238 | 125541 | 661.32 | 815 | 818 | 188.6 |
| C | 5 | 218 | 63889 | 334.42 | 815 | 818 | 188.6 |
| C | 3 | 233 | 12276 | 60.75 | 815 | 818 | 188.6 |
| D | 13 | 189 | 1629542 | 8099.49 | 755 | 739 | 201.1 |
| D | 1 | 52 | 728655 | 3619.68 | 755 | 739 | 201.1 |
| D | 15 | 0 | 469259 | 2329.79 | 755 | 739 | 201.1 |
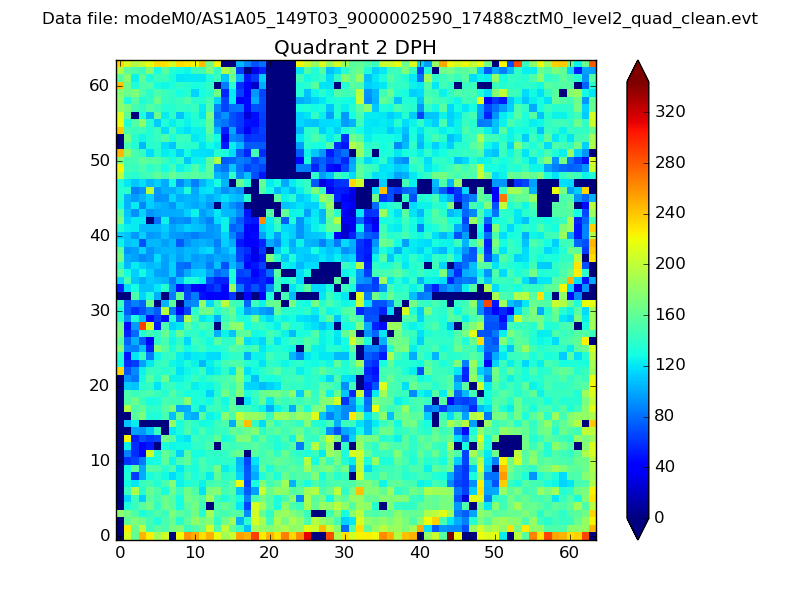
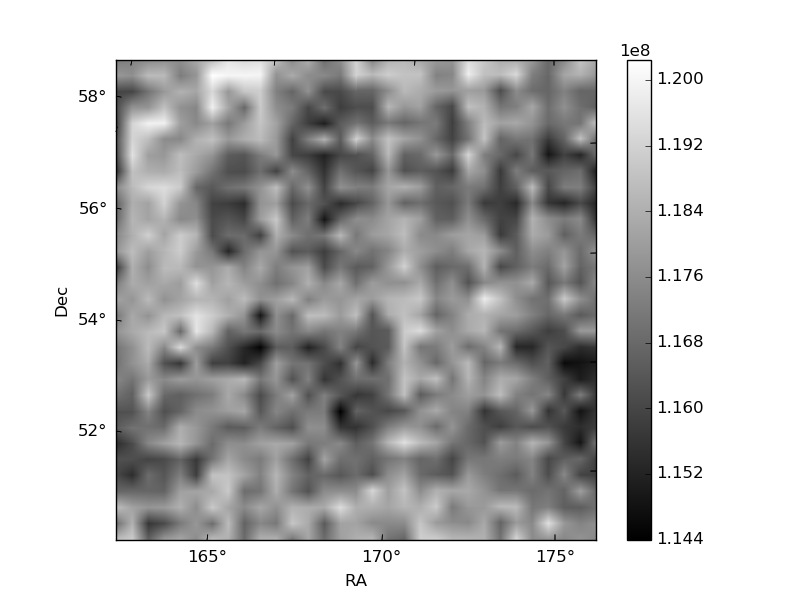
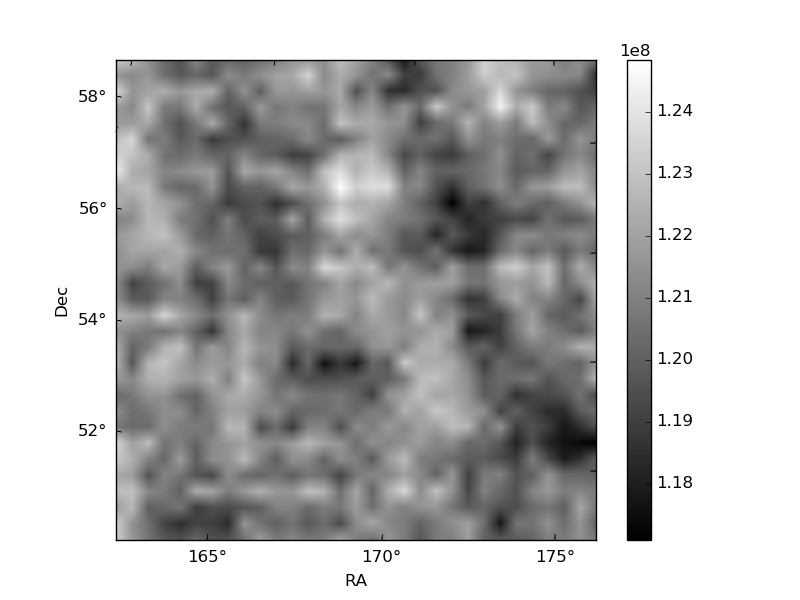
Histogram calculated using DETX and DETY for each event in the final _common_clean file
| Quadrant A | 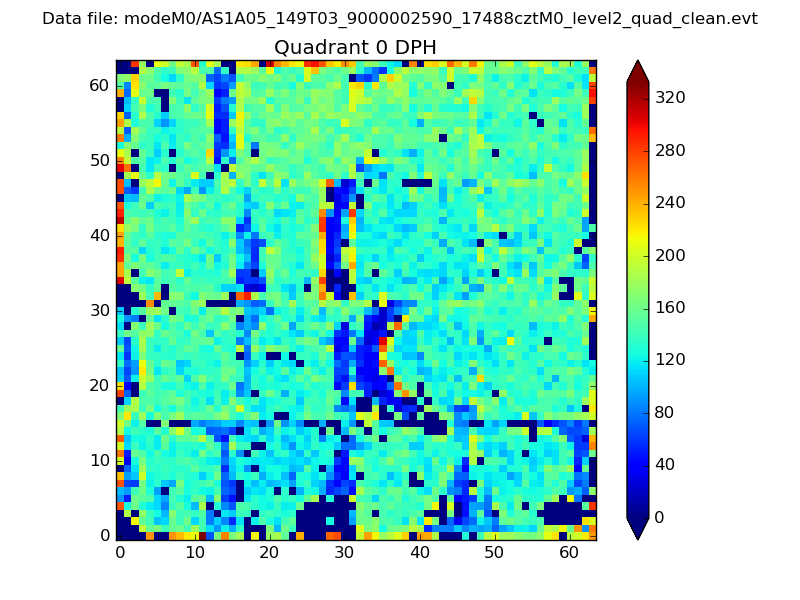 |
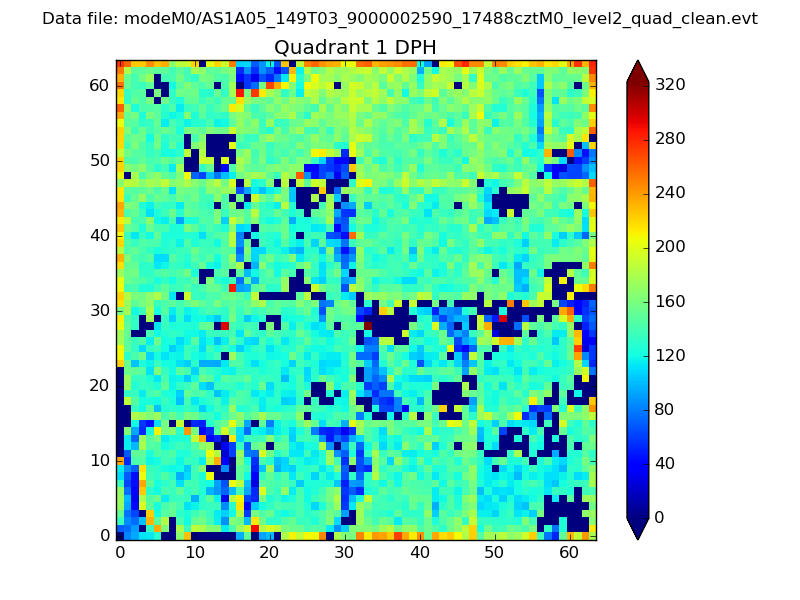 |
Quadrant B |
|---|---|---|---|
| Quadrant D | 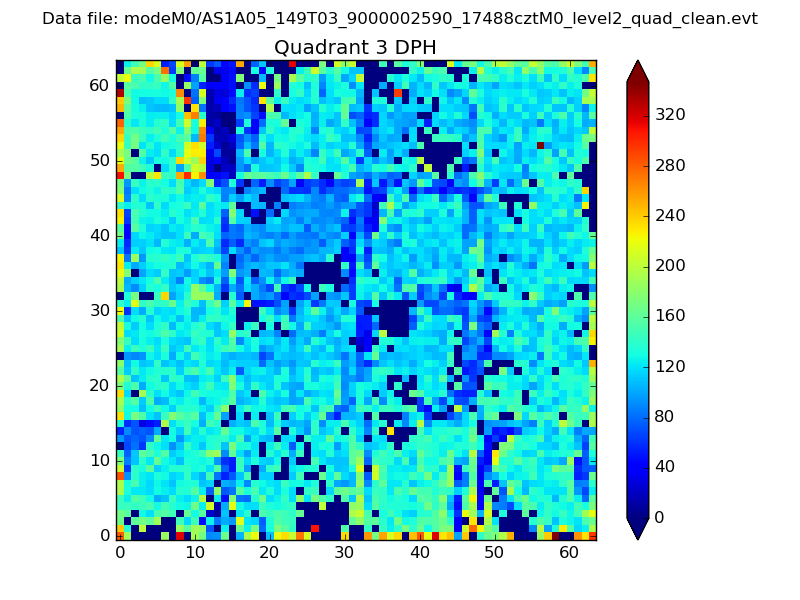 |
 |
Quadrant C |
| Plot type | Count rate plots | Images |
|---|---|---|
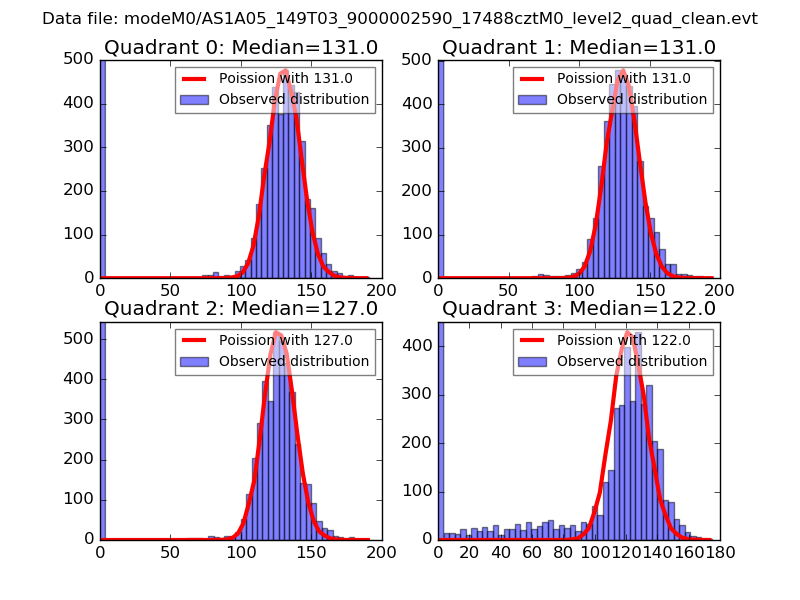
| Comparison with Poisson distribution Blue bars denote a histogram of data divided into 1 sec bins. Red curve is a Poisson curve with rate = median count rate of data. |
 |
 |
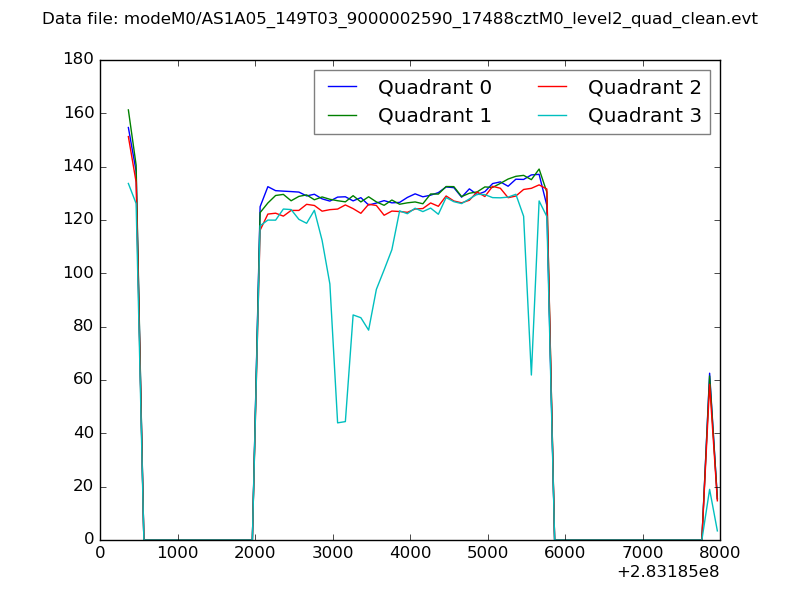
| Quadrant-wise count rates Data is divided into 100 sec bins |
 |
|
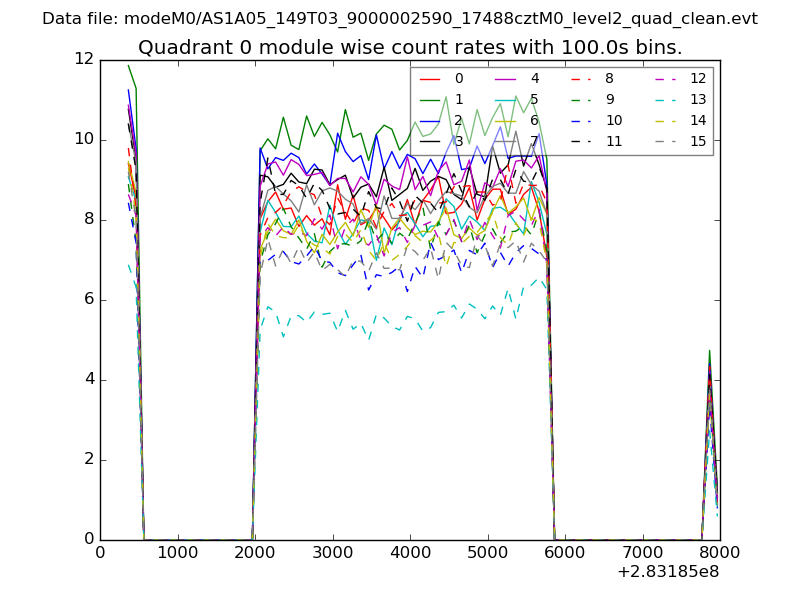
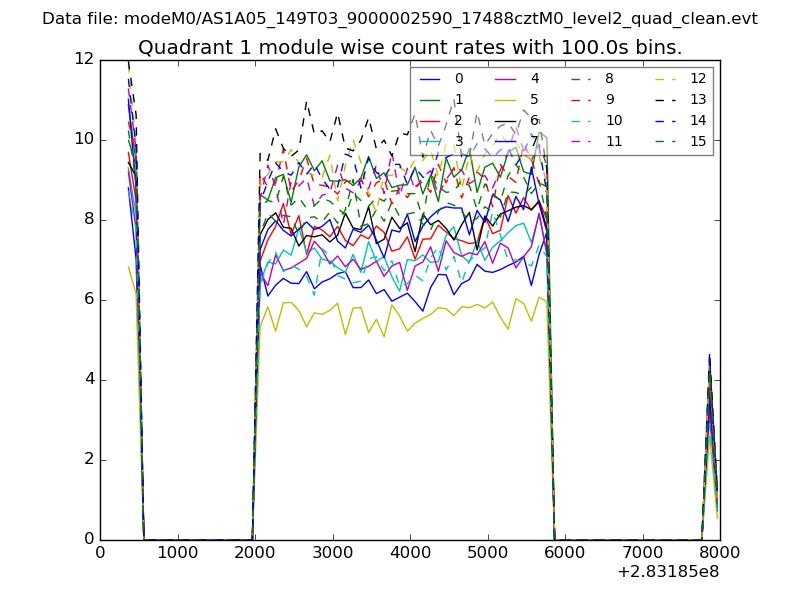
| Module-wise count rates for Quadrant A Data is divided into 100 sec bins |
 |
 |
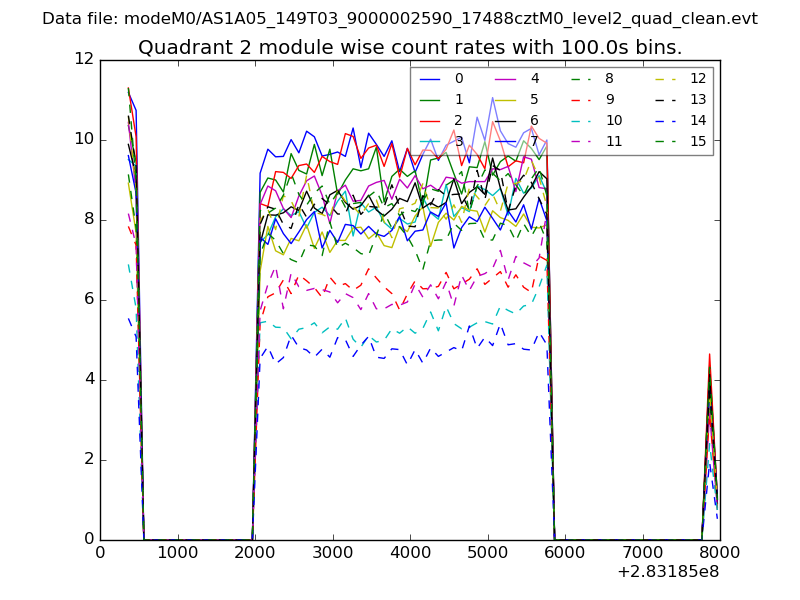
| Module-wise count rates for Quadrant B Data is divided into 100 sec bins |
 |
 |
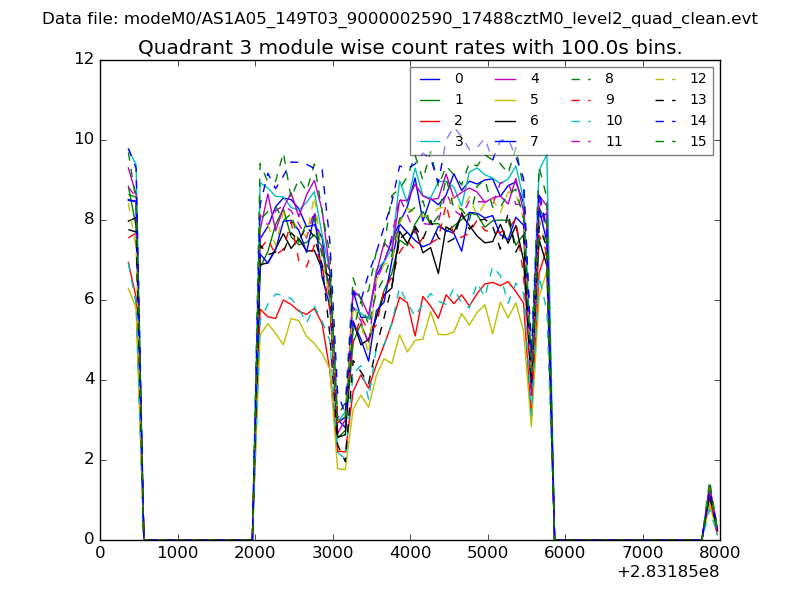
| Module-wise count rates for Quadrant C Data is divided into 100 sec bins |
 |
 |
| Module-wise count rates for Quadrant D Data is divided into 100 sec bins |
 |
 |
| Parameter | Plot |
|---|---|
| CZT HV Monitor | 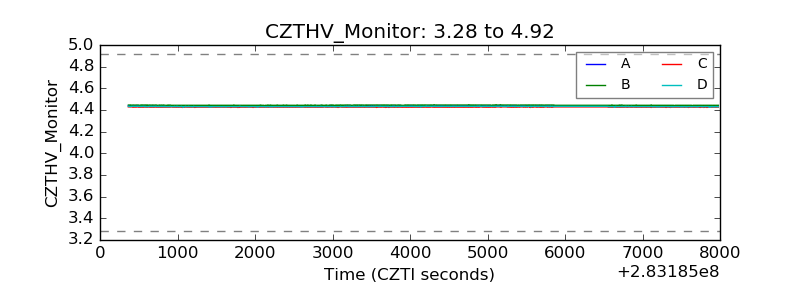 |
| D_VDD | 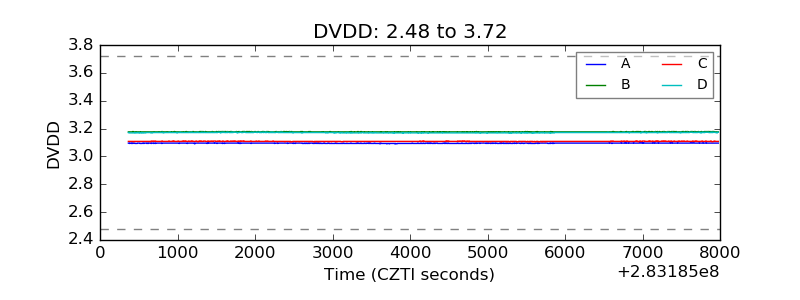 |
| Temperature 1 | 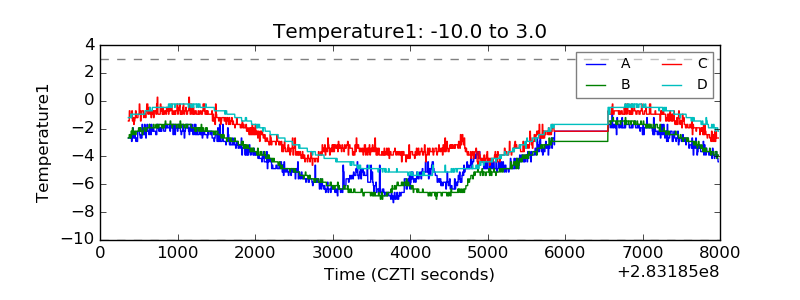 |
| Veto HV Monitor | 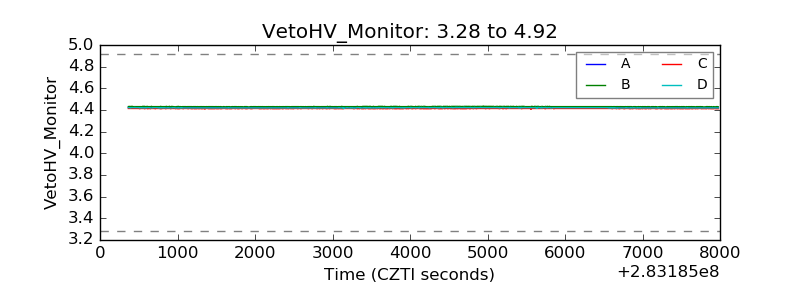 |
| Veto LLD | 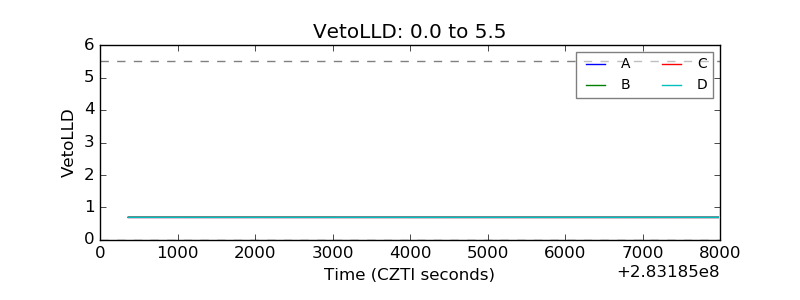 |
| Alpha Counter | 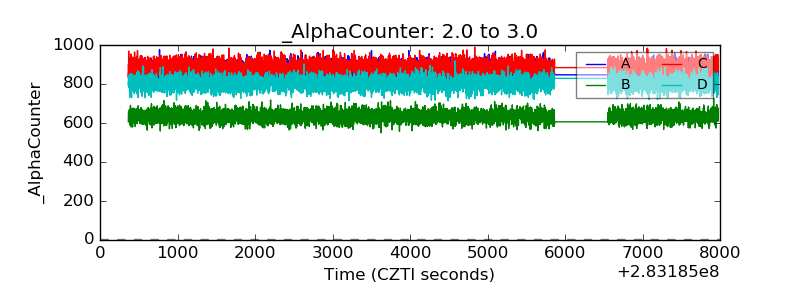 |
| _CPM_Rate | 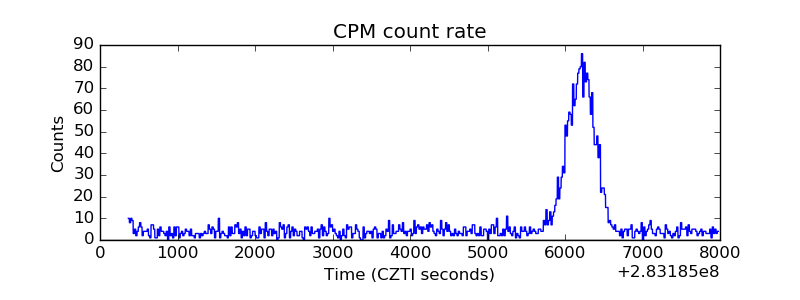 |
| CZT Counter |  |
| +2.5 Volts monitor |  |
| +5 Volts monitor |  |
| _ROLL_ROT | 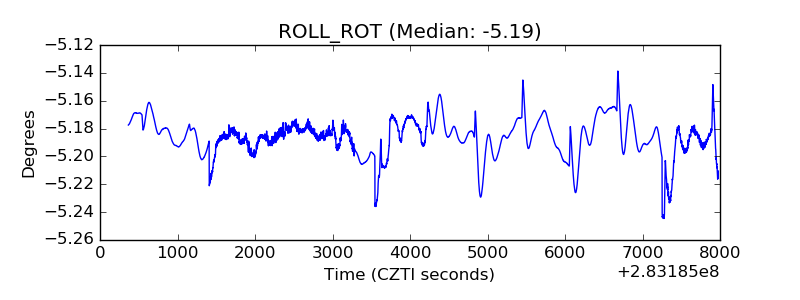 |
| _Roll_DEC | 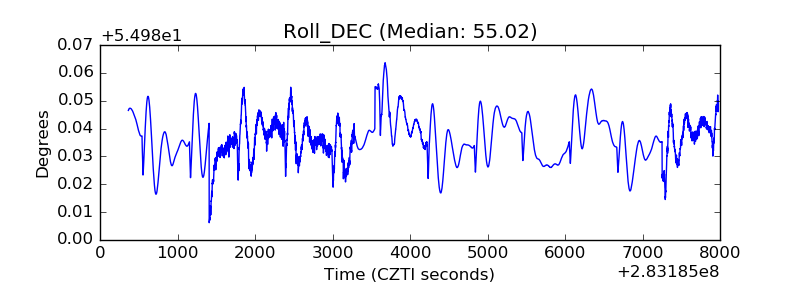 |
| _Roll_RA | 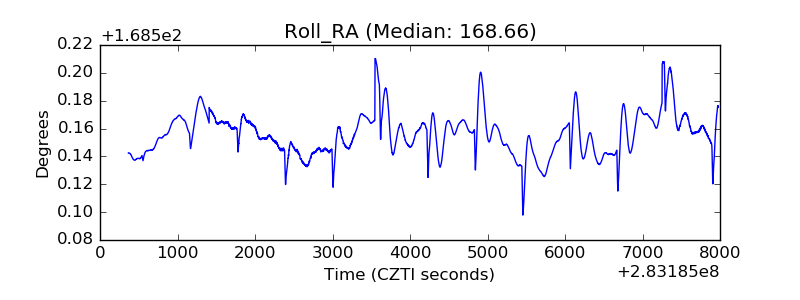 |
| Veto Counter | 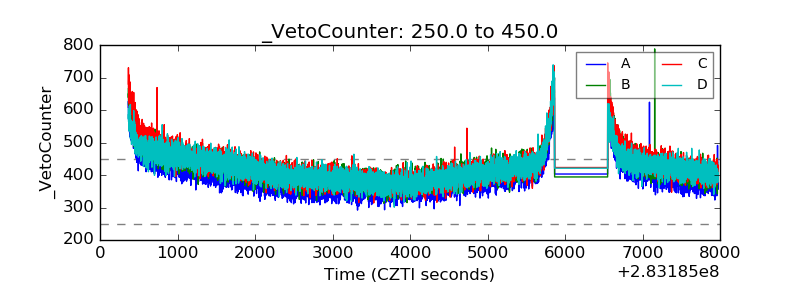 |