| Param | Original file | Final file |
|---|---|---|
| Filename | modeM0/AS1A05_149T03_9000002590_17489cztM0_level2.evt | modeM0/AS1A05_149T03_9000002590_17489cztM0_level2_quad_clean.evt |
| Size (bytes) | 211,210,560 | 24,655,680 |
| Size | 201.4 MB | 23.5 MB |
| Events in quadrant A | 1,150,003 | 151,611 |
| Events in quadrant B | 1,302,144 | 150,605 |
| Events in quadrant C | 1,187,042 | 144,730 |
| Events in quadrant D | 2,586,715 | 120,688 |
| Mode M0 | |||
|---|---|---|---|
| Quadrant | BADHDUFLAG | Total packets | Discarded packets |
| A | 0 | 5020 | 0 |
| B | 0 | 5499 | 0 |
| C | 0 | 5013 | 0 |
| D | 0 | 9361 | 0 |
| Mode SS | |||
|---|---|---|---|
| Quadrant | BADHDUFLAG | Total packets | Discarded packets |
| A | 0 | 50 | 0 |
| B | 0 | 50 | 0 |
| C | 0 | 50 | 0 |
| D | 0 | 50 | 0 |
| Quadrant | Total seconds | Saturated seconds | Saturation percentage |
|---|---|---|---|
| A | 2479 | 4 | 0.161355% |
| B | 2479 | 7 | 0.282372% |
| C | 2480 | 16 | 0.645161% |
| D | 2480 | 454 | 18.306452% |
Noise dominated data is calculated using 1-second bins in cleaned event files. If a bin has >2000 counts, and if more than 50% of those come from <1% of pixels, then it is considered to be noise-dominated and hence unusable.
| Quadrant | # 1 sec bins | Bins with >0 counts | Bins with >2000 counts | High rate bins dominated by noise | Noise dominated (total time) | Noise dominated (detector-on time) | Marked lightcurve |
|---|---|---|---|---|---|---|---|
| A | 2479 | 2479 | 0 | 0 | 0.00% | 0.00% | 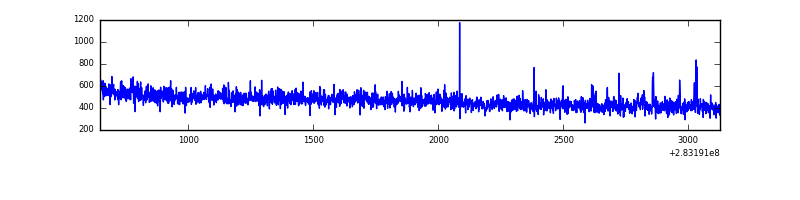 |
| B | 2479 | 2479 | 2 | 2 | 0.08% | 0.08% | 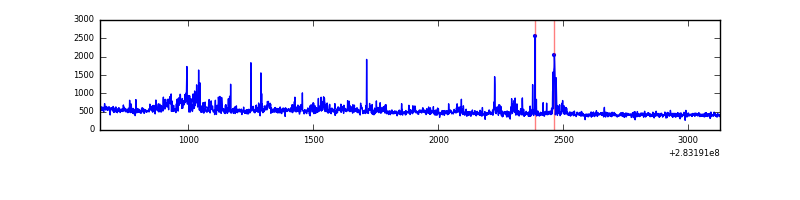 |
| C | 2480 | 2480 | 0 | 0 | 0.00% | 0.00% | 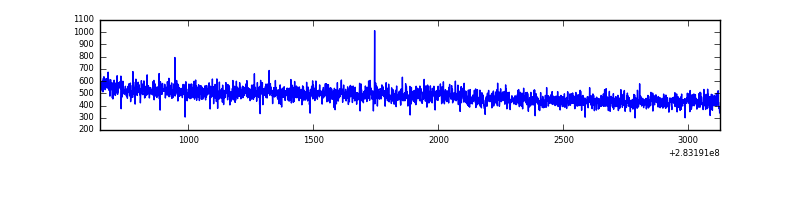 |
| D | 2480 | 2480 | 402 | 402 | 16.21% | 16.21% | 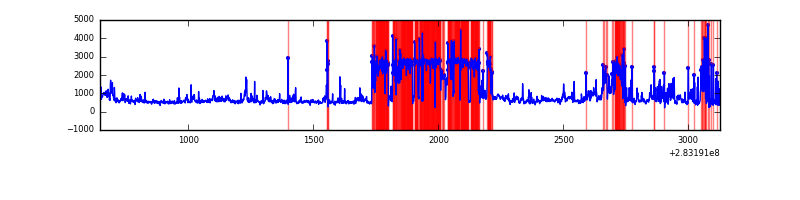 |
Top three noisy pixels from each quadrant. If the there are fewer than three noisy pixels in the level2.evt file, extra rows are filled as -1
| Pixel properties | Quadrant properties | ||||||
|---|---|---|---|---|---|---|---|
| Quadrant | DetID | PixID | Counts | Sigma | Mean | Median | Sigma |
| A | 15 | 174 | 9775 | 154.2 | 296 | 288 | 61.5 |
| A | 0 | 226 | 2594 | 37.48 | 296 | 288 | 61.5 |
| A | 4 | 2 | 2453 | 35.19 | 296 | 288 | 61.5 |
| B | 4 | 216 | 67495 | 1184.75 | 294 | 288 | 56.7 |
| B | 7 | 220 | 37196 | 650.63 | 294 | 288 | 56.7 |
| B | 6 | 36 | 24436 | 425.69 | 294 | 288 | 56.7 |
| C | 14 | 238 | 44769 | 648.83 | 286 | 286 | 68.6 |
| C | 5 | 218 | 20932 | 301.14 | 286 | 286 | 68.6 |
| C | 5 | 37 | 2186 | 27.71 | 286 | 286 | 68.6 |
| D | 15 | 0 | 918522 | 13107.66 | 261 | 254 | 70.1 |
| D | 13 | 189 | 242614 | 3459.53 | 261 | 254 | 70.1 |
| D | 1 | 52 | 219008 | 3122.57 | 261 | 254 | 70.1 |
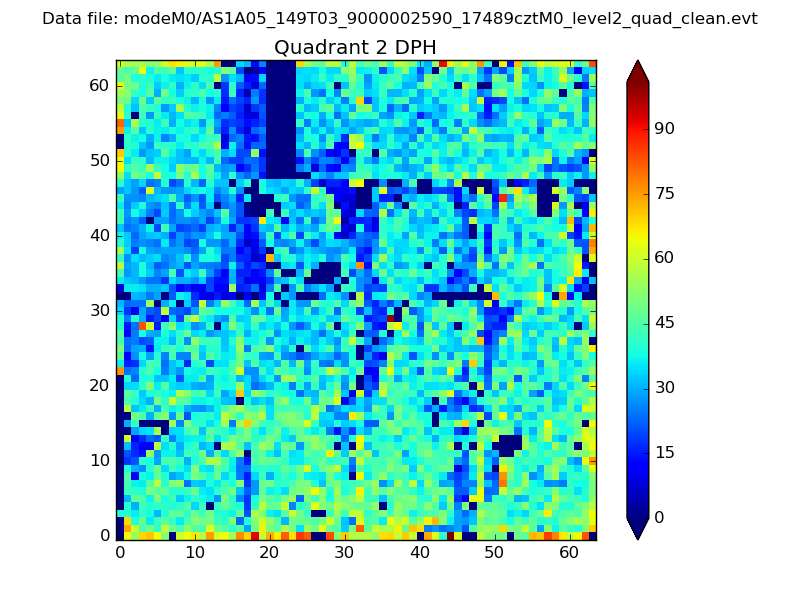
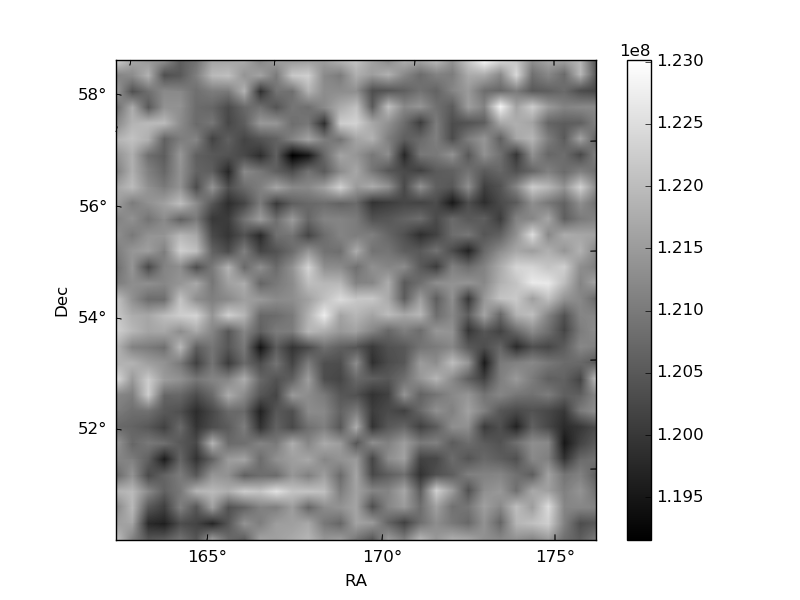
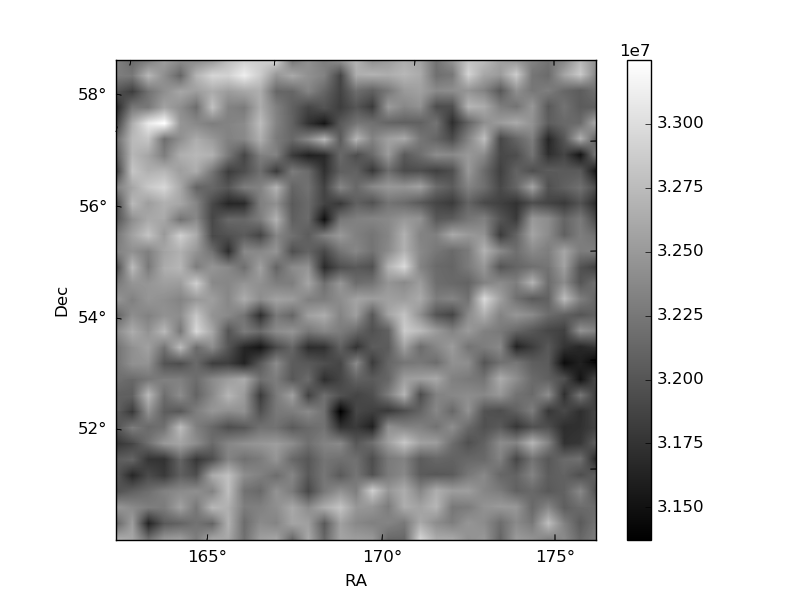
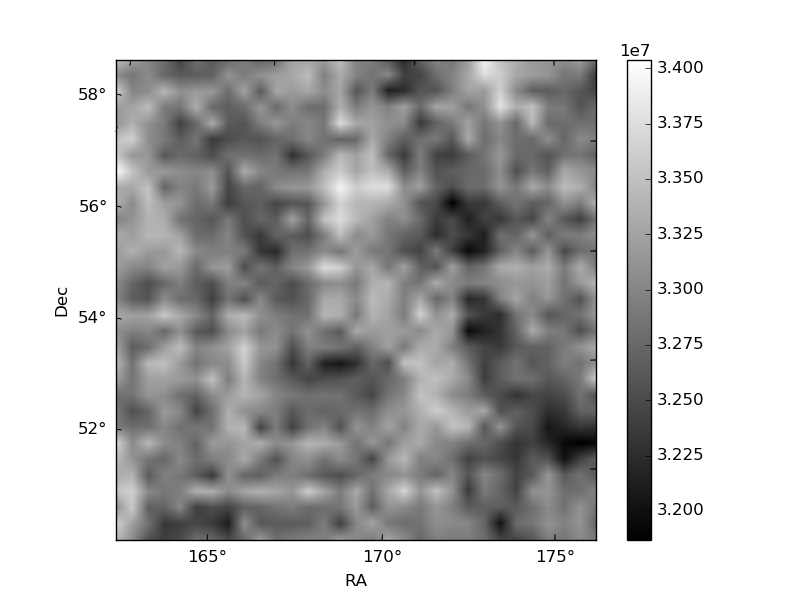
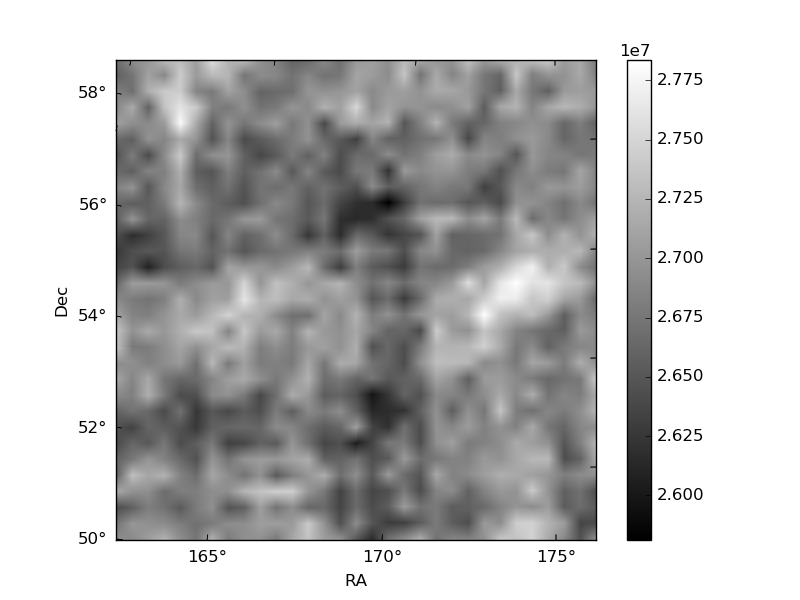
Histogram calculated using DETX and DETY for each event in the final _common_clean file
| Quadrant A | 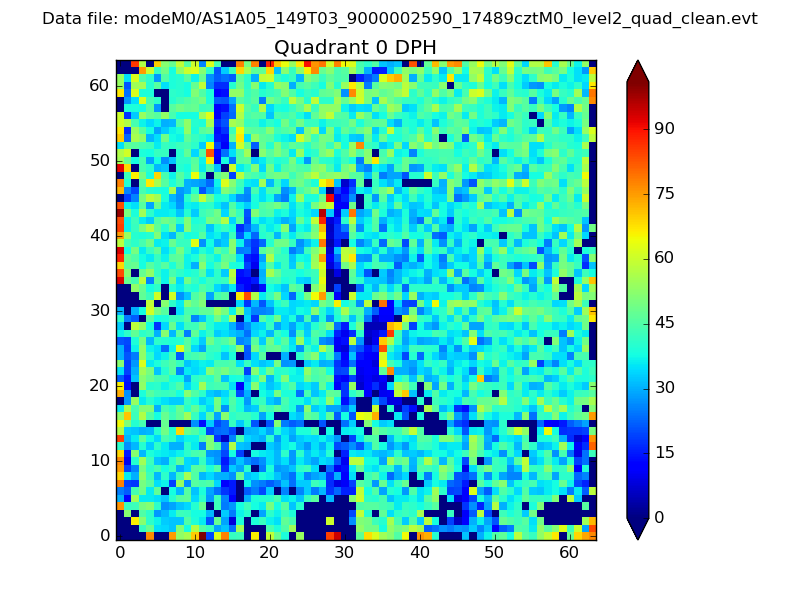 |
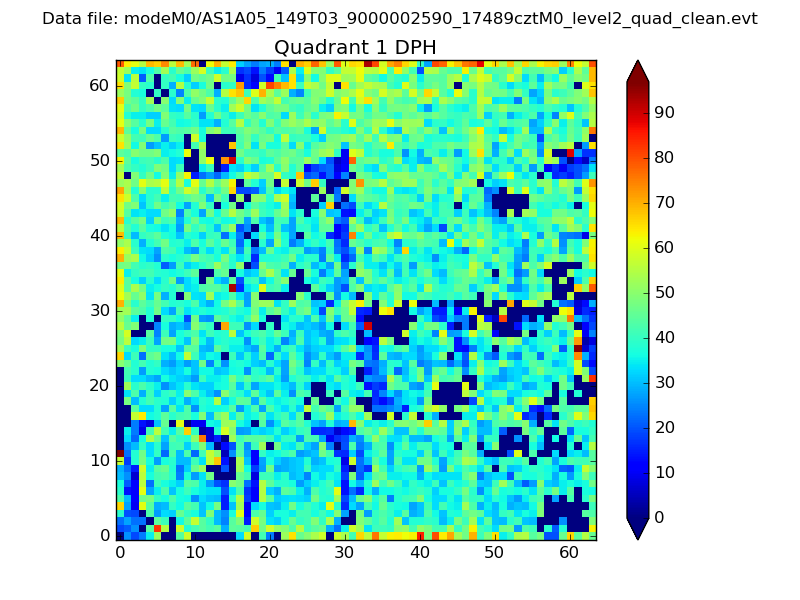 |
Quadrant B |
|---|---|---|---|
| Quadrant D | 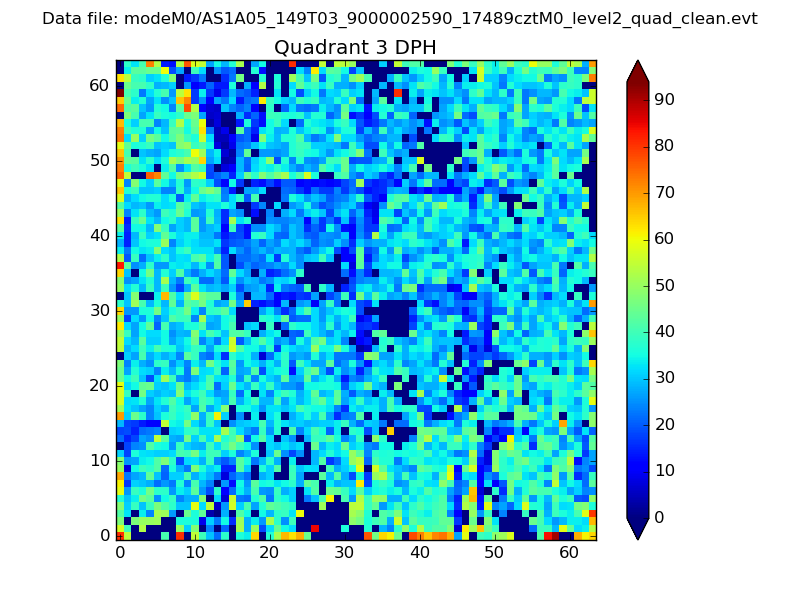 |
 |
Quadrant C |
| Plot type | Count rate plots | Images |
|---|---|---|
| Comparison with Poisson distribution Blue bars denote a histogram of data divided into 1 sec bins. Red curve is a Poisson curve with rate = median count rate of data. |
 |
 |
| Quadrant-wise count rates Data is divided into 100 sec bins |
 |
|
| Module-wise count rates for Quadrant A Data is divided into 100 sec bins |
 |
 |
| Module-wise count rates for Quadrant B Data is divided into 100 sec bins |
 |
 |
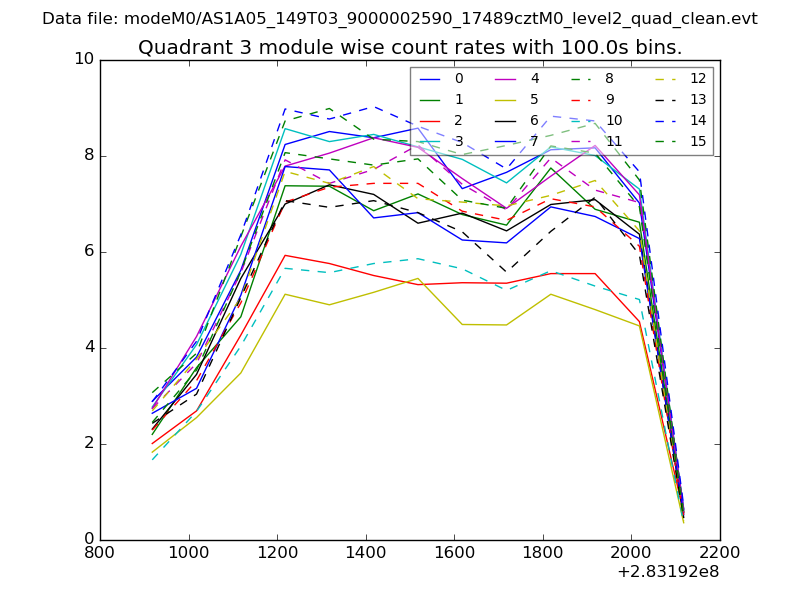
| Module-wise count rates for Quadrant C Data is divided into 100 sec bins |
 |
 |
| Module-wise count rates for Quadrant D Data is divided into 100 sec bins |
 |
 |
| Parameter | Plot |
|---|---|
| CZT HV Monitor |  |
| D_VDD | 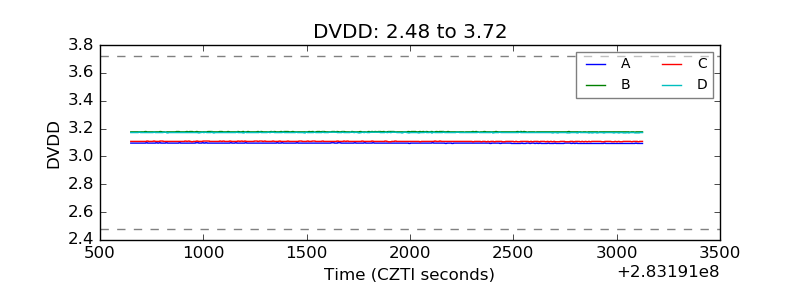 |
| Temperature 1 | 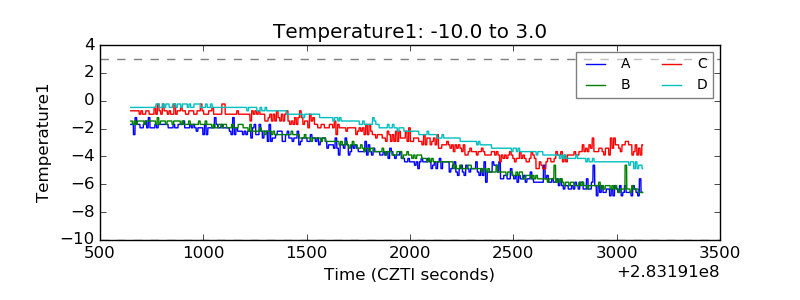 |
| Veto HV Monitor | 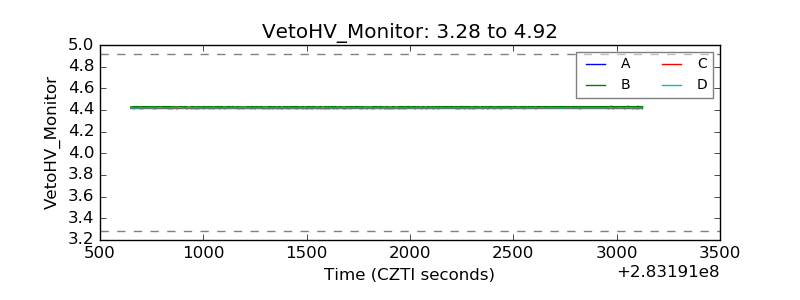 |
| Veto LLD | 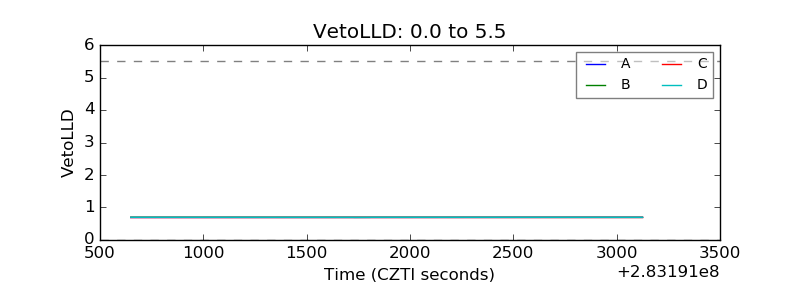 |
| Alpha Counter |  |
| _CPM_Rate |  |
| CZT Counter | 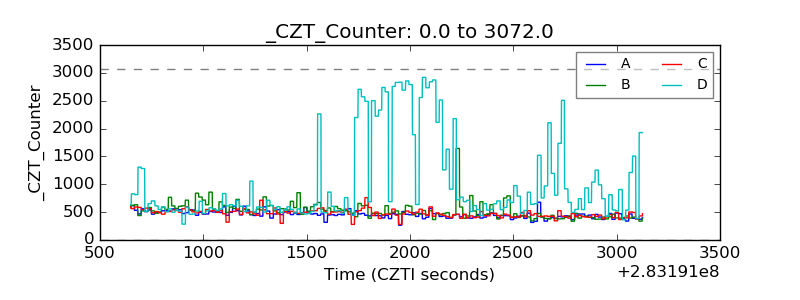 |
| +2.5 Volts monitor |  |
| +5 Volts monitor |  |
| _ROLL_ROT | 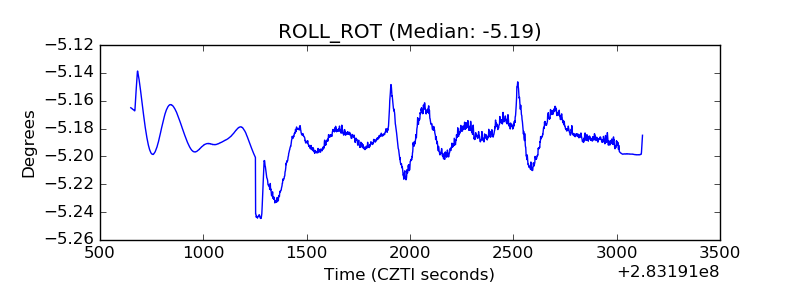 |
| _Roll_DEC | 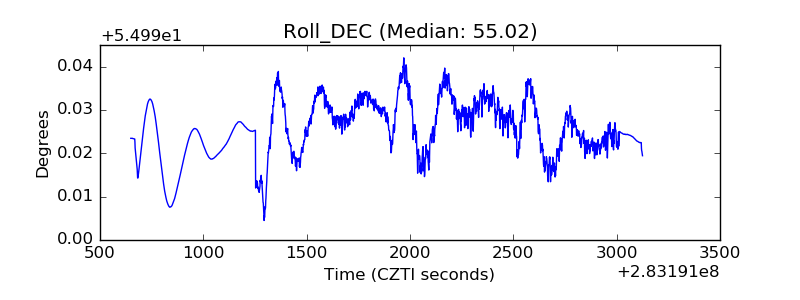 |
| _Roll_RA | 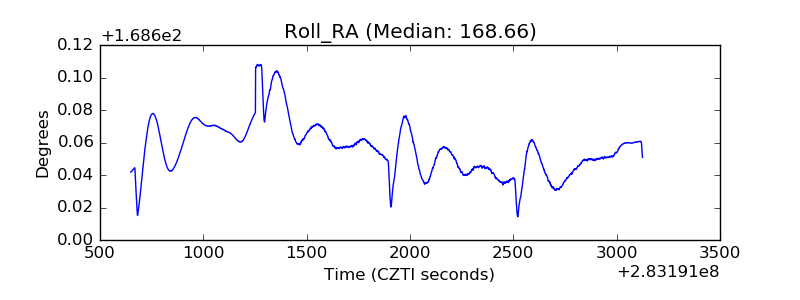 |
| Veto Counter |  |