| Param | Original file | Final file |
|---|---|---|
| Filename | modeM0/AS1A05_194T05_9000002592_17490cztM0_level2.evt | modeM0/AS1A05_194T05_9000002592_17490cztM0_level2_quad_clean.evt |
| Size (bytes) | 233,328,960 | 43,372,800 |
| Size | 222.5 MB | 41.4 MB |
| Events in quadrant A | 1,515,882 | 269,715 |
| Events in quadrant B | 1,609,319 | 274,353 |
| Events in quadrant C | 1,592,557 | 264,957 |
| Events in quadrant D | 2,111,184 | 258,572 |
| Mode SS | |||
|---|---|---|---|
| Quadrant | BADHDUFLAG | Total packets | Discarded packets |
| A | 0 | 86 | 20 |
| B | 0 | 86 | 14 |
| C | 0 | 86 | 16 |
| D | 0 | 85 | 15 |
| Mode M0 | |||
|---|---|---|---|
| Quadrant | BADHDUFLAG | Total packets | Discarded packets |
| A | 0 | 8523 | 1584 |
| B | 0 | 8682 | 1530 |
| C | 0 | 8536 | 1553 |
| D | 0 | 10322 | 1828 |
| Quadrant | Total seconds | Saturated seconds | Saturation percentage |
|---|---|---|---|
| A | 3449 | 7 | 0.202957% |
| B | 3475 | 9 | 0.258993% |
| C | 3463 | 14 | 0.404274% |
| D | 3442 | 40 | 1.162115% |
Noise dominated data is calculated using 1-second bins in cleaned event files. If a bin has >2000 counts, and if more than 50% of those come from <1% of pixels, then it is considered to be noise-dominated and hence unusable.
| Quadrant | # 1 sec bins | Bins with >0 counts | Bins with >2000 counts | High rate bins dominated by noise | Noise dominated (total time) | Noise dominated (detector-on time) | Marked lightcurve |
|---|---|---|---|---|---|---|---|
| A | 4206 | 3699 | 2 | 2 | 0.05% | 0.05% | 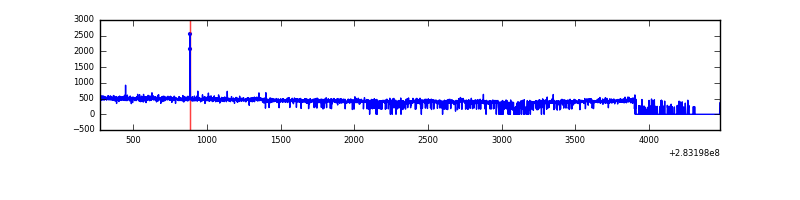 |
| B | 4205 | 3712 | 2 | 2 | 0.05% | 0.05% | 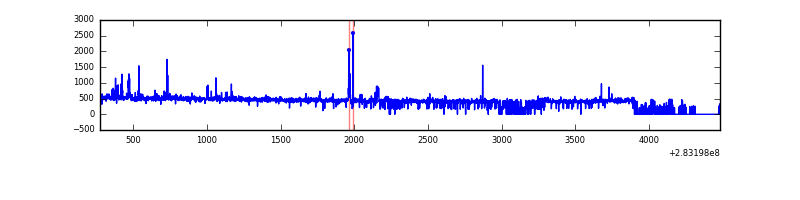 |
| C | 4206 | 3694 | 0 | 0 | 0.00% | 0.00% | 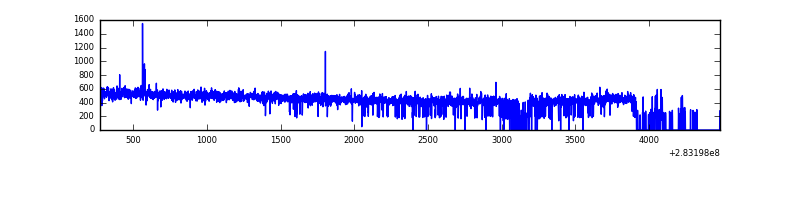 |
| D | 4047 | 3683 | 32 | 32 | 0.79% | 0.87% | 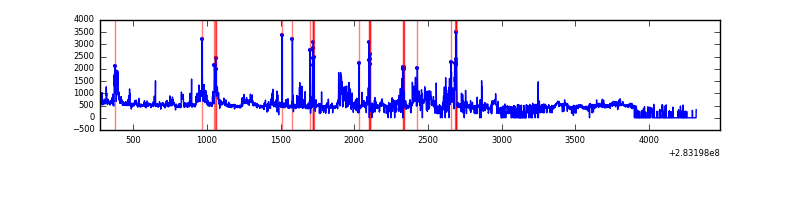 |
Top three noisy pixels from each quadrant. If the there are fewer than three noisy pixels in the level2.evt file, extra rows are filled as -1
| Pixel properties | Quadrant properties | ||||||
|---|---|---|---|---|---|---|---|
| Quadrant | DetID | PixID | Counts | Sigma | Mean | Median | Sigma |
| A | 15 | 174 | 9303 | 110.14 | 391 | 384 | 81.0 |
| A | 0 | 226 | 3386 | 37.07 | 391 | 384 | 81.0 |
| A | 12 | 194 | 2778 | 29.56 | 391 | 384 | 81.0 |
| B | 15 | 33 | 53196 | 684.1 | 394 | 384 | 77.2 |
| B | 12 | 111 | 8932 | 110.73 | 394 | 384 | 77.2 |
| B | 11 | 111 | 7632 | 93.89 | 394 | 384 | 77.2 |
| C | 14 | 238 | 59042 | 646.02 | 378 | 380 | 90.8 |
| C | 5 | 218 | 30469 | 331.36 | 378 | 380 | 90.8 |
| C | 3 | 233 | 9681 | 102.43 | 378 | 380 | 90.8 |
| D | 11 | 176 | 198358 | 1922.21 | 374 | 366 | 103.0 |
| D | 1 | 52 | 192494 | 1865.28 | 374 | 366 | 103.0 |
| D | 7 | 238 | 119884 | 1160.34 | 374 | 366 | 103.0 |
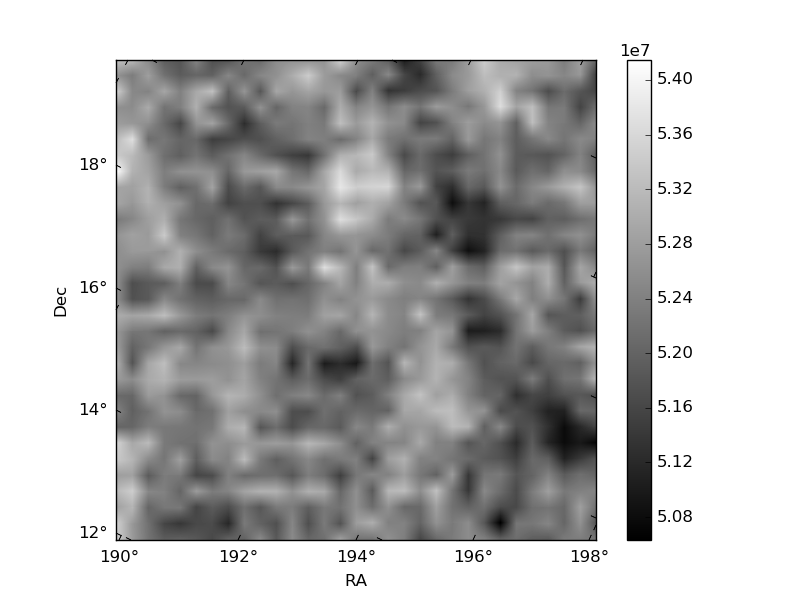
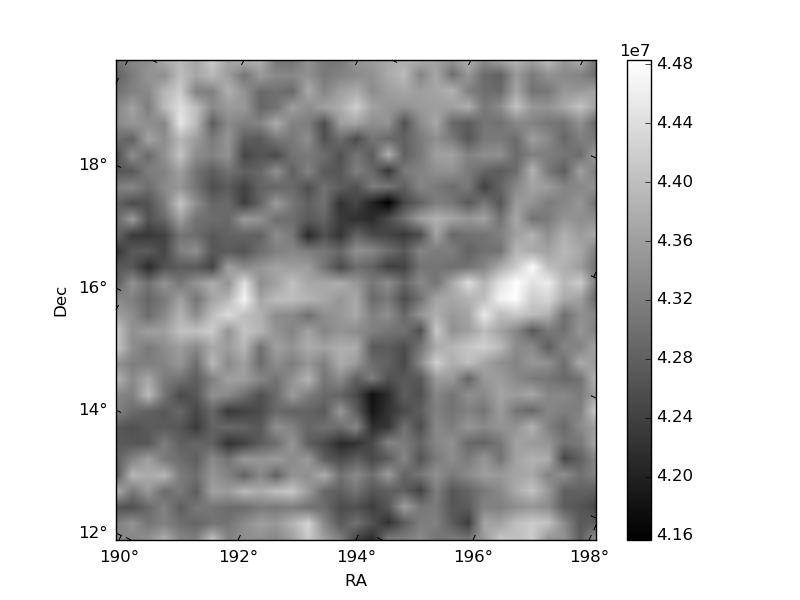
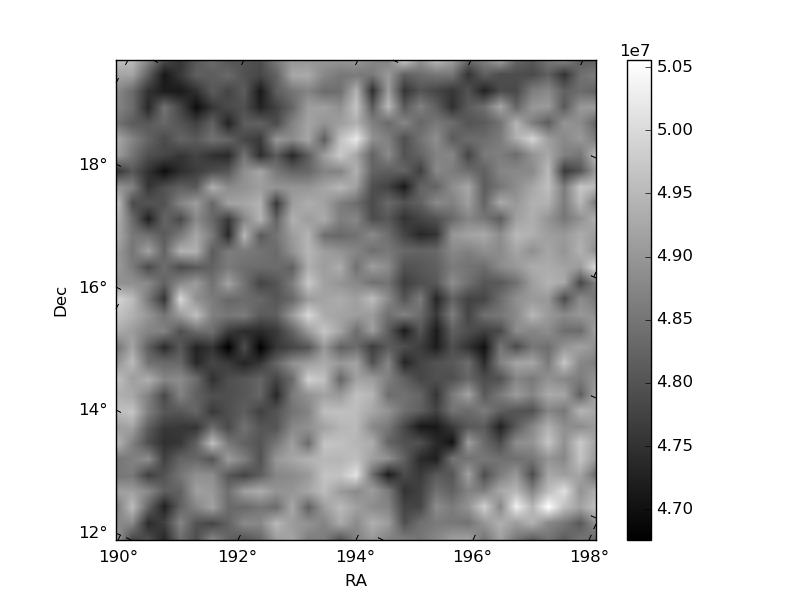
Histogram calculated using DETX and DETY for each event in the final _common_clean file
| Quadrant A | 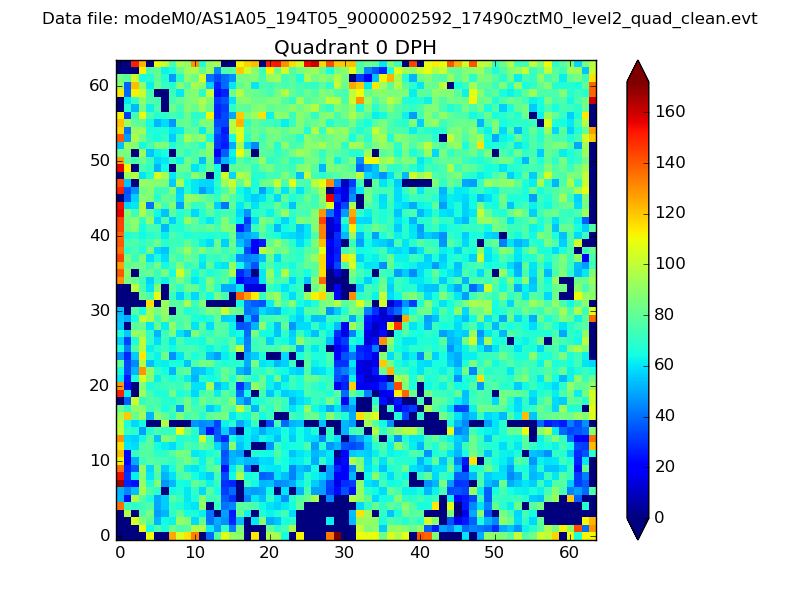 |
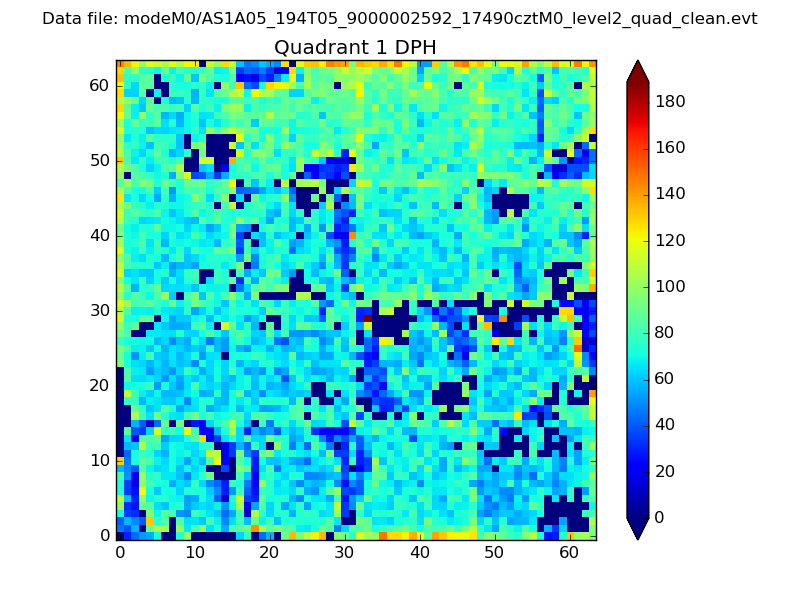 |
Quadrant B |
|---|---|---|---|
| Quadrant D | 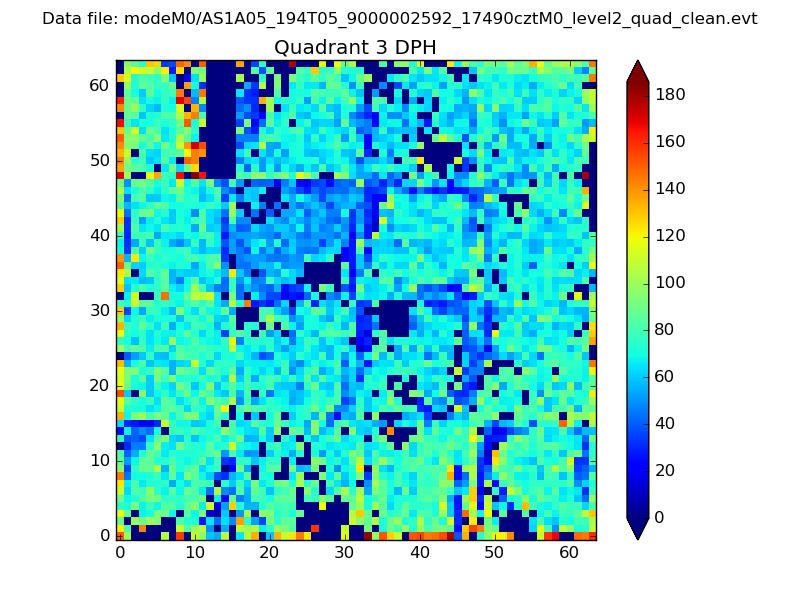 |
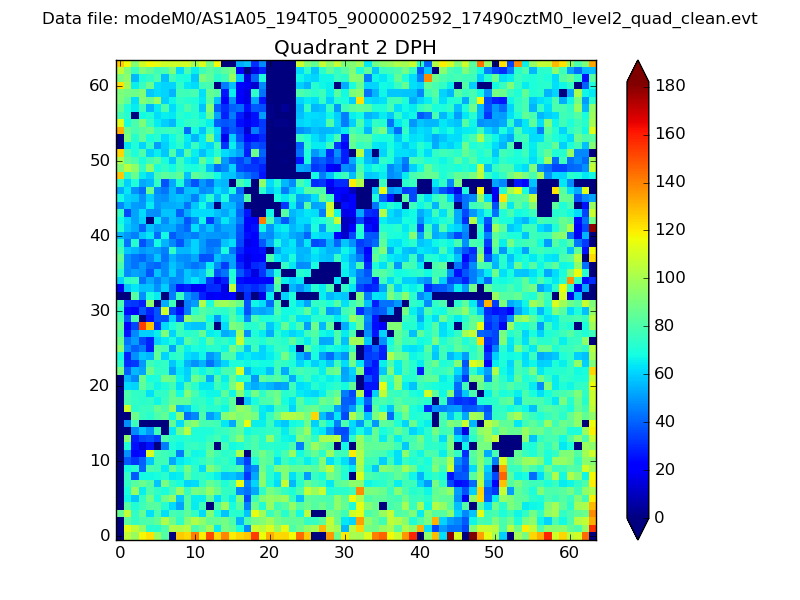 |
Quadrant C |
| Plot type | Count rate plots | Images |
|---|---|---|
| Comparison with Poisson distribution Blue bars denote a histogram of data divided into 1 sec bins. Red curve is a Poisson curve with rate = median count rate of data. |
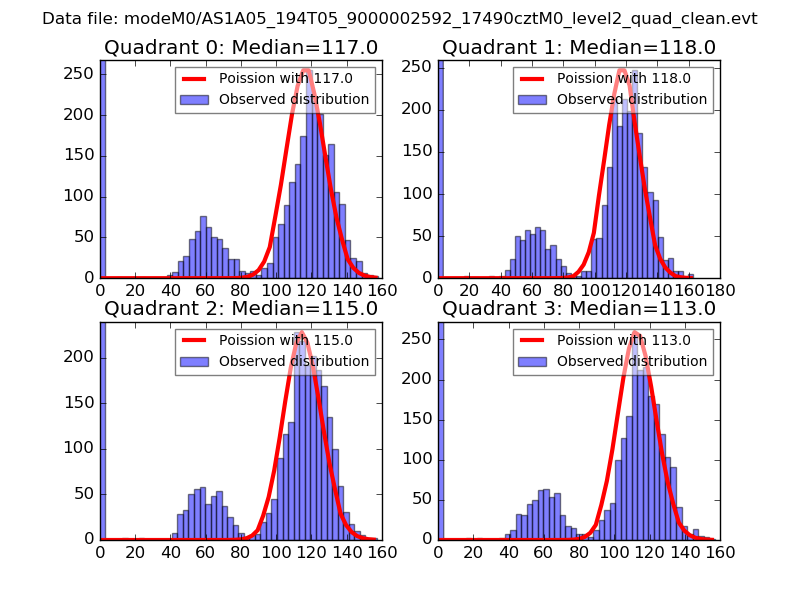 |
 |
| Quadrant-wise count rates Data is divided into 100 sec bins |
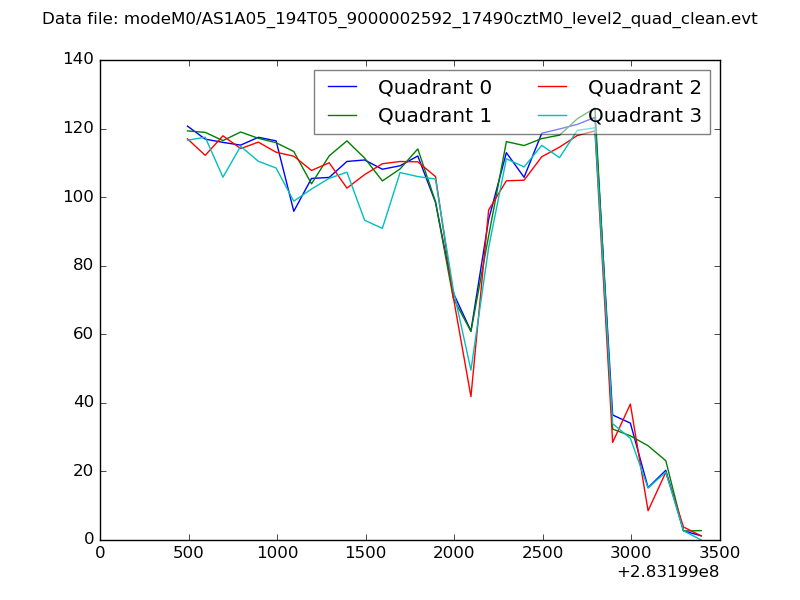 |
|
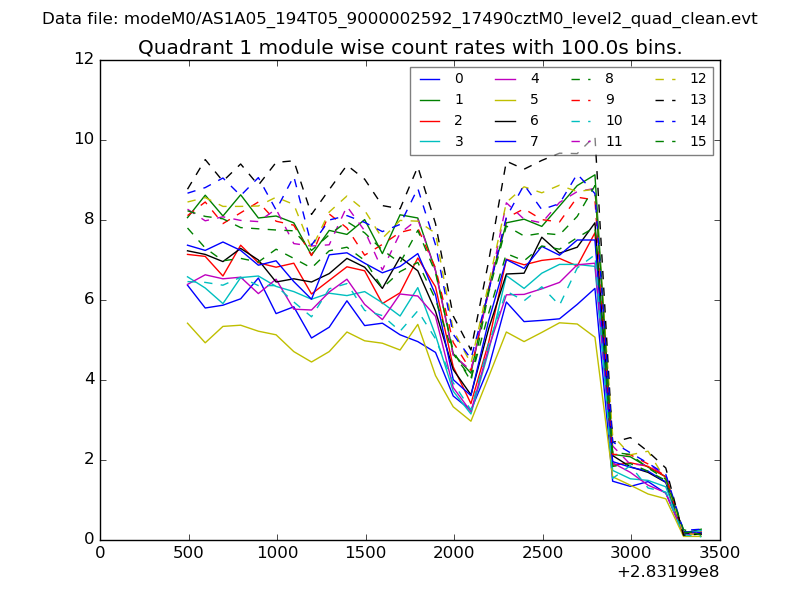
| Module-wise count rates for Quadrant A Data is divided into 100 sec bins |
 |
 |
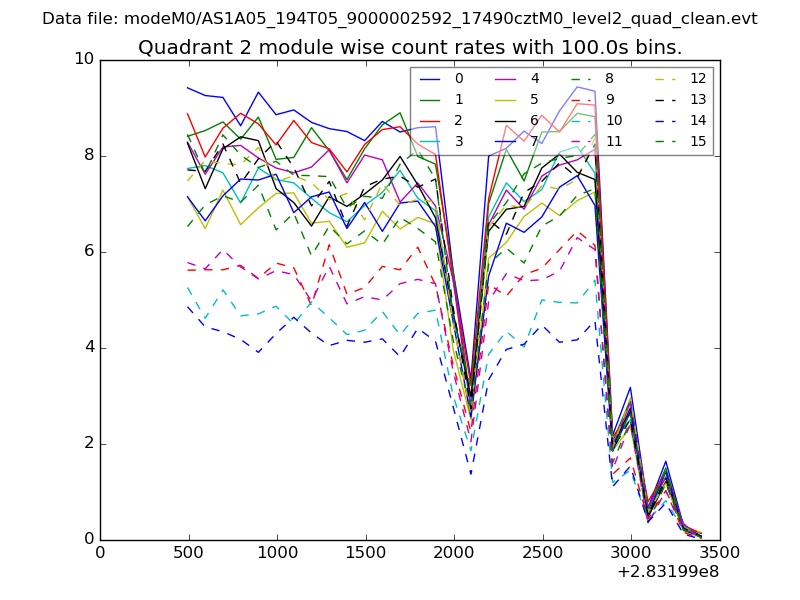
| Module-wise count rates for Quadrant B Data is divided into 100 sec bins |
 |
 |
| Module-wise count rates for Quadrant C Data is divided into 100 sec bins |
 |
 |
| Module-wise count rates for Quadrant D Data is divided into 100 sec bins |
 |
 |
| Parameter | Plot |
|---|---|
| CZT HV Monitor | 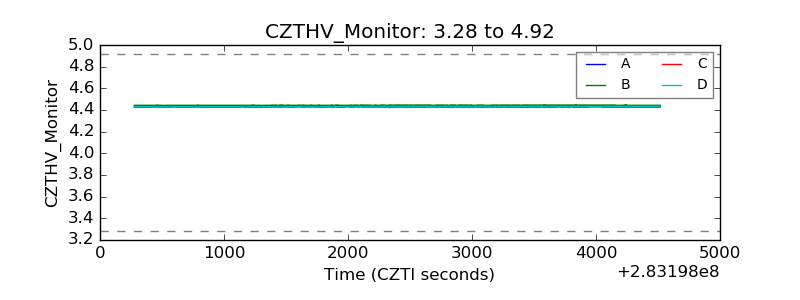 |
| D_VDD | 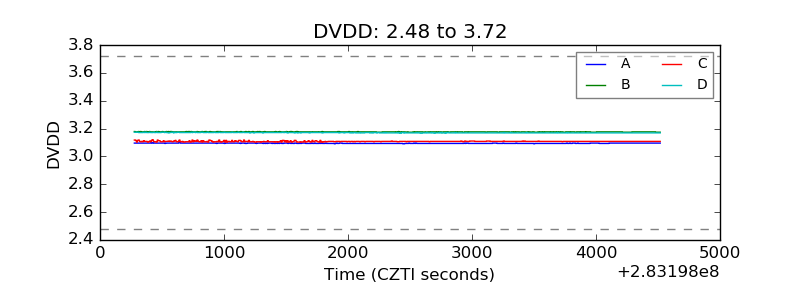 |
| Temperature 1 |  |
| Veto HV Monitor | 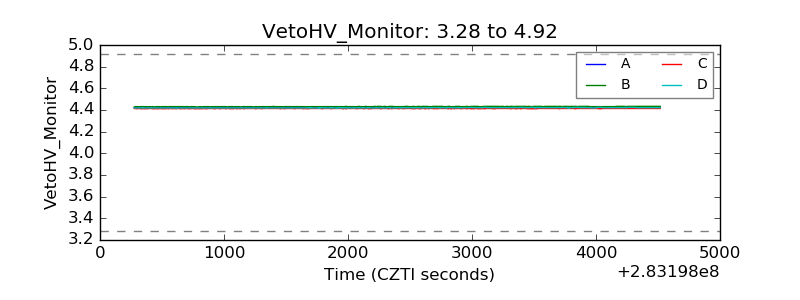 |
| Veto LLD |  |
| Alpha Counter | 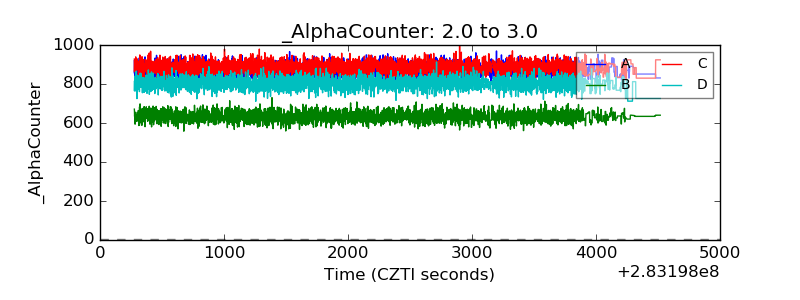 |
| _CPM_Rate | 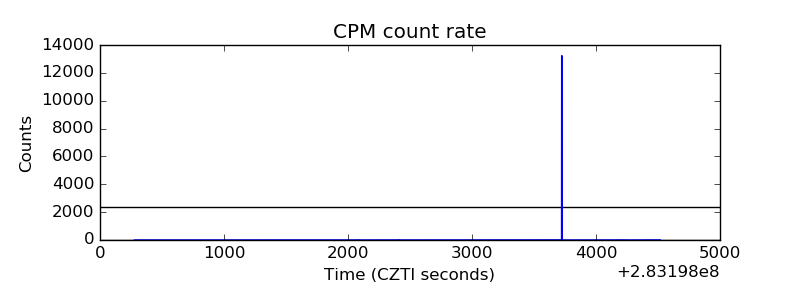 |
| CZT Counter | 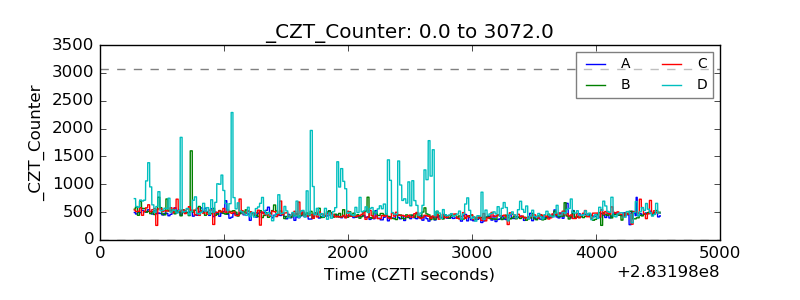 |
| +2.5 Volts monitor |  |
| +5 Volts monitor |  |
| _ROLL_ROT | 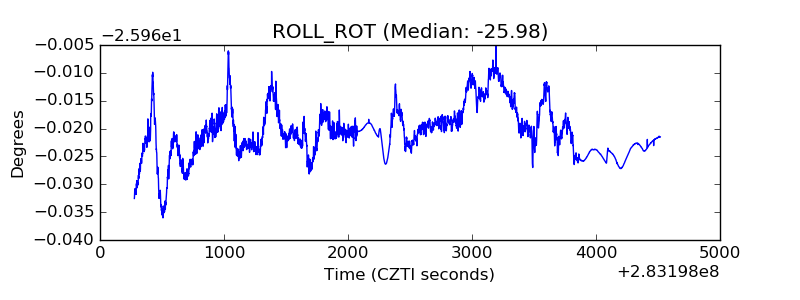 |
| _Roll_DEC |  |
| _Roll_RA | 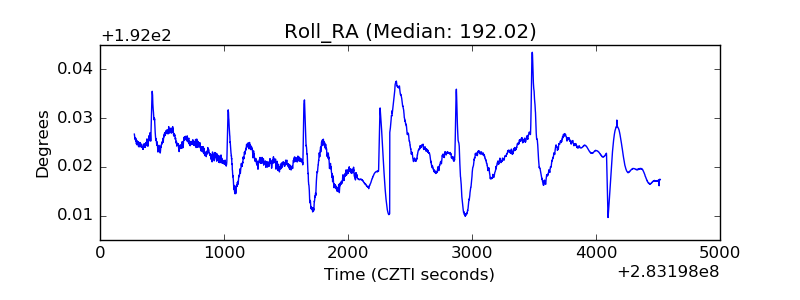 |
| Veto Counter | 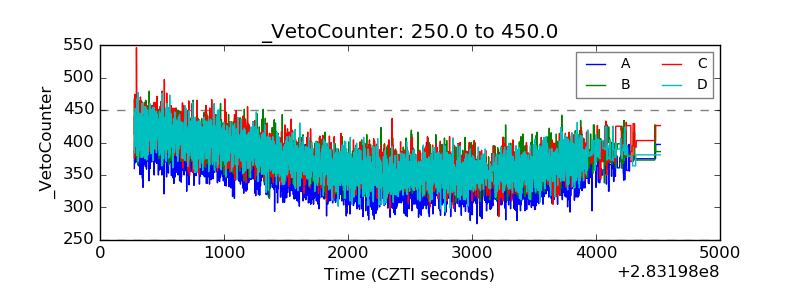 |