| Param | Original file | Final file |
|---|---|---|
| Filename | modeM0/AS1A05_194T05_9000002592_17494cztM0_level2.evt | modeM0/AS1A05_194T05_9000002592_17494cztM0_level2_quad_clean.evt |
| Size (bytes) | 1,398,352,320 | 236,396,160 |
| Size | 1.3 GB | 225.4 MB |
| Events in quadrant A | 8,685,767 | 1,488,345 |
| Events in quadrant B | 8,923,185 | 1,517,150 |
| Events in quadrant C | 8,850,482 | 1,461,978 |
| Events in quadrant D | 14,624,811 | 1,401,813 |
| Mode SS | |||
|---|---|---|---|
| Quadrant | BADHDUFLAG | Total packets | Discarded packets |
| A | 0 | 380 | 0 |
| B | 0 | 380 | 0 |
| C | 0 | 380 | 0 |
| D | 0 | 380 | 0 |
| Mode M9 | |||
|---|---|---|---|
| Quadrant | BADHDUFLAG | Total packets | Discarded packets |
| A | 0 | 28 | 0 |
| B | 0 | 28 | 0 |
| C | 0 | 28 | 0 |
| D | 0 | 28 | 0 |
| Mode M0 | |||
|---|---|---|---|
| Quadrant | BADHDUFLAG | Total packets | Discarded packets |
| A | 0 | 38529 | 4 |
| B | 0 | 38889 | 4 |
| C | 0 | 38407 | 4 |
| D | 0 | 56626 | 4 |
| Quadrant | Total seconds | Saturated seconds | Saturation percentage |
|---|---|---|---|
| A | 18741 | 87 | 0.464223% |
| B | 18742 | 125 | 0.666951% |
| C | 18742 | 171 | 0.912389% |
| D | 18742 | 1081 | 5.767794% |
Noise dominated data is calculated using 1-second bins in cleaned event files. If a bin has >2000 counts, and if more than 50% of those come from <1% of pixels, then it is considered to be noise-dominated and hence unusable.
| Quadrant | # 1 sec bins | Bins with >0 counts | Bins with >2000 counts | High rate bins dominated by noise | Noise dominated (total time) | Noise dominated (detector-on time) | Marked lightcurve |
|---|---|---|---|---|---|---|---|
| A | 21446 | 18745 | 4 | 4 | 0.02% | 0.02% | 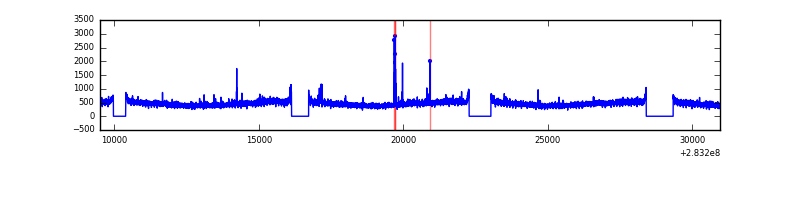 |
| B | 21447 | 18746 | 5 | 5 | 0.02% | 0.03% | 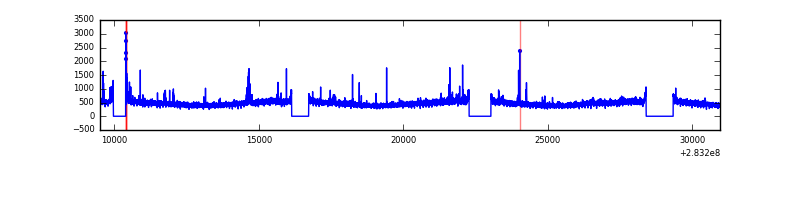 |
| C | 21447 | 18746 | 0 | 0 | 0.00% | 0.00% | 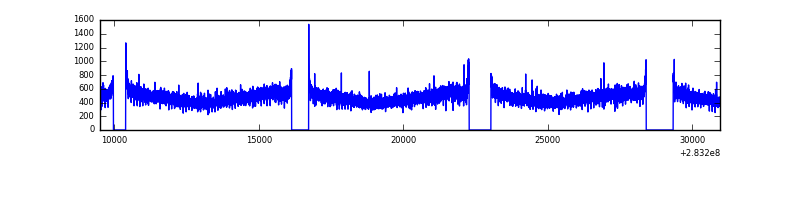 |
| D | 21447 | 18746 | 848 | 848 | 3.95% | 4.52% | 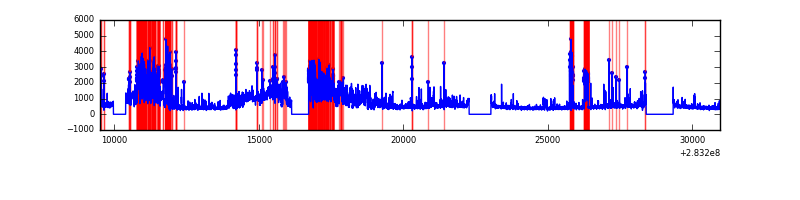 |
Top three noisy pixels from each quadrant. If the there are fewer than three noisy pixels in the level2.evt file, extra rows are filled as -1
| Pixel properties | Quadrant properties | ||||||
|---|---|---|---|---|---|---|---|
| Quadrant | DetID | PixID | Counts | Sigma | Mean | Median | Sigma |
| A | 15 | 174 | 91514 | 198.7 | 2231 | 2181 | 449.6 |
| A | 0 | 226 | 19677 | 38.92 | 2231 | 2181 | 449.6 |
| A | 3 | 137 | 16663 | 32.21 | 2231 | 2181 | 449.6 |
| B | 0 | 230 | 87153 | 199.83 | 2228 | 2171 | 425.3 |
| B | 12 | 111 | 51284 | 115.48 | 2228 | 2171 | 425.3 |
| B | 11 | 111 | 44275 | 99.0 | 2228 | 2171 | 425.3 |
| C | 14 | 238 | 328770 | 653.05 | 2139 | 2150 | 500.1 |
| C | 5 | 218 | 129150 | 253.93 | 2139 | 2150 | 500.1 |
| C | 3 | 233 | 39830 | 75.34 | 2139 | 2150 | 500.1 |
| D | 1 | 52 | 3149052 | 6133.66 | 2119 | 2062 | 513.1 |
| D | 11 | 176 | 1413358 | 2750.69 | 2119 | 2062 | 513.1 |
| D | 7 | 238 | 1121354 | 2181.56 | 2119 | 2062 | 513.1 |
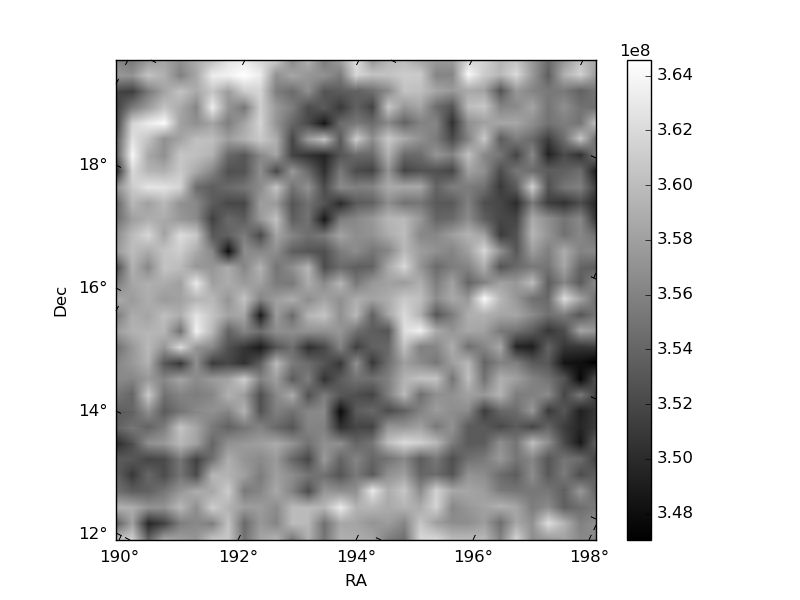
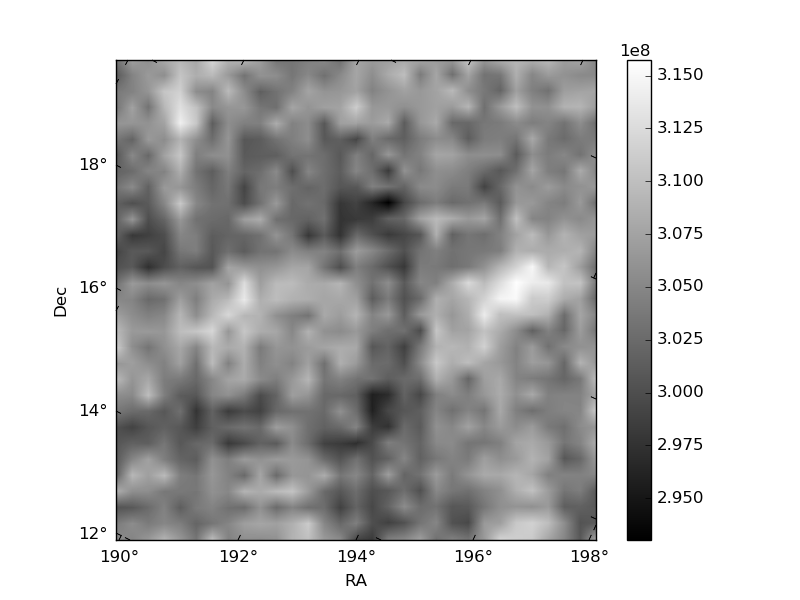
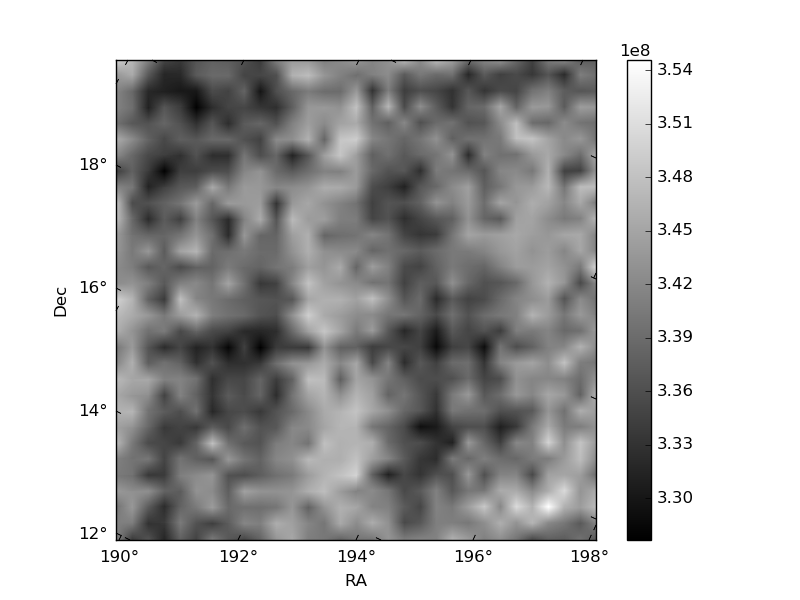
Histogram calculated using DETX and DETY for each event in the final _common_clean file
| Quadrant A |  |
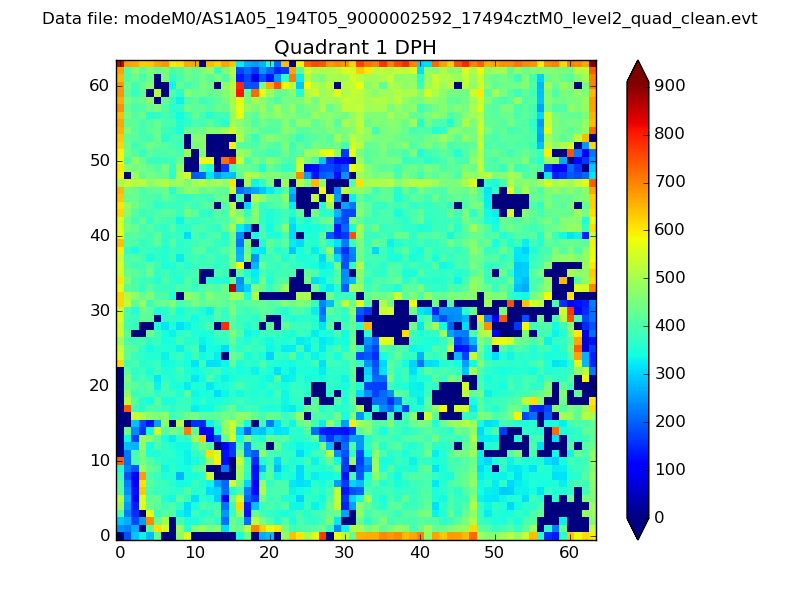 |
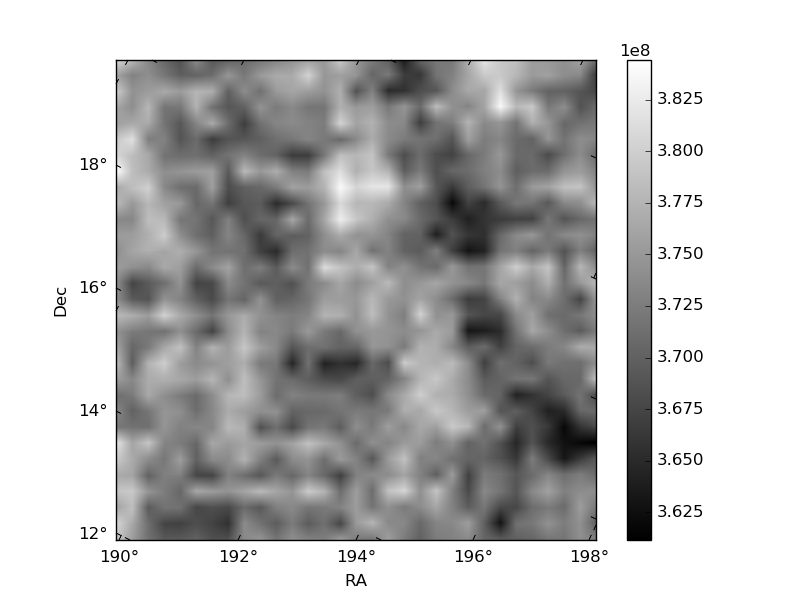
Quadrant B |
|---|---|---|---|
| Quadrant D |  |
 |
Quadrant C |
| Plot type | Count rate plots | Images |
|---|---|---|
| Comparison with Poisson distribution Blue bars denote a histogram of data divided into 1 sec bins. Red curve is a Poisson curve with rate = median count rate of data. |
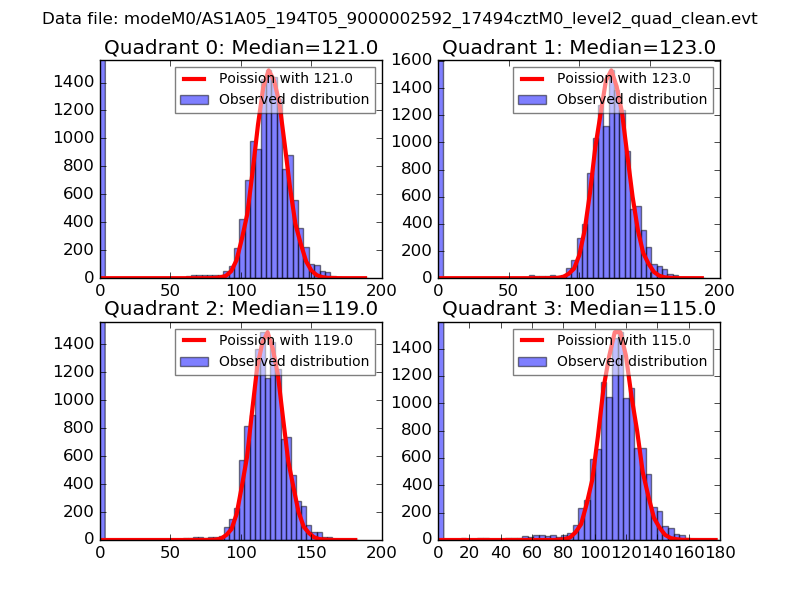 |
 |
| Quadrant-wise count rates Data is divided into 100 sec bins |
 |
|
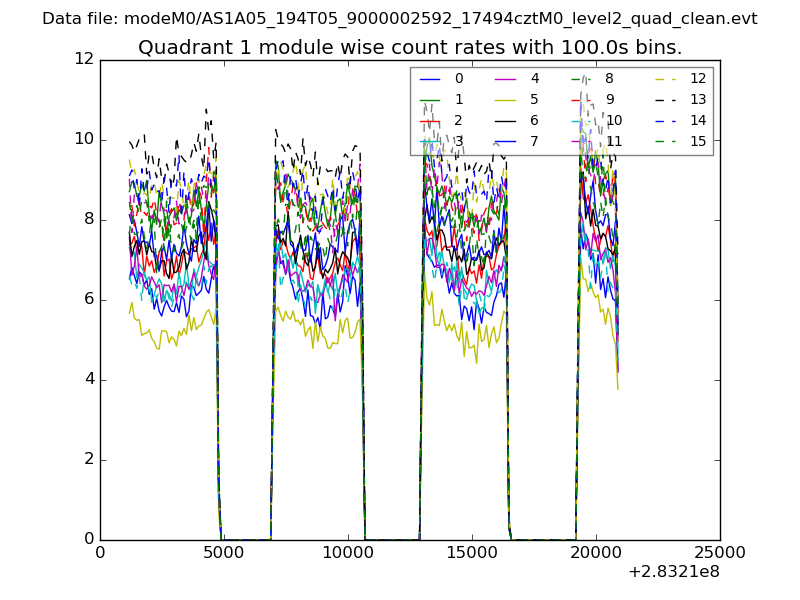
| Module-wise count rates for Quadrant A Data is divided into 100 sec bins |
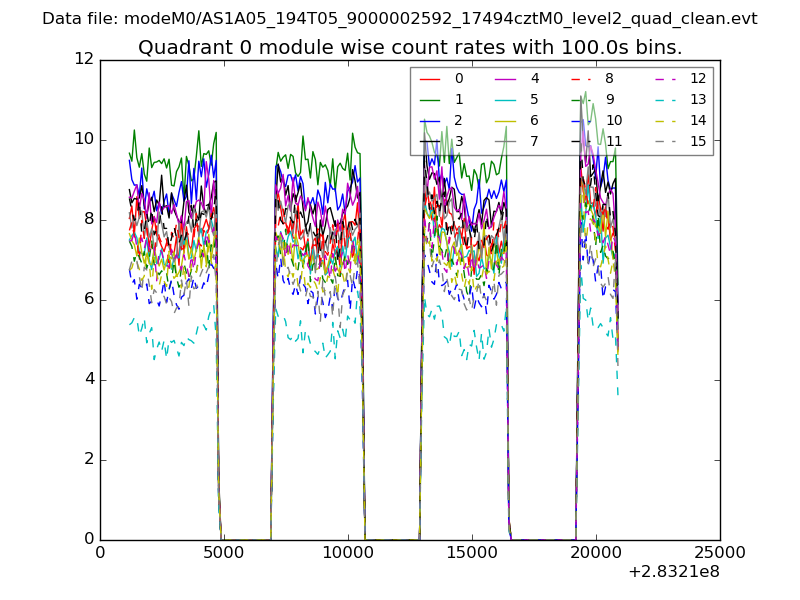 |
 |
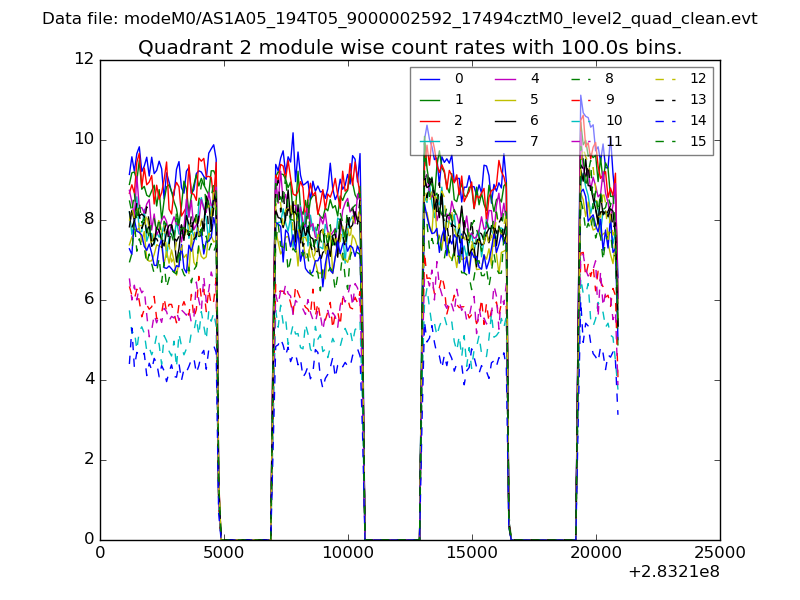
| Module-wise count rates for Quadrant B Data is divided into 100 sec bins |
 |
 |
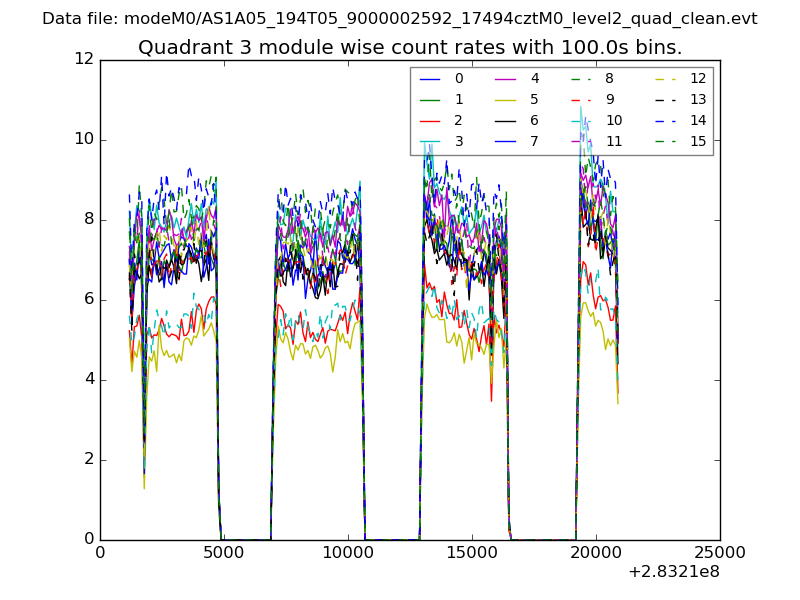
| Module-wise count rates for Quadrant C Data is divided into 100 sec bins |
 |
 |
| Module-wise count rates for Quadrant D Data is divided into 100 sec bins |
 |
 |
| Parameter | Plot |
|---|---|
| CZT HV Monitor | 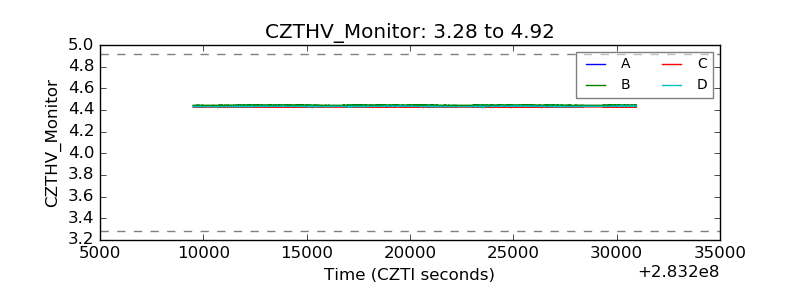 |
| D_VDD | 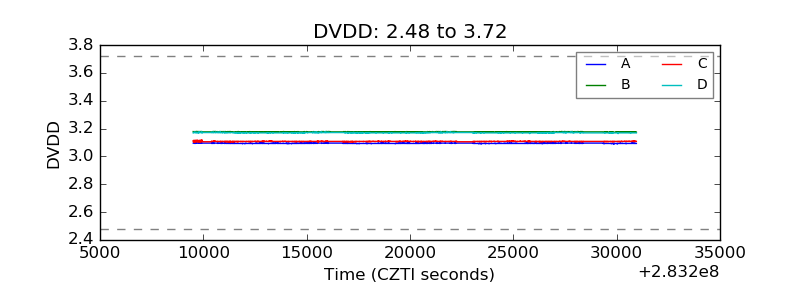 |
| Temperature 1 | 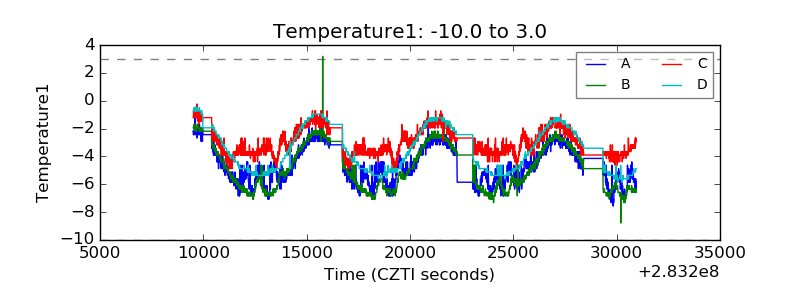 |
| Veto HV Monitor | 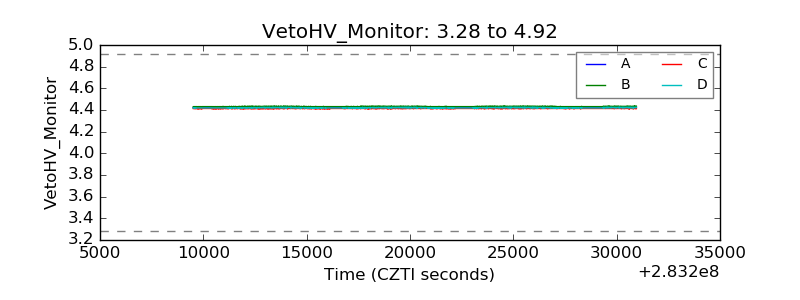 |
| Veto LLD | 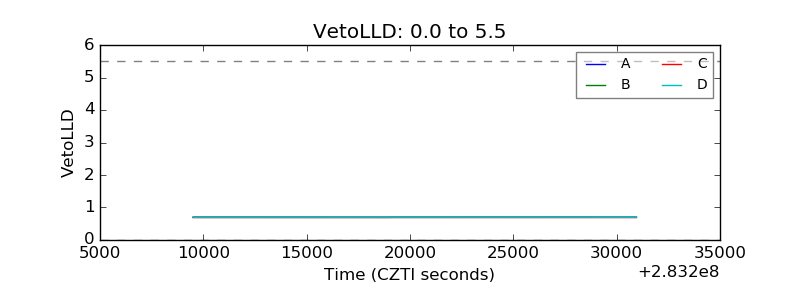 |
| Alpha Counter | 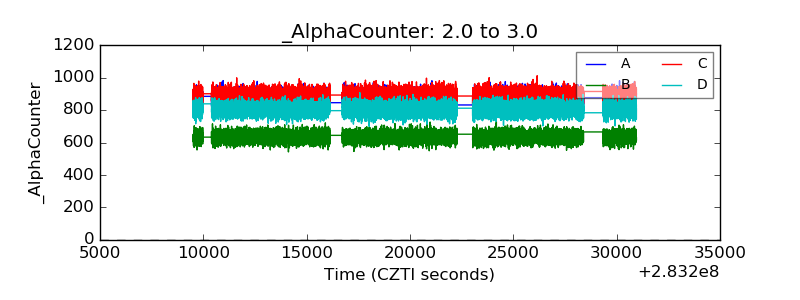 |
| _CPM_Rate | 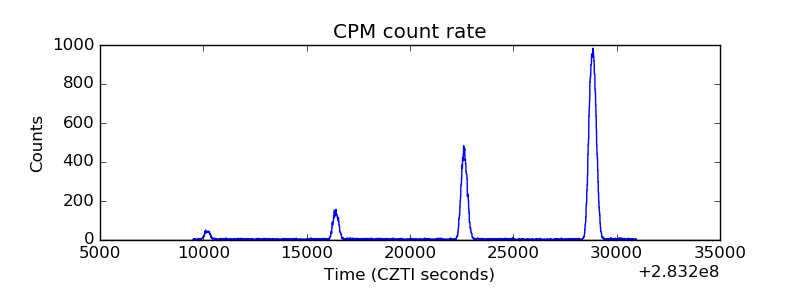 |
| CZT Counter |  |
| +2.5 Volts monitor |  |
| +5 Volts monitor |  |
| _ROLL_ROT | 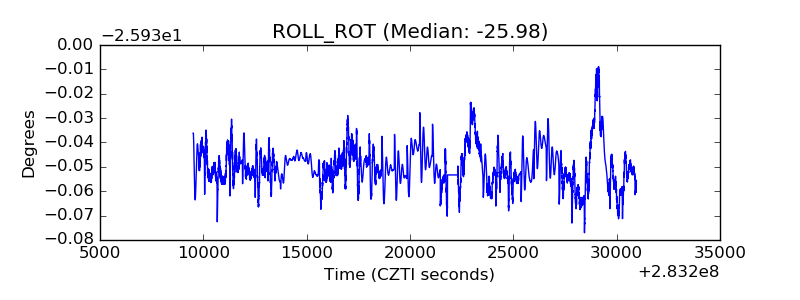 |
| _Roll_DEC | 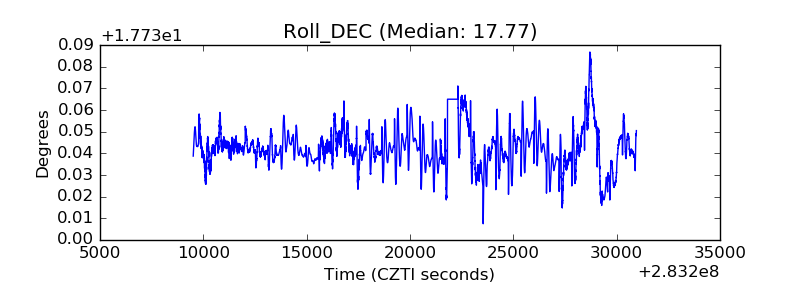 |
| _Roll_RA | 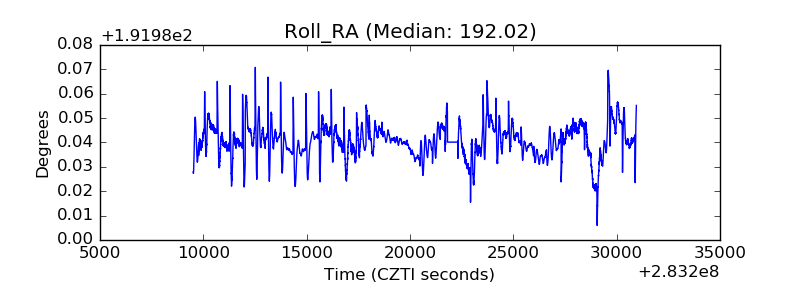 |
| Veto Counter | 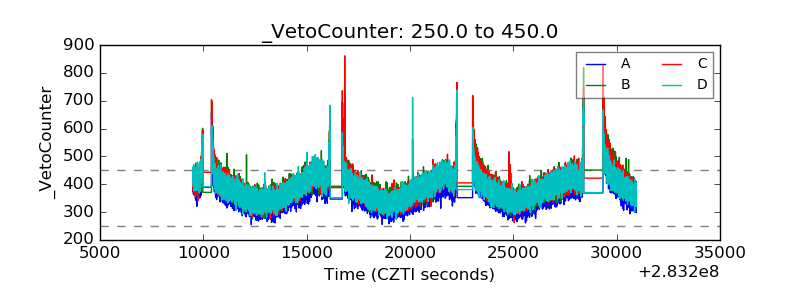 |