| Param | Original file | Final file |
|---|---|---|
| Filename | modeM0/AS1A05_194T05_9000002592_17499cztM0_level2.evt | modeM0/AS1A05_194T05_9000002592_17499cztM0_level2_quad_clean.evt |
| Size (bytes) | 470,401,920 | 96,560,640 |
| Size | 448.6 MB | 92.1 MB |
| Events in quadrant A | 3,240,616 | 630,325 |
| Events in quadrant B | 3,269,973 | 642,417 |
| Events in quadrant C | 3,325,878 | 620,146 |
| Events in quadrant D | 3,989,359 | 599,250 |
| Mode SS | |||
|---|---|---|---|
| Quadrant | BADHDUFLAG | Total packets | Discarded packets |
| A | 0 | 128 | 0 |
| B | 0 | 128 | 0 |
| C | 0 | 128 | 0 |
| D | 0 | 128 | 0 |
| Mode M9 | |||
|---|---|---|---|
| Quadrant | BADHDUFLAG | Total packets | Discarded packets |
| A | 0 | 15 | 0 |
| B | 0 | 16 | 0 |
| C | 0 | 16 | 0 |
| D | 0 | 16 | 0 |
| Mode M0 | |||
|---|---|---|---|
| Quadrant | BADHDUFLAG | Total packets | Discarded packets |
| A | 0 | 13090 | 2 |
| B | 0 | 13142 | 2 |
| C | 0 | 13315 | 3 |
| D | 0 | 15642 | 2 |
| Quadrant | Total seconds | Saturated seconds | Saturation percentage |
|---|---|---|---|
| A | 6183 | 24 | 0.388161% |
| B | 6183 | 29 | 0.469028% |
| C | 6182 | 38 | 0.614688% |
| D | 6182 | 167 | 2.701391% |
Noise dominated data is calculated using 1-second bins in cleaned event files. If a bin has >2000 counts, and if more than 50% of those come from <1% of pixels, then it is considered to be noise-dominated and hence unusable.
| Quadrant | # 1 sec bins | Bins with >0 counts | Bins with >2000 counts | High rate bins dominated by noise | Noise dominated (total time) | Noise dominated (detector-on time) | Marked lightcurve |
|---|---|---|---|---|---|---|---|
| A | 7543 | 6184 | 1 | 1 | 0.01% | 0.02% | 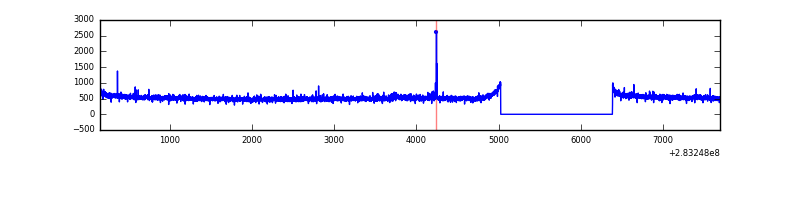 |
| B | 7543 | 6184 | 0 | 0 | 0.00% | 0.00% | 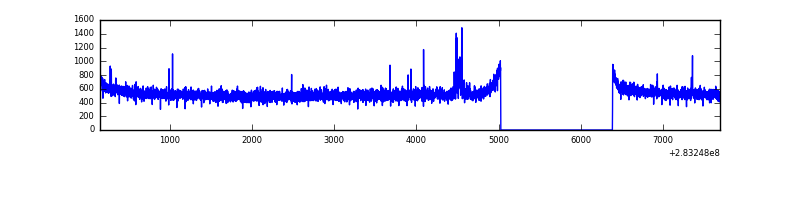 |
| C | 7542 | 6183 | 0 | 0 | 0.00% | 0.00% | 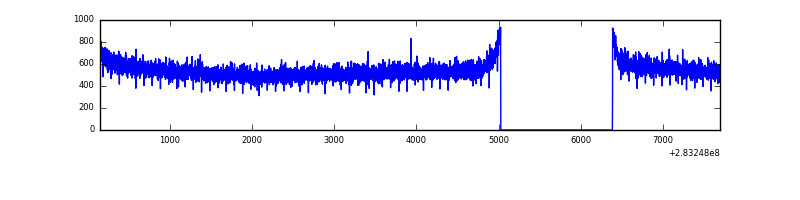 |
| D | 7542 | 6183 | 142 | 142 | 1.88% | 2.30% | 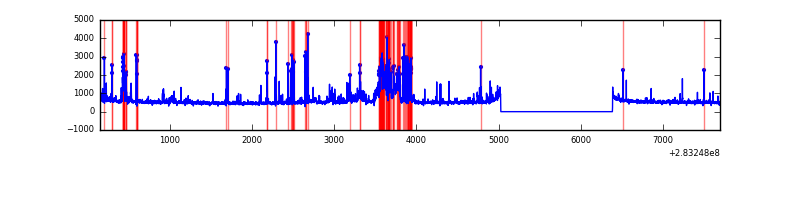 |
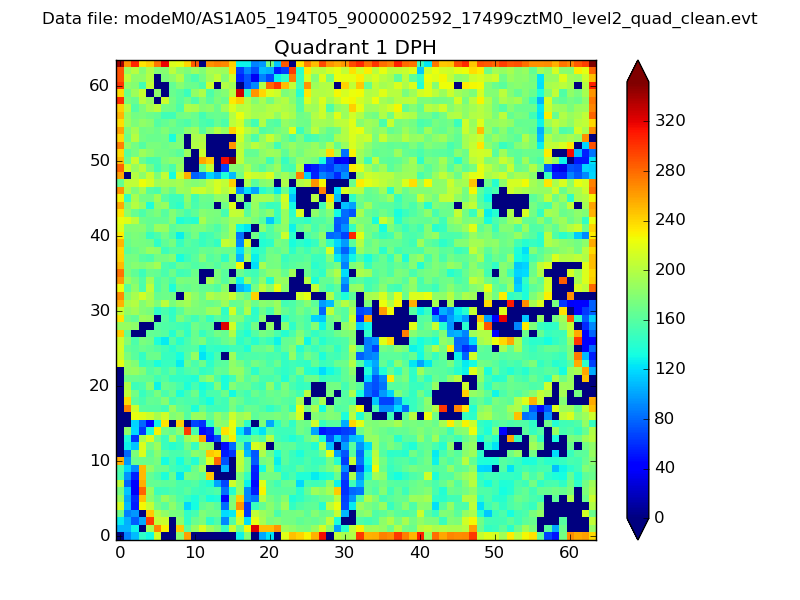
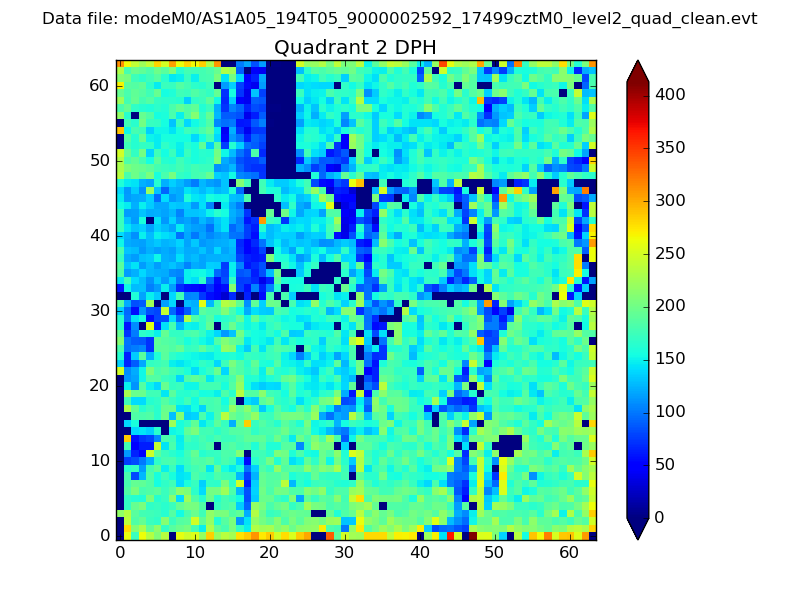
Top three noisy pixels from each quadrant. If the there are fewer than three noisy pixels in the level2.evt file, extra rows are filled as -1
| Pixel properties | Quadrant properties | ||||||
|---|---|---|---|---|---|---|---|
| Quadrant | DetID | PixID | Counts | Sigma | Mean | Median | Sigma |
| A | 15 | 174 | 29474 | 171.64 | 835 | 822 | 166.9 |
| A | 0 | 226 | 7340 | 39.05 | 835 | 822 | 166.9 |
| A | 12 | 194 | 6237 | 32.44 | 835 | 822 | 166.9 |
| B | 0 | 230 | 29311 | 185.66 | 824 | 805 | 153.5 |
| B | 0 | 189 | 18621 | 116.04 | 824 | 805 | 153.5 |
| B | 12 | 111 | 17854 | 111.04 | 824 | 805 | 153.5 |
| C | 14 | 238 | 125222 | 670.74 | 801 | 809 | 185.5 |
| C | 5 | 218 | 58730 | 312.27 | 801 | 809 | 185.5 |
| C | 3 | 233 | 14666 | 74.71 | 801 | 809 | 185.5 |
| D | 11 | 176 | 433453 | 2238.07 | 806 | 786 | 193.3 |
| D | 13 | 189 | 267000 | 1377.05 | 806 | 786 | 193.3 |
| D | 10 | 70 | 75236 | 385.11 | 806 | 786 | 193.3 |
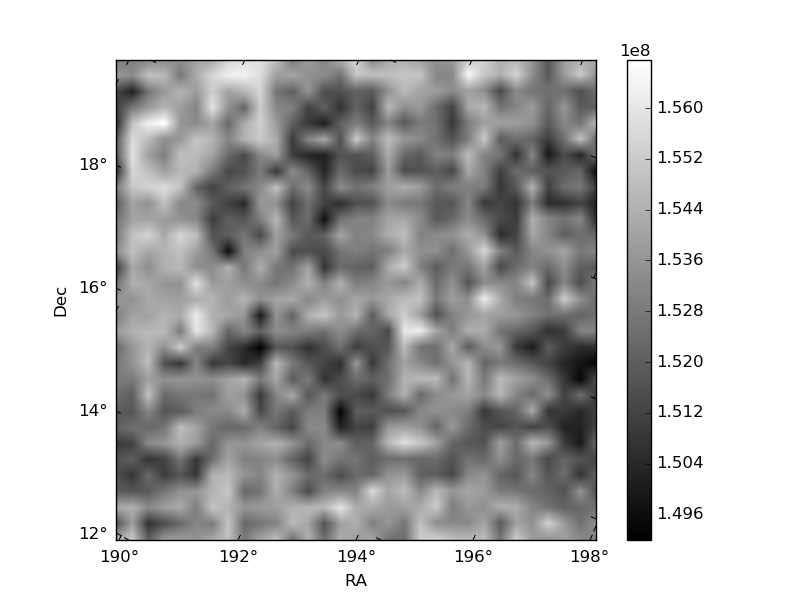
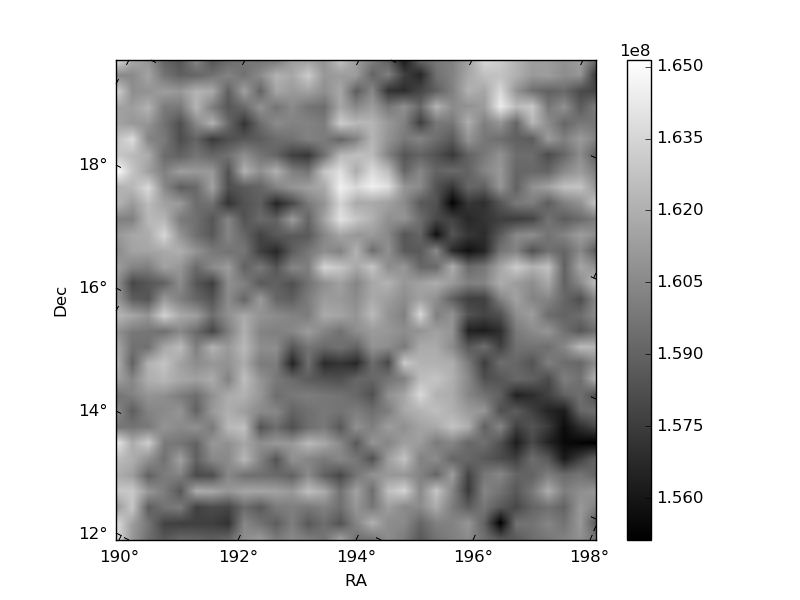
Histogram calculated using DETX and DETY for each event in the final _common_clean file
| Quadrant A | 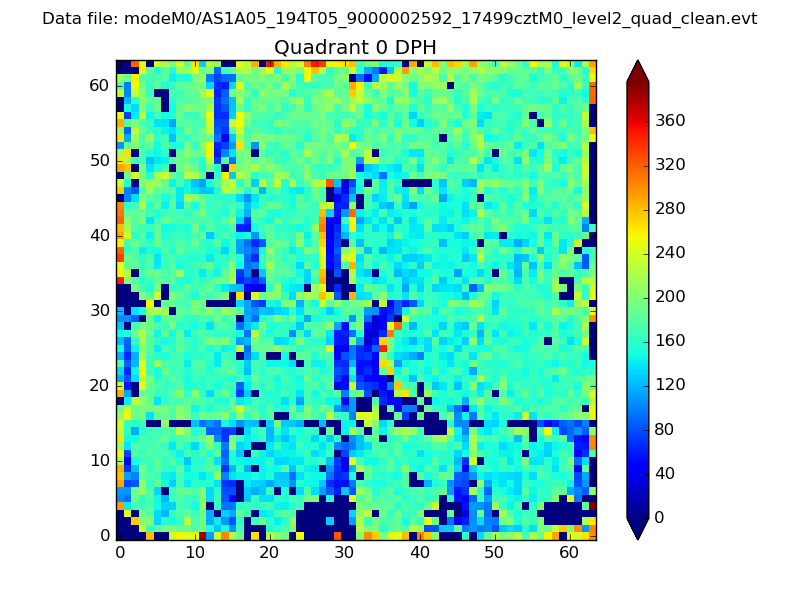 |
 |
Quadrant B |
|---|---|---|---|
| Quadrant D | 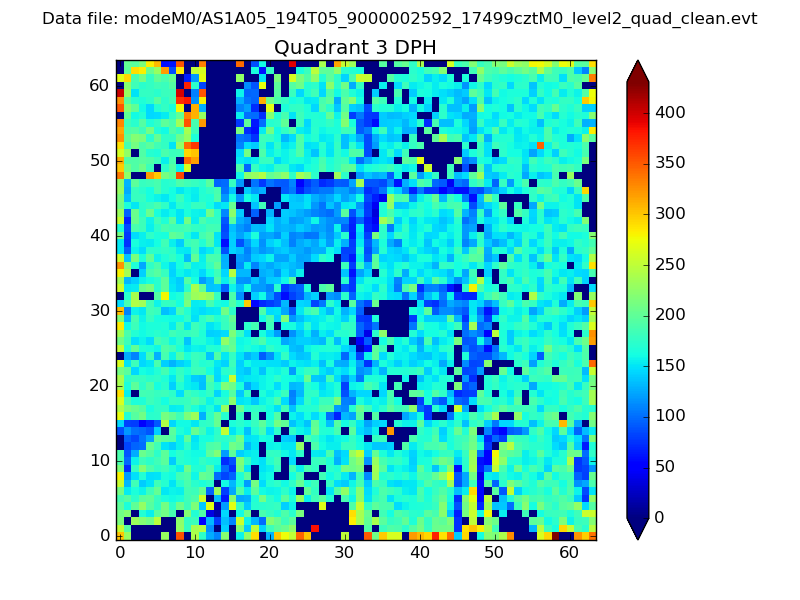 |
 |
Quadrant C |
| Plot type | Count rate plots | Images |
|---|---|---|
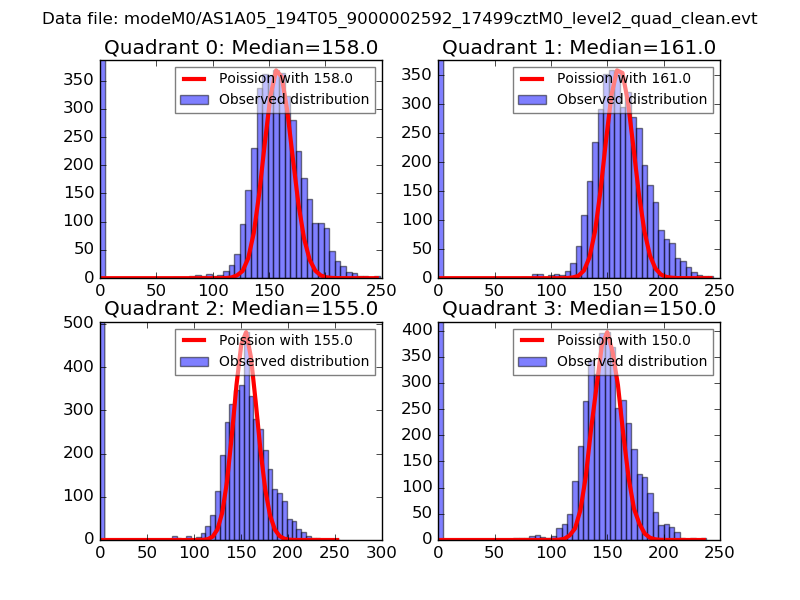
| Comparison with Poisson distribution Blue bars denote a histogram of data divided into 1 sec bins. Red curve is a Poisson curve with rate = median count rate of data. |
 |
 |
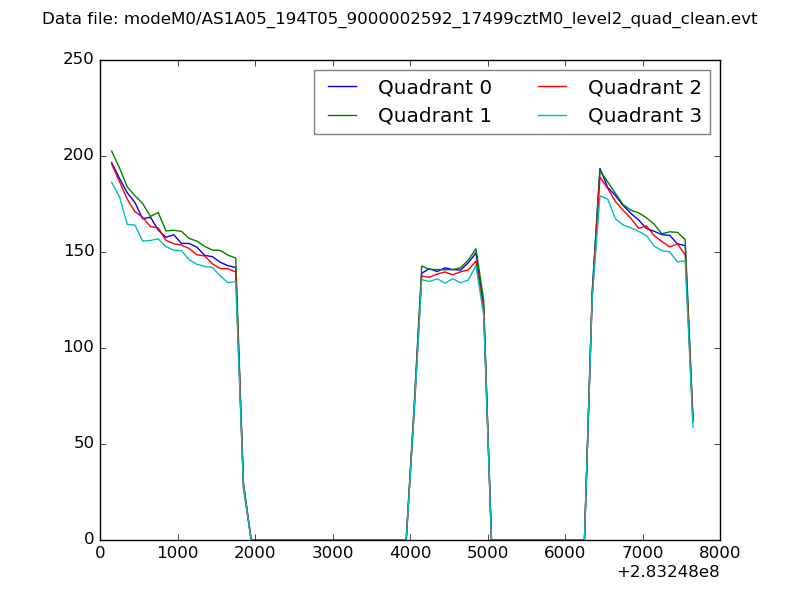
| Quadrant-wise count rates Data is divided into 100 sec bins |
 |
|
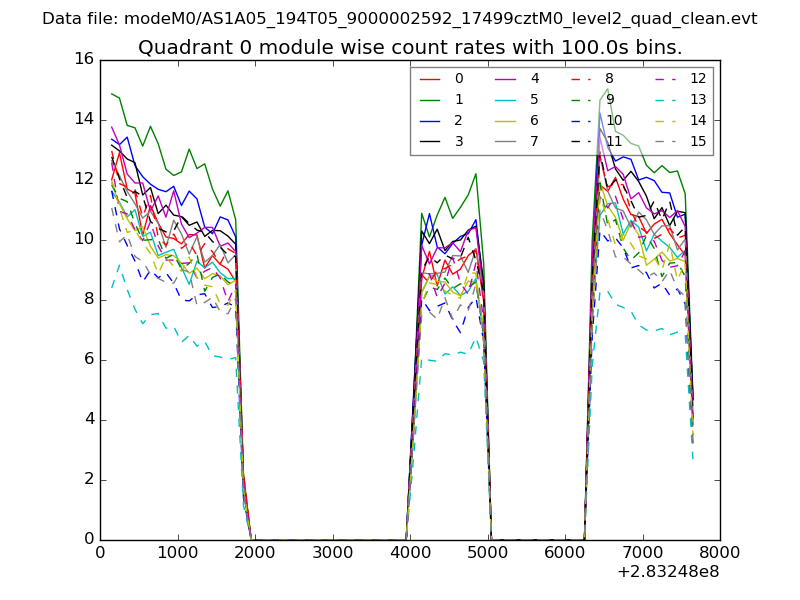
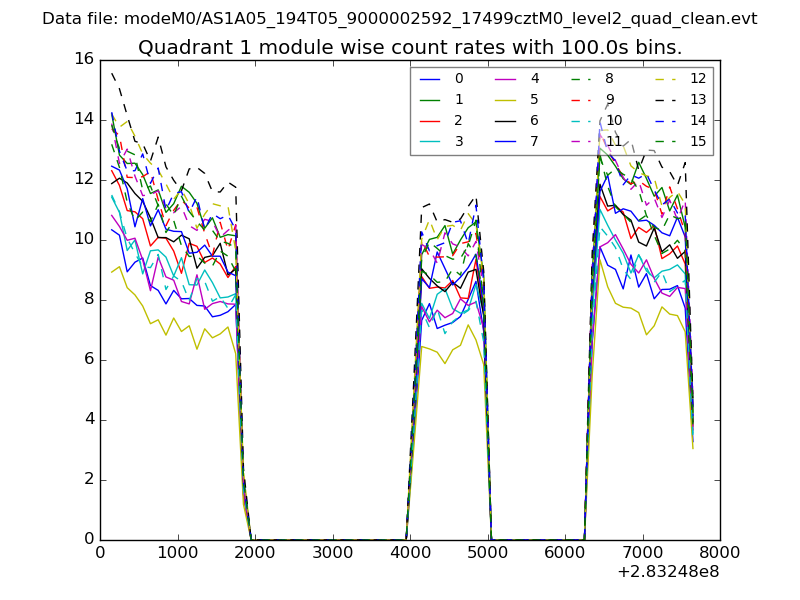
| Module-wise count rates for Quadrant A Data is divided into 100 sec bins |
 |
 |
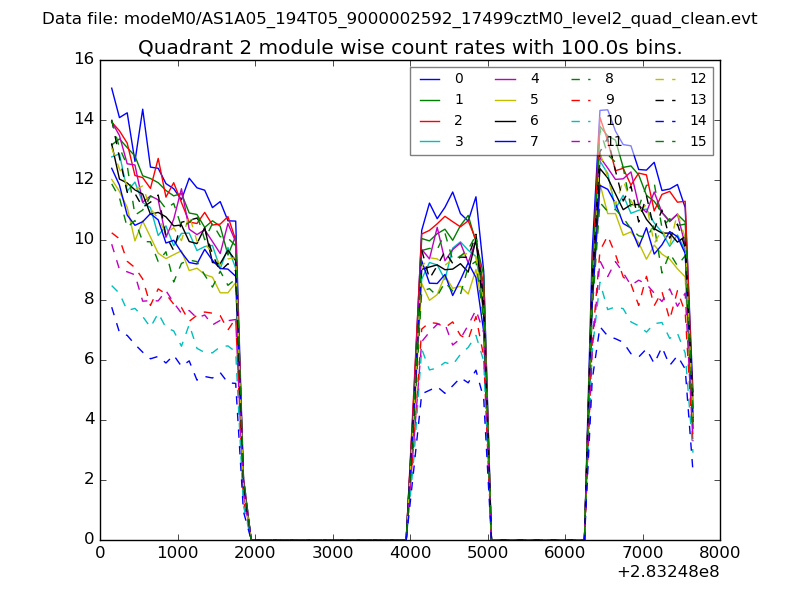
| Module-wise count rates for Quadrant B Data is divided into 100 sec bins |
 |
 |
| Module-wise count rates for Quadrant C Data is divided into 100 sec bins |
 |
 |
| Module-wise count rates for Quadrant D Data is divided into 100 sec bins |
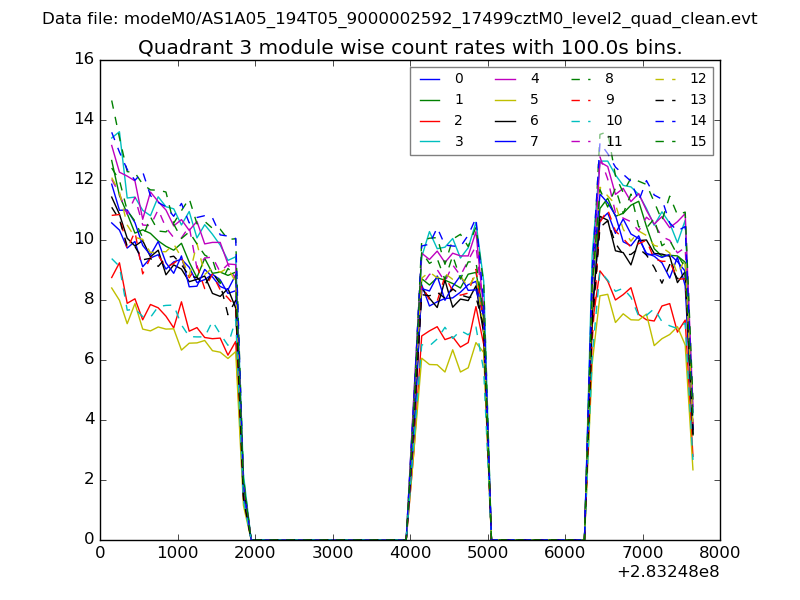 |
 |
| Parameter | Plot |
|---|---|
| CZT HV Monitor | 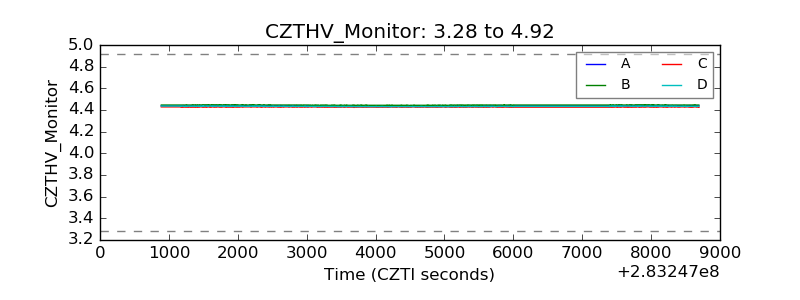 |
| D_VDD | 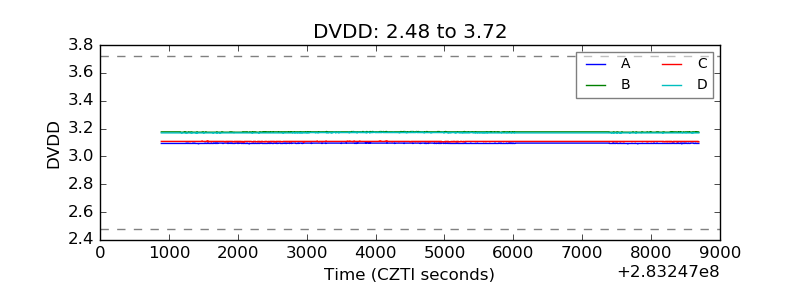 |
| Temperature 1 | 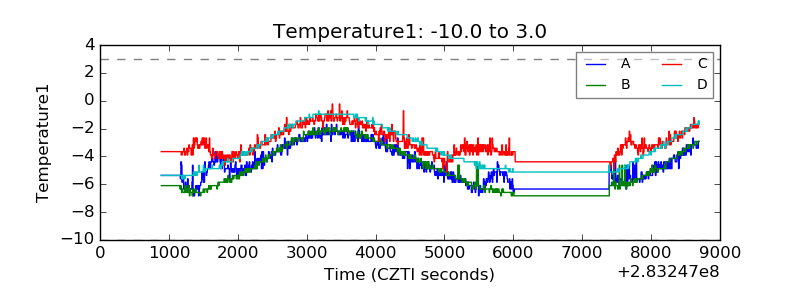 |
| Veto HV Monitor | 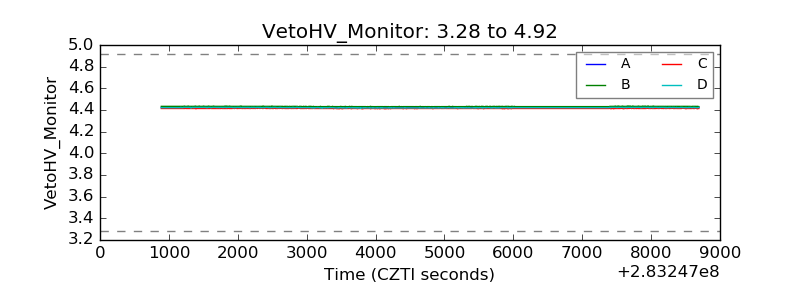 |
| Veto LLD | 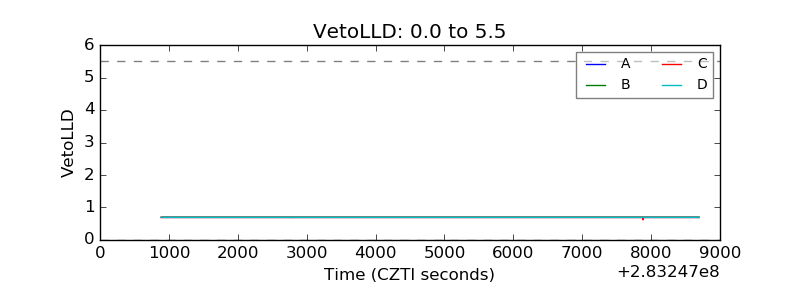 |
| Alpha Counter | 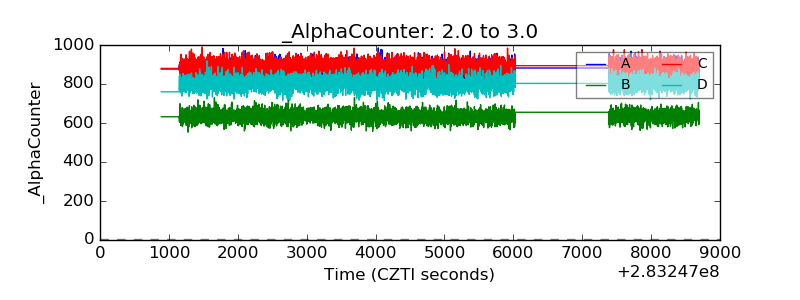 |
| _CPM_Rate | 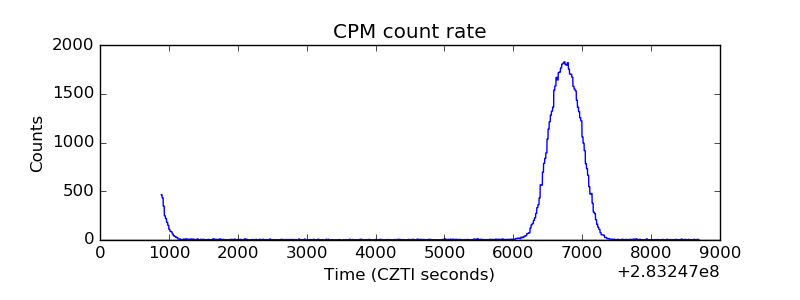 |
| CZT Counter | 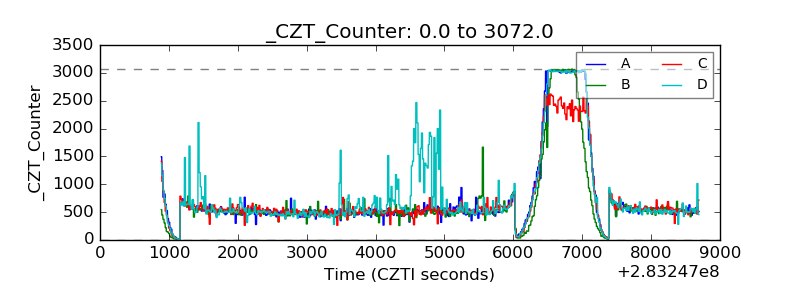 |
| +2.5 Volts monitor |  |
| +5 Volts monitor |  |
| _ROLL_ROT | 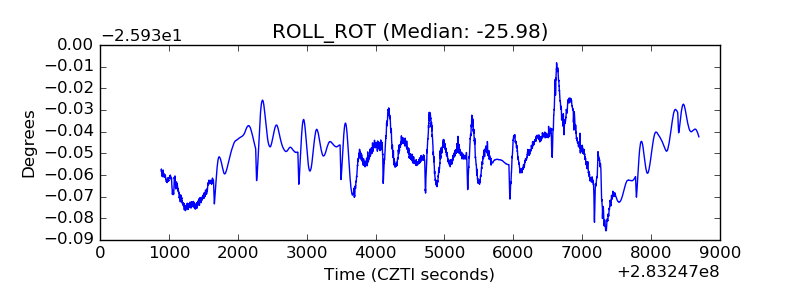 |
| _Roll_DEC |  |
| _Roll_RA | 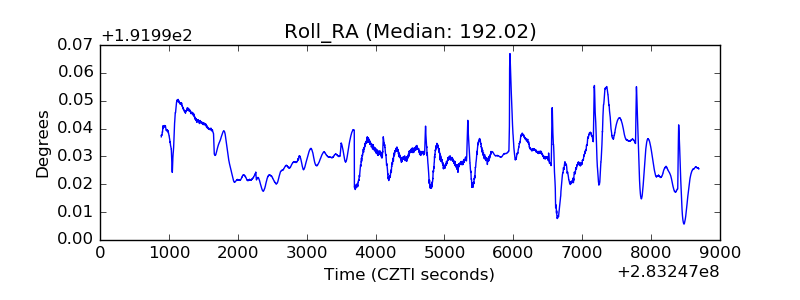 |
| Veto Counter | 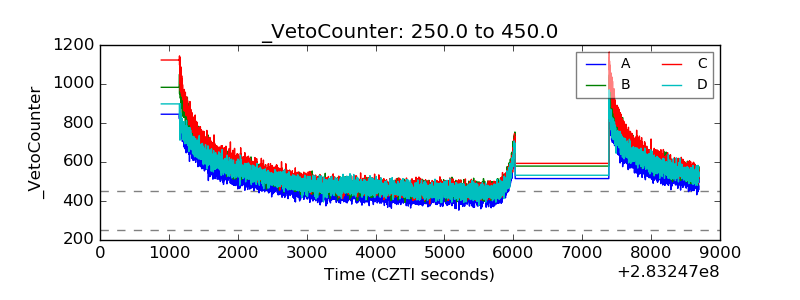 |