| Param | Original file | Final file |
|---|---|---|
| Filename | modeM0/AS1A05_194T05_9000002592_17500cztM0_level2.evt | modeM0/AS1A05_194T05_9000002592_17500cztM0_level2_quad_clean.evt |
| Size (bytes) | 306,527,040 | 51,557,760 |
| Size | 292.3 MB | 49.2 MB |
| Events in quadrant A | 2,165,027 | 318,955 |
| Events in quadrant B | 2,193,463 | 322,887 |
| Events in quadrant C | 2,234,511 | 314,495 |
| Events in quadrant D | 2,400,555 | 305,478 |
| Mode SS | |||
|---|---|---|---|
| Quadrant | BADHDUFLAG | Total packets | Discarded packets |
| A | 0 | 86 | 0 |
| B | 0 | 86 | 0 |
| C | 0 | 86 | 0 |
| D | 0 | 86 | 0 |
| Mode M9 | |||
|---|---|---|---|
| Quadrant | BADHDUFLAG | Total packets | Discarded packets |
| A | 1 | 273359709408 | 0 |
| B | 1 | -1 | -1 |
| C | 1 | -1 | -1 |
| D | 1 | -1 | -1 |
| Mode M0 | |||
|---|---|---|---|
| Quadrant | BADHDUFLAG | Total packets | Discarded packets |
| A | 0 | 8783 | 1 |
| B | 0 | 8847 | 1 |
| C | 0 | 8912 | 1 |
| D | 0 | 9601 | 1 |
| Quadrant | Total seconds | Saturated seconds | Saturation percentage |
|---|---|---|---|
| A | 4243 | 5 | 0.117841% |
| B | 4243 | 9 | 0.212114% |
| C | 4243 | 24 | 0.565638% |
| D | 4243 | 41 | 0.966297% |
Noise dominated data is calculated using 1-second bins in cleaned event files. If a bin has >2000 counts, and if more than 50% of those come from <1% of pixels, then it is considered to be noise-dominated and hence unusable.
| Quadrant | # 1 sec bins | Bins with >0 counts | Bins with >2000 counts | High rate bins dominated by noise | Noise dominated (total time) | Noise dominated (detector-on time) | Marked lightcurve |
|---|---|---|---|---|---|---|---|
| A | 4243 | 4243 | 0 | 0 | 0.00% | 0.00% | 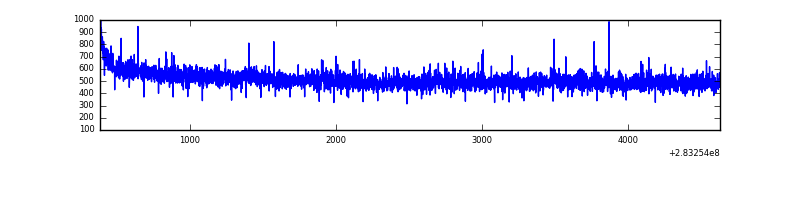 |
| B | 4243 | 4243 | 2 | 2 | 0.05% | 0.05% | 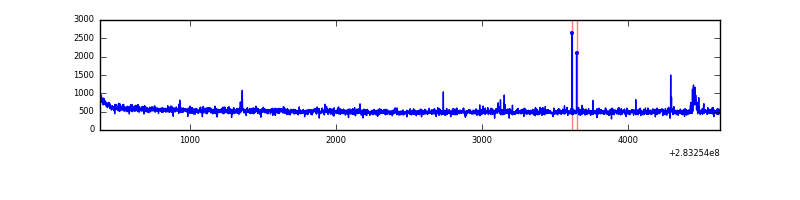 |
| C | 4243 | 4243 | 0 | 0 | 0.00% | 0.00% | 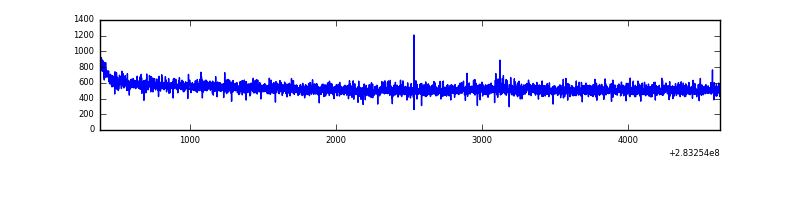 |
| D | 4243 | 4243 | 31 | 31 | 0.73% | 0.73% | 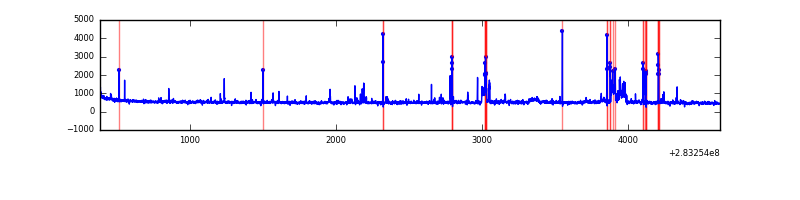 |
Top three noisy pixels from each quadrant. If the there are fewer than three noisy pixels in the level2.evt file, extra rows are filled as -1
| Pixel properties | Quadrant properties | ||||||
|---|---|---|---|---|---|---|---|
| Quadrant | DetID | PixID | Counts | Sigma | Mean | Median | Sigma |
| A | 0 | 226 | 5094 | 40.45 | 561 | 552 | 112.3 |
| A | 12 | 194 | 4248 | 32.91 | 561 | 552 | 112.3 |
| A | 3 | 137 | 3564 | 26.82 | 561 | 552 | 112.3 |
| B | 0 | 230 | 17898 | 166.59 | 553 | 542 | 104.2 |
| B | 12 | 111 | 11527 | 105.44 | 553 | 542 | 104.2 |
| B | 11 | 111 | 10015 | 90.92 | 553 | 542 | 104.2 |
| C | 14 | 238 | 86467 | 687.63 | 539 | 543 | 125.0 |
| C | 5 | 218 | 32732 | 257.6 | 539 | 543 | 125.0 |
| C | 3 | 233 | 14203 | 109.32 | 539 | 543 | 125.0 |
| D | 1 | 52 | 119096 | 883.64 | 548 | 534 | 134.2 |
| D | 7 | 238 | 77862 | 576.33 | 548 | 534 | 134.2 |
| D | 7 | 38 | 34910 | 256.2 | 548 | 534 | 134.2 |
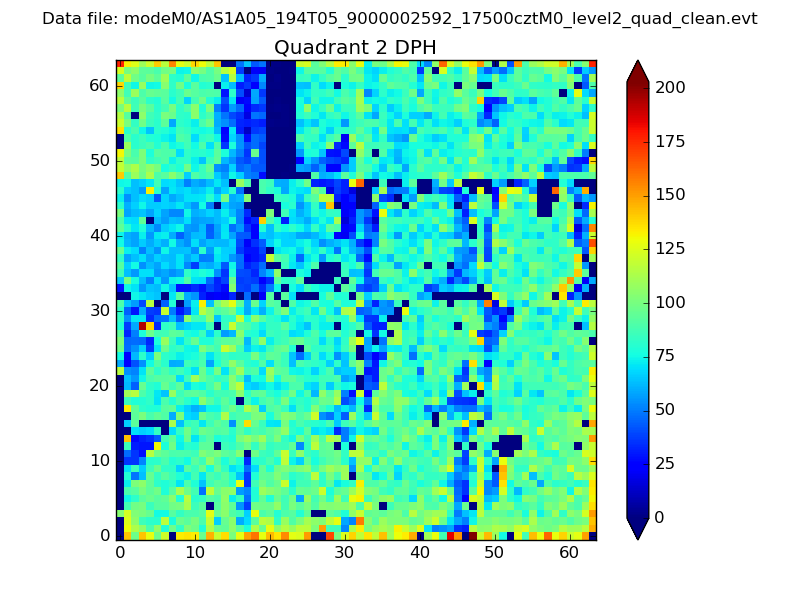
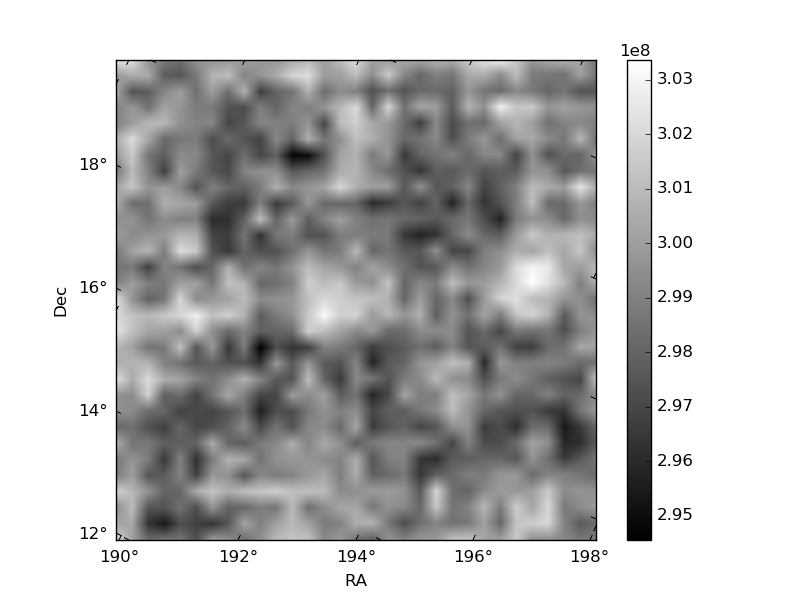
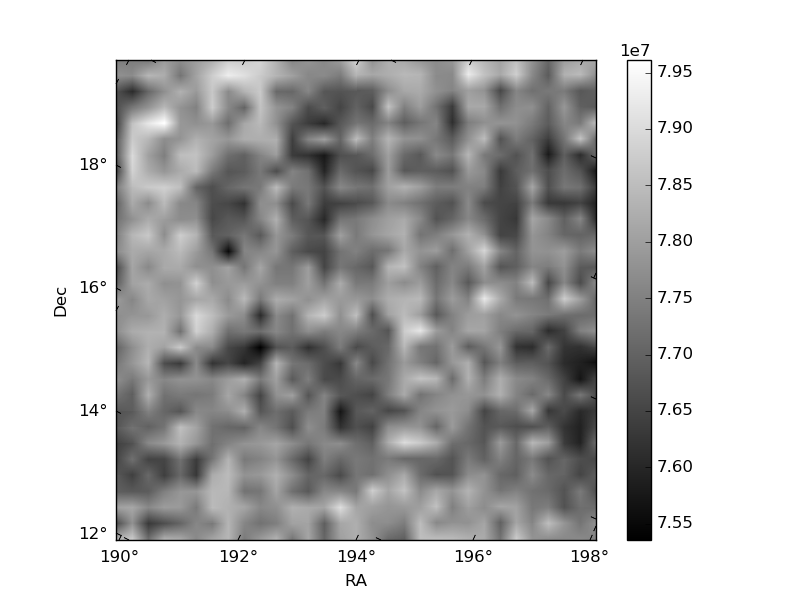
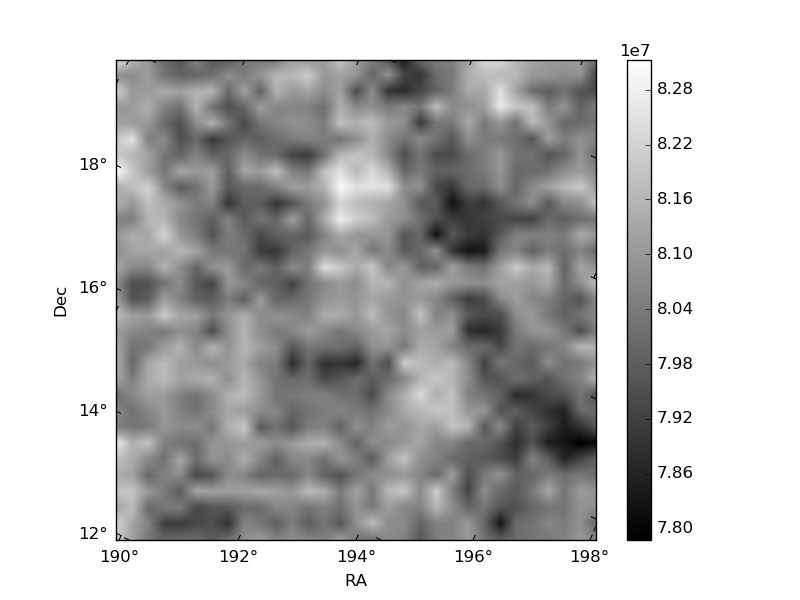
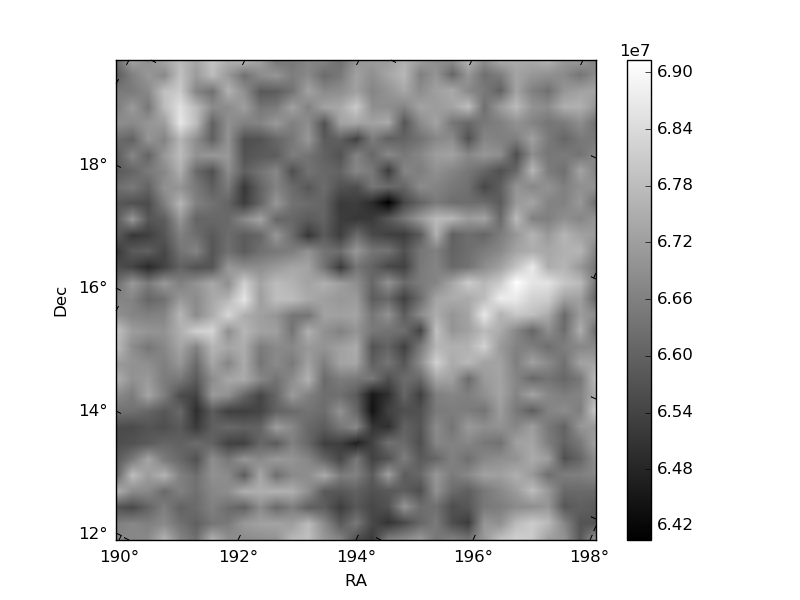
Histogram calculated using DETX and DETY for each event in the final _common_clean file
| Quadrant A | 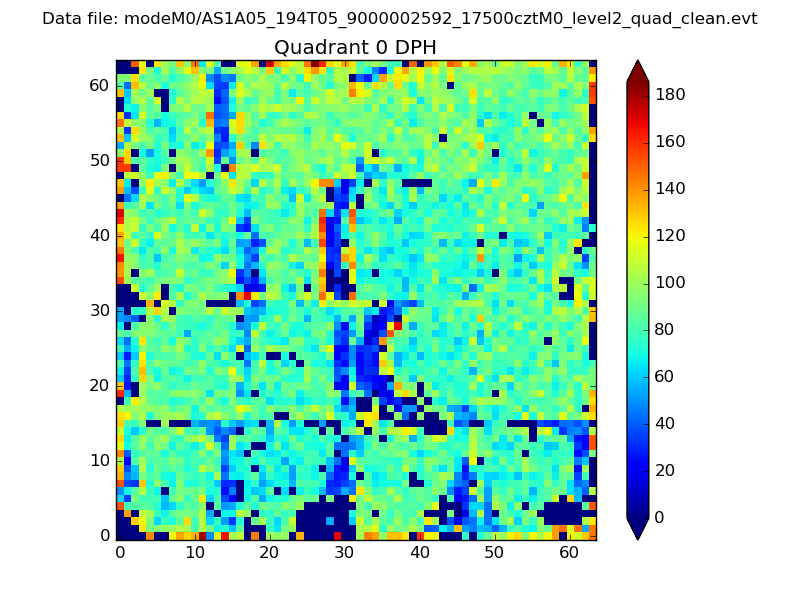 |
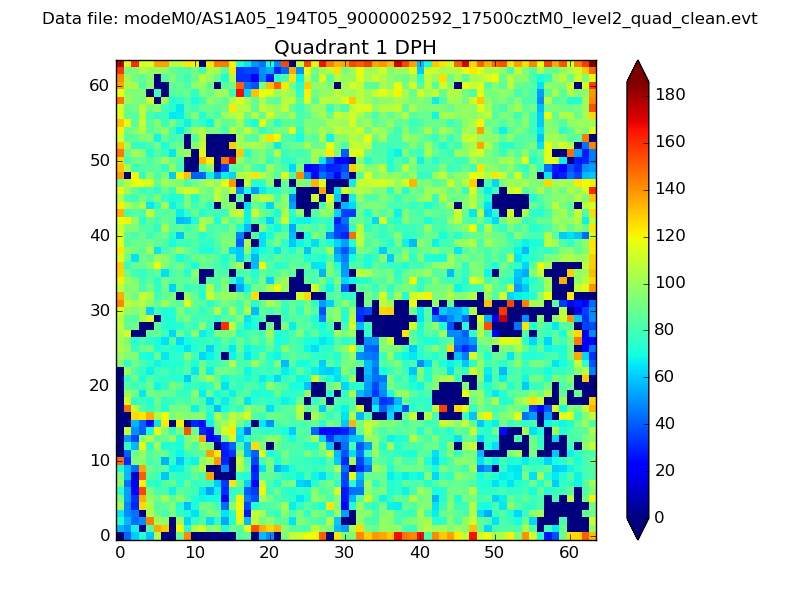 |
Quadrant B |
|---|---|---|---|
| Quadrant D | 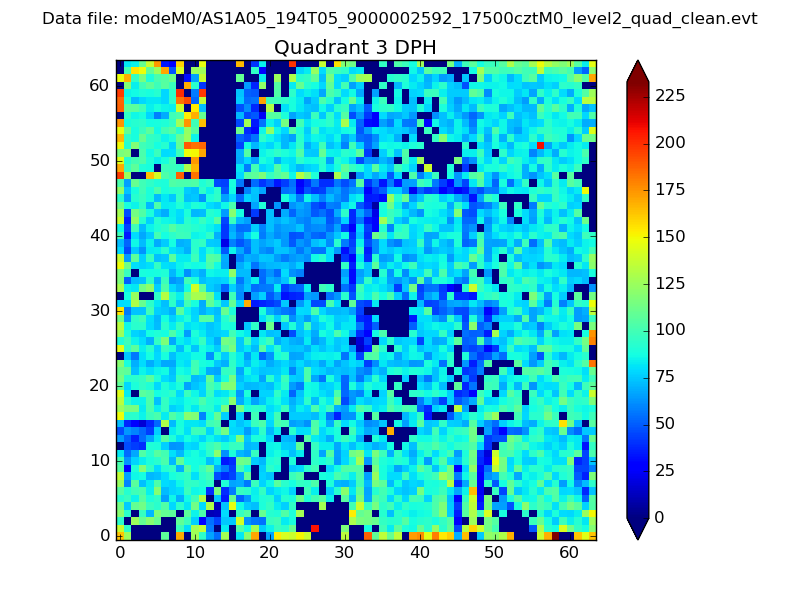 |
 |
Quadrant C |
| Plot type | Count rate plots | Images |
|---|---|---|
| Comparison with Poisson distribution Blue bars denote a histogram of data divided into 1 sec bins. Red curve is a Poisson curve with rate = median count rate of data. |
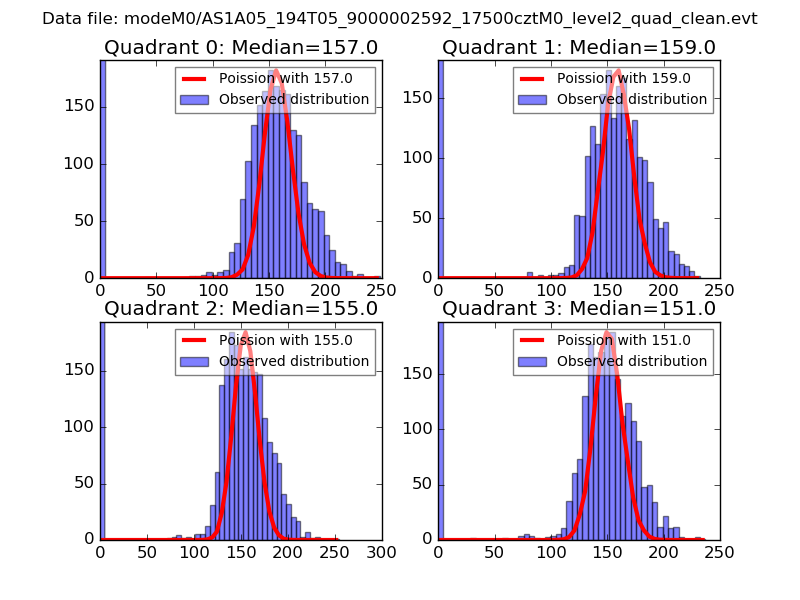 |
 |
| Quadrant-wise count rates Data is divided into 100 sec bins |
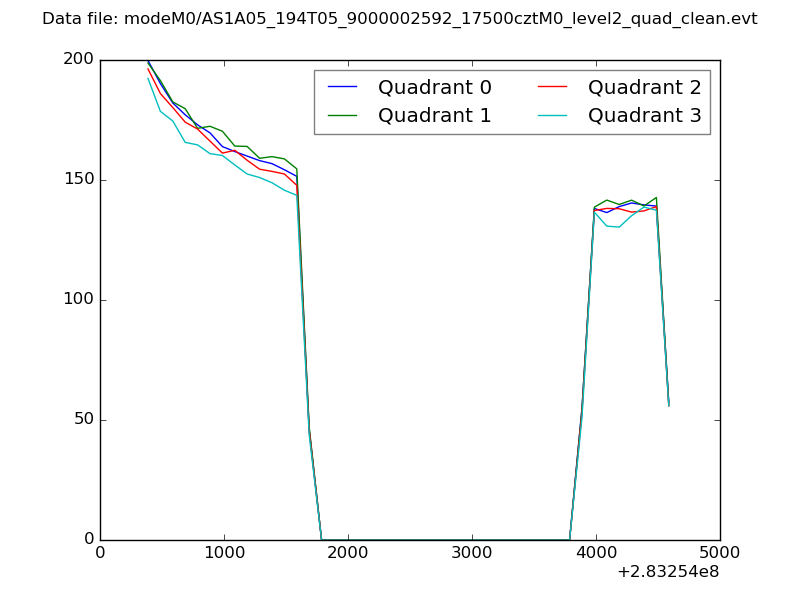 |
|
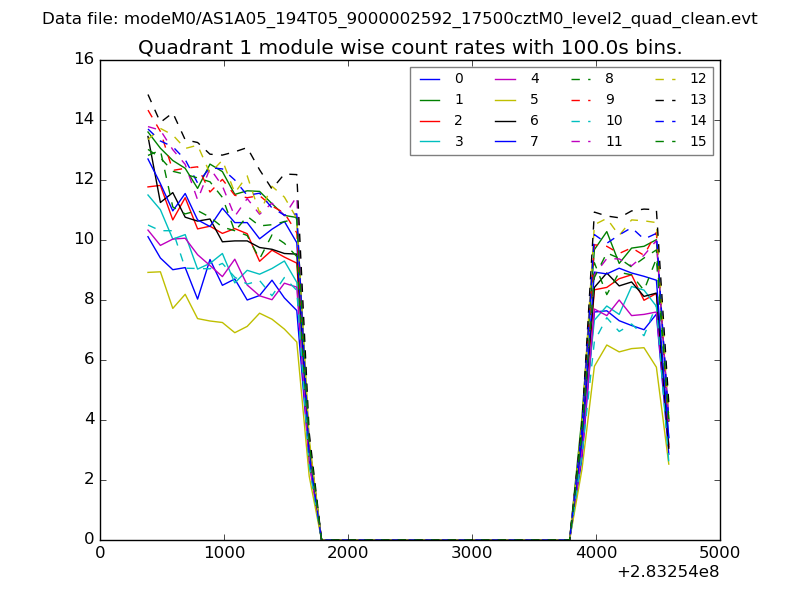
| Module-wise count rates for Quadrant A Data is divided into 100 sec bins |
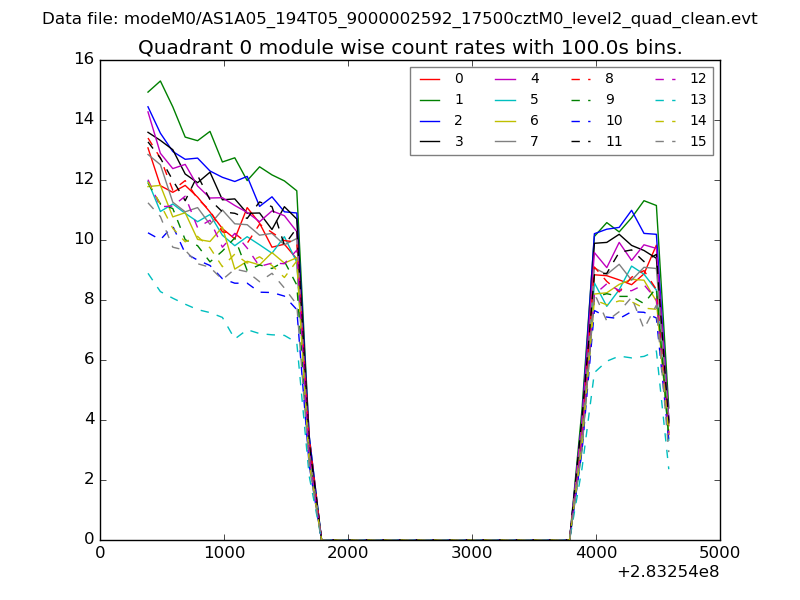 |
 |
| Module-wise count rates for Quadrant B Data is divided into 100 sec bins |
 |
 |
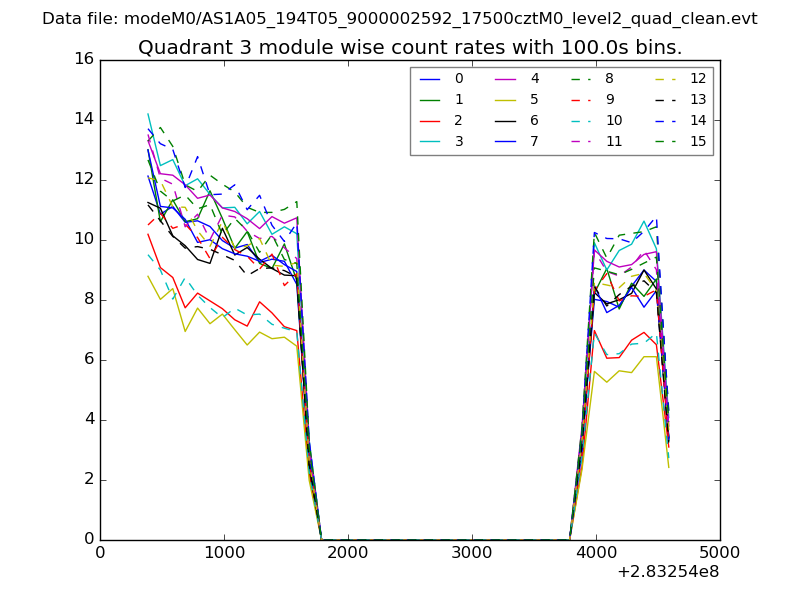
| Module-wise count rates for Quadrant C Data is divided into 100 sec bins |
 |
 |
| Module-wise count rates for Quadrant D Data is divided into 100 sec bins |
 |
 |
| Parameter | Plot |
|---|---|
| CZT HV Monitor |  |
| D_VDD | 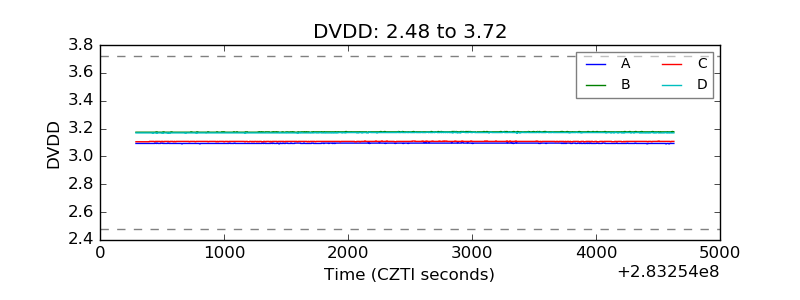 |
| Temperature 1 | 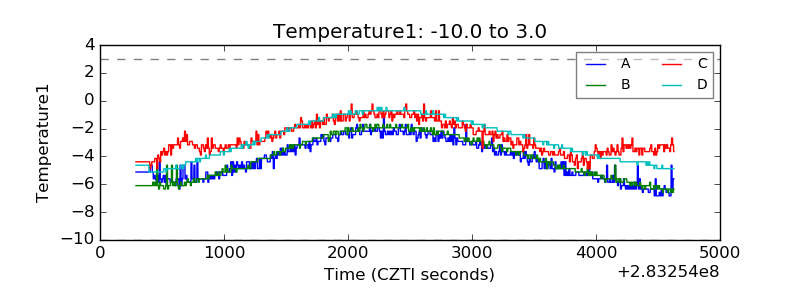 |
| Veto HV Monitor | 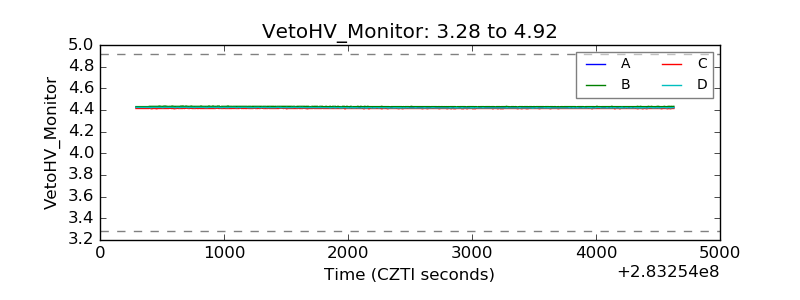 |
| Veto LLD | 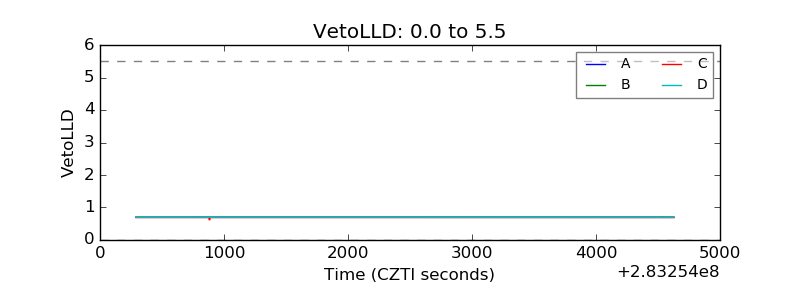 |
| Alpha Counter | 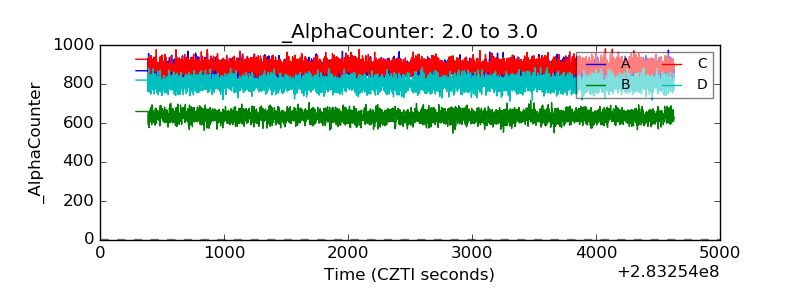 |
| _CPM_Rate | 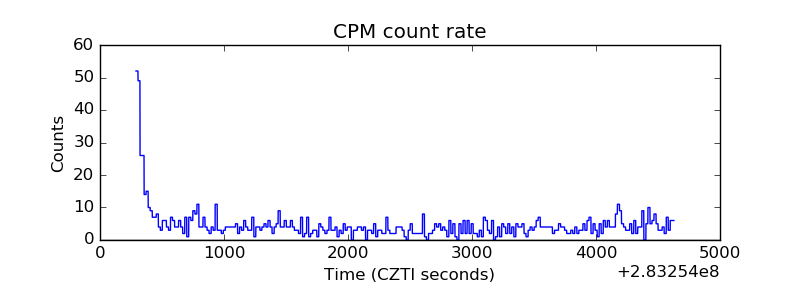 |
| CZT Counter | 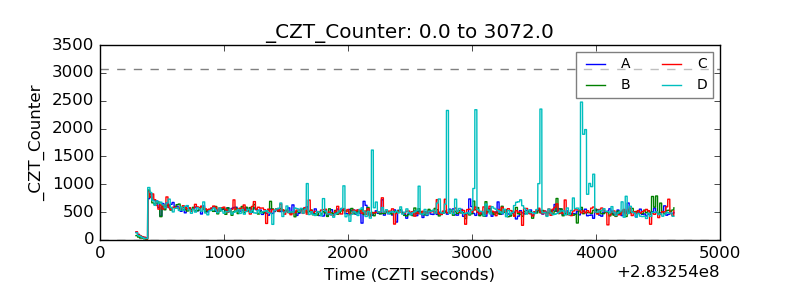 |
| +2.5 Volts monitor |  |
| +5 Volts monitor | 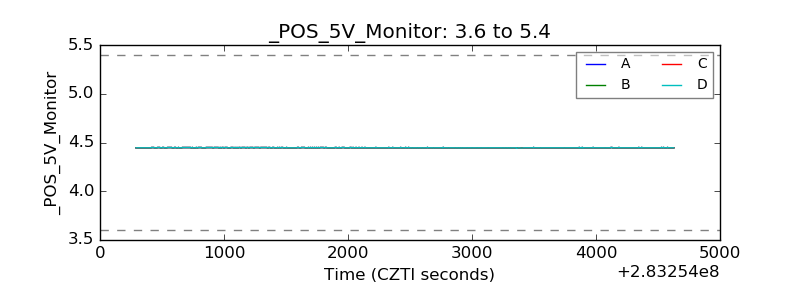 |
| _ROLL_ROT | 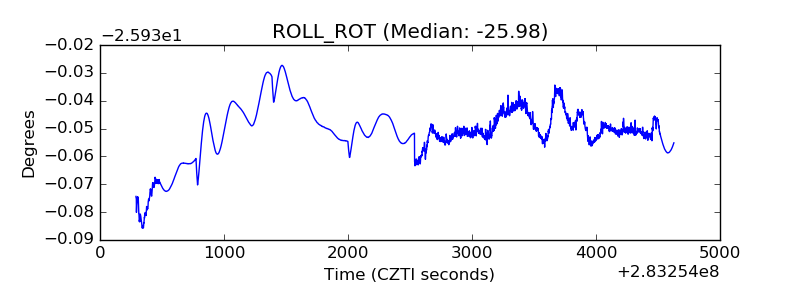 |
| _Roll_DEC | 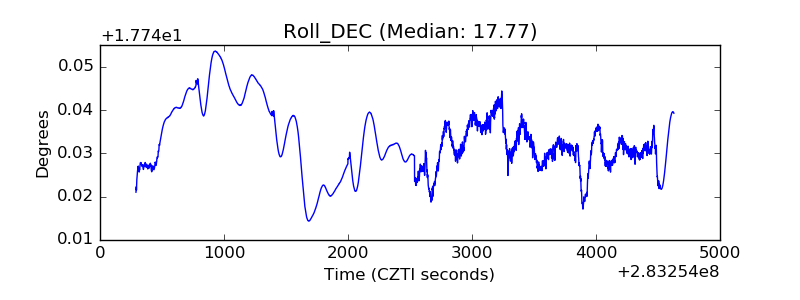 |
| _Roll_RA | 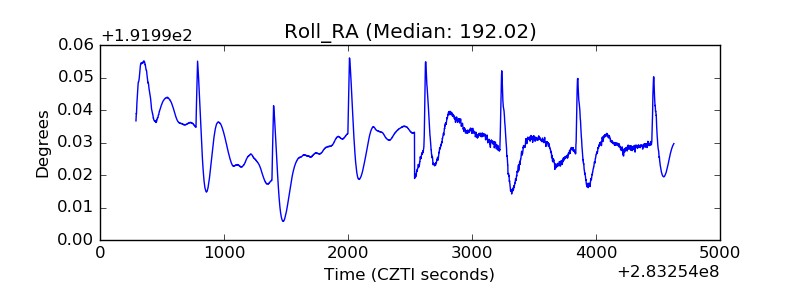 |
| Veto Counter | 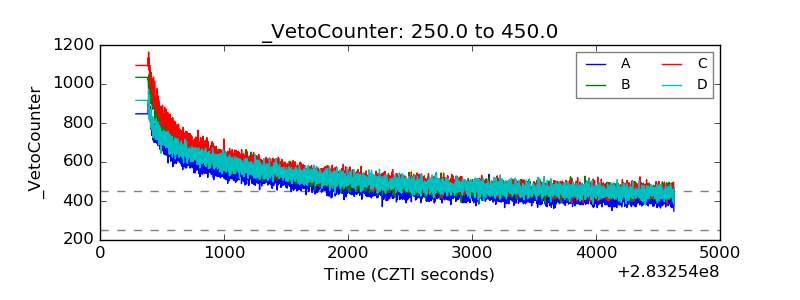 |