| Param | Original file | Final file |
|---|---|---|
| Filename | modeM0/AS1T03_051T01_9000002588cztM0_level2.fits | modeM0/AS1T03_051T01_9000002588cztM0_level2_quad_clean.evt |
| Size (bytes) | 295,574,400 | 169,920,000 |
| Size | 281.9 MB | 162.0 MB |
| Events in quadrant A | 1,877,982 | 852,564 |
| Events in quadrant B | 1,781,482 | 853,094 |
| Events in quadrant C | 1,832,424 | 813,367 |
| Events in quadrant D | 1,500,988 | 667,337 |
| Mode M9 | |||
|---|---|---|---|
| Quadrant | BADHDUFLAG | Total packets | Discarded packets |
| A | 0 | 61 | 0 |
| B | 0 | 61 | 0 |
| C | 0 | 61 | 0 |
| D | 0 | 61 | 0 |
| Mode M0 | |||
|---|---|---|---|
| Quadrant | BADHDUFLAG | Total packets | Discarded packets |
| A | 0 | 59795 | 0 |
| B | 0 | 62902 | 0 |
| C | 0 | 60030 | 0 |
| D | 0 | 100443 | 0 |
| Mode SS | |||
|---|---|---|---|
| Quadrant | BADHDUFLAG | Total packets | Discarded packets |
| A | 0 | 578 | 0 |
| B | 0 | 578 | 0 |
| C | 0 | 578 | 0 |
| D | 0 | 578 | 0 |
| Quadrant | Total seconds | Saturated seconds | Saturation percentage |
|---|---|---|---|
| A | 28477 | 280 | 0.983250% |
| B | 28477 | 414 | 1.453805% |
| C | 28477 | 412 | 1.446782% |
| D | 28477 | 4298 | 15.092882% |
Noise dominated data is calculated using 1-second bins in cleaned event files. If a bin has >2000 counts, and if more than 50% of those come from <1% of pixels, then it is considered to be noise-dominated and hence unusable.
| Quadrant | # 1 sec bins | Bins with >0 counts | Bins with >2000 counts | High rate bins dominated by noise | Noise dominated (total time) | Noise dominated (detector-on time) | Marked lightcurve |
|---|---|---|---|---|---|---|---|
| A | 34472 | 28470 | 0 | 0 | 0.00% | 0.00% |  |
| B | 34472 | 28474 | 0 | 0 | 0.00% | 0.00% |  |
| C | 34472 | 28474 | 0 | 0 | 0.00% | 0.00% |  |
| D | 34472 | 28473 | 0 | 0 | 0.00% | 0.00% |  |
Top three noisy pixels from each quadrant. If the there are fewer than three noisy pixels in the level2.evt file, extra rows are filled as -1
| Pixel properties | Quadrant properties | ||||||
|---|---|---|---|---|---|---|---|
| Quadrant | DetID | PixID | Counts | Sigma | Mean | Median | Sigma |
| A | 0 | 29 | 1727 | 10.5 | 489 | 462 | 120.4 |
| A | 7 | 110 | 1510 | 8.7 | 489 | 462 | 120.4 |
| A | 9 | 19 | 1417 | 7.93 | 489 | 462 | 120.4 |
| B | 2 | 9 | 1484 | 10.96 | 471 | 450 | 94.3 |
| B | 2 | 8 | 1279 | 8.79 | 471 | 450 | 94.3 |
| B | 3 | 17 | 1213 | 8.09 | 471 | 450 | 94.3 |
| C | 3 | 126 | 1303 | 6.86 | 484 | 456 | 123.4 |
| C | 12 | 241 | 1210 | 6.1 | 484 | 456 | 123.4 |
| C | 9 | 233 | 1198 | 6.01 | 484 | 456 | 123.4 |
| D | 3 | 14 | 1101 | 6.36 | 428 | 392 | 111.4 |
| D | 6 | 67 | 1099 | 6.35 | 428 | 392 | 111.4 |
| D | 10 | 189 | 1076 | 6.14 | 428 | 392 | 111.4 |
Histogram calculated using DETX and DETY for each event in the final _common_clean file
| Quadrant A | 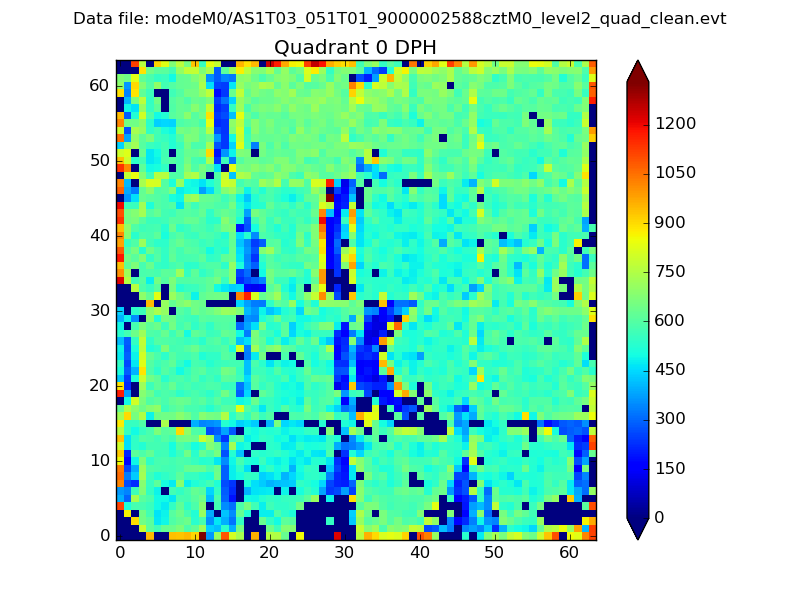 |
 |
Quadrant B |
|---|---|---|---|
| Quadrant D |  |
 |
Quadrant C |
| Plot type | Count rate plots | Images |
|---|---|---|
| Comparison with Poisson distribution Blue bars denote a histogram of data divided into 1 sec bins. Red curve is a Poisson curve with rate = median count rate of data. |
 |
 |
| Quadrant-wise count rates Data is divided into 100 sec bins |
 |
|
| Module-wise count rates for Quadrant A Data is divided into 100 sec bins |
 |
 |
| Module-wise count rates for Quadrant B Data is divided into 100 sec bins |
 |
 |
| Module-wise count rates for Quadrant C Data is divided into 100 sec bins |
 |
 |
| Module-wise count rates for Quadrant D Data is divided into 100 sec bins |
 |
 |
| Parameter | Plot |
|---|---|
| CZT HV Monitor |  |
| D_VDD | 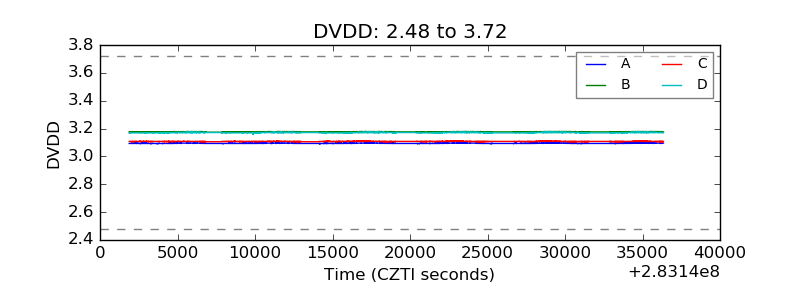 |
| Temperature 1 |  |
| Veto HV Monitor |  |
| Veto LLD |  |
| Alpha Counter |  |
| _CPM_Rate |  |
| CZT Counter |  |
| +2.5 Volts monitor |  |
| +5 Volts monitor |  |
| _ROLL_ROT |  |
| _Roll_DEC |  |
| _Roll_RA |  |
| Veto Counter |  |