| Param | Original file | Final file |
|---|---|---|
| Filename | modeM0/AS1T03_051T01_9000002588_17480cztM0_level2.evt | modeM0/AS1T03_051T01_9000002588_17480cztM0_level2_quad_clean.evt |
| Size (bytes) | 426,242,880 | 87,598,080 |
| Size | 406.5 MB | 83.5 MB |
| Events in quadrant A | 3,057,454 | 553,200 |
| Events in quadrant B | 3,084,270 | 567,007 |
| Events in quadrant C | 3,112,203 | 544,172 |
| Events in quadrant D | 3,211,796 | 533,939 |
| Mode M9 | |||
|---|---|---|---|
| Quadrant | BADHDUFLAG | Total packets | Discarded packets |
| A | 0 | 10 | 0 |
| B | 0 | 10 | 0 |
| C | 0 | 10 | 0 |
| D | 0 | 10 | 0 |
| Mode M0 | |||
|---|---|---|---|
| Quadrant | BADHDUFLAG | Total packets | Discarded packets |
| A | 0 | 13301 | 1 |
| B | 0 | 13309 | 1 |
| C | 0 | 13271 | 1 |
| D | 0 | 13775 | 1 |
| Mode SS | |||
|---|---|---|---|
| Quadrant | BADHDUFLAG | Total packets | Discarded packets |
| A | 0 | 134 | 0 |
| B | 0 | 134 | 0 |
| C | 0 | 134 | 0 |
| D | 0 | 134 | 0 |
| Quadrant | Total seconds | Saturated seconds | Saturation percentage |
|---|---|---|---|
| A | 6509 | 24 | 0.368720% |
| B | 6509 | 26 | 0.399447% |
| C | 6509 | 62 | 0.952527% |
| D | 6509 | 29 | 0.445537% |
Noise dominated data is calculated using 1-second bins in cleaned event files. If a bin has >2000 counts, and if more than 50% of those come from <1% of pixels, then it is considered to be noise-dominated and hence unusable.
| Quadrant | # 1 sec bins | Bins with >0 counts | Bins with >2000 counts | High rate bins dominated by noise | Noise dominated (total time) | Noise dominated (detector-on time) | Marked lightcurve |
|---|---|---|---|---|---|---|---|
| A | 7509 | 6510 | 1 | 1 | 0.01% | 0.02% | 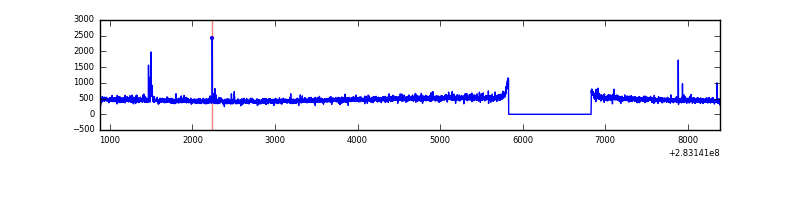 |
| B | 7509 | 6510 | 0 | 0 | 0.00% | 0.00% | 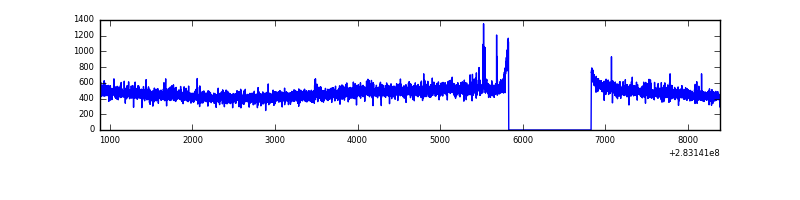 |
| C | 7509 | 6510 | 0 | 0 | 0.00% | 0.00% | 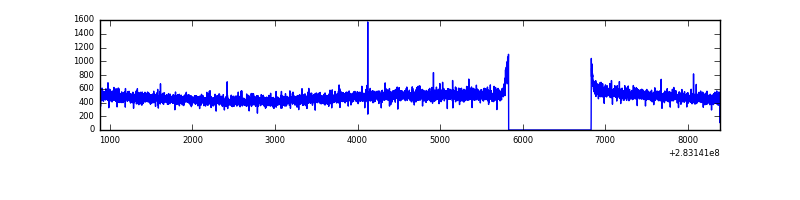 |
| D | 7509 | 6510 | 8 | 8 | 0.11% | 0.12% | 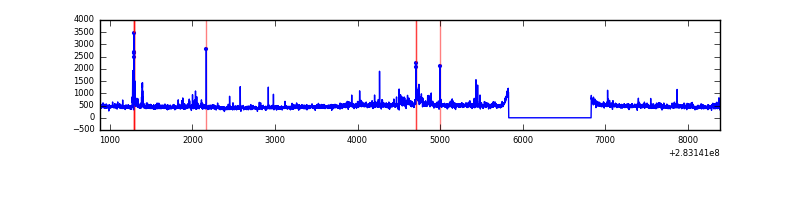 |
Top three noisy pixels from each quadrant. If the there are fewer than three noisy pixels in the level2.evt file, extra rows are filled as -1
| Pixel properties | Quadrant properties | ||||||
|---|---|---|---|---|---|---|---|
| Quadrant | DetID | PixID | Counts | Sigma | Mean | Median | Sigma |
| A | 15 | 174 | 36611 | 224.58 | 783 | 764 | 159.6 |
| A | 14 | 237 | 7024 | 39.22 | 783 | 764 | 159.6 |
| A | 0 | 226 | 6797 | 37.8 | 783 | 764 | 159.6 |
| B | 12 | 111 | 17866 | 113.58 | 784 | 764 | 150.6 |
| B | 11 | 111 | 15133 | 95.43 | 784 | 764 | 150.6 |
| B | 14 | 111 | 12736 | 79.51 | 784 | 764 | 150.6 |
| C | 14 | 238 | 117200 | 649.14 | 761 | 767 | 179.4 |
| C | 5 | 218 | 14305 | 75.48 | 761 | 767 | 179.4 |
| C | 3 | 233 | 13259 | 69.65 | 761 | 767 | 179.4 |
| D | 11 | 176 | 108631 | 578.25 | 767 | 747 | 186.6 |
| D | 5 | 222 | 97908 | 520.77 | 767 | 747 | 186.6 |
| D | 13 | 189 | 33657 | 176.39 | 767 | 747 | 186.6 |
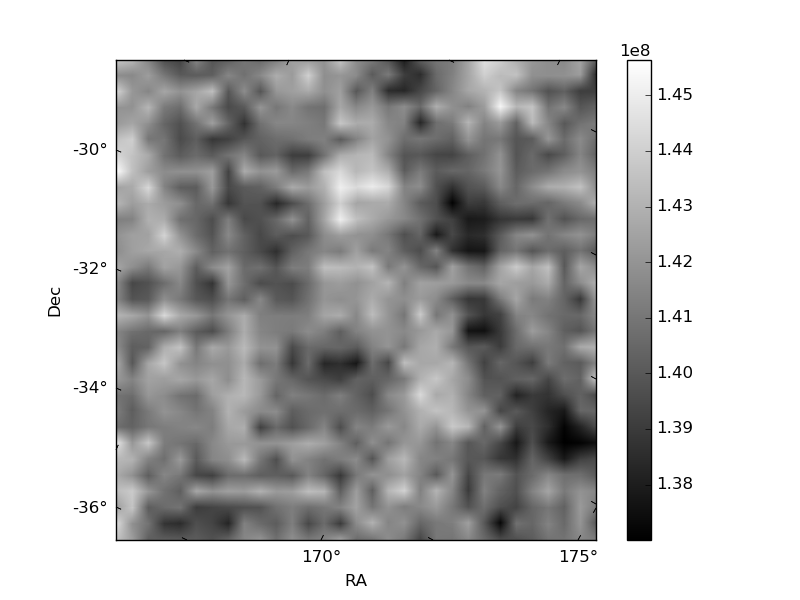
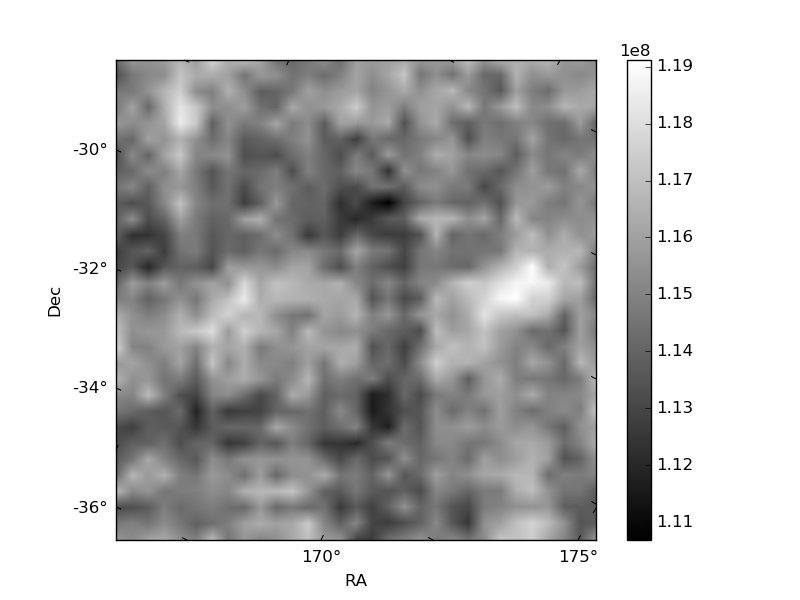
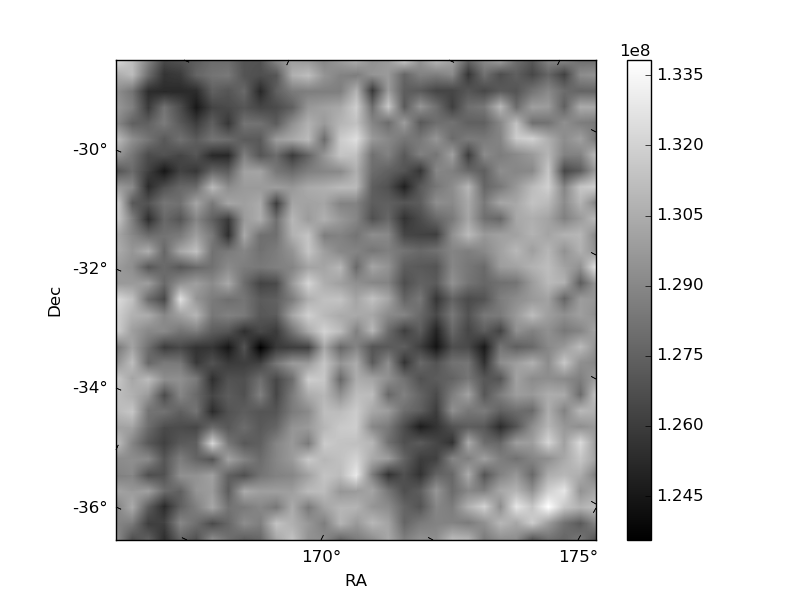
Histogram calculated using DETX and DETY for each event in the final _common_clean file
| Quadrant A | 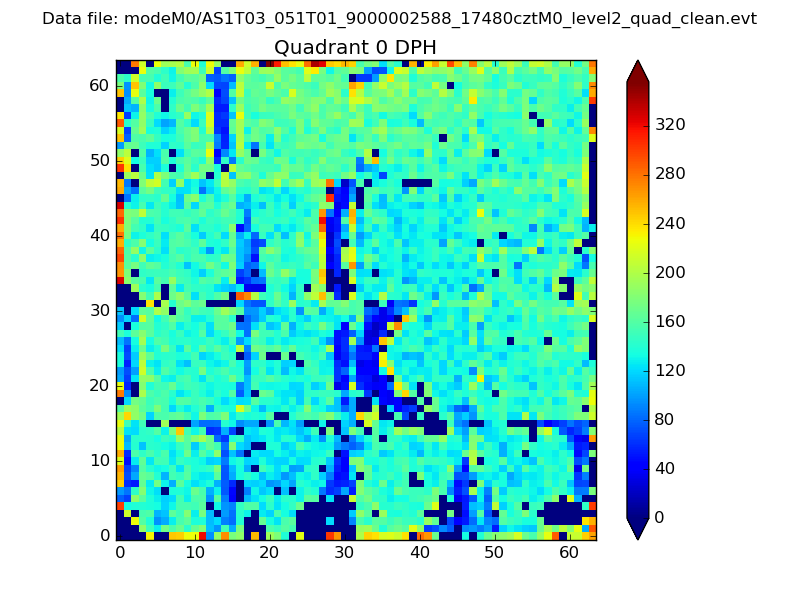 |
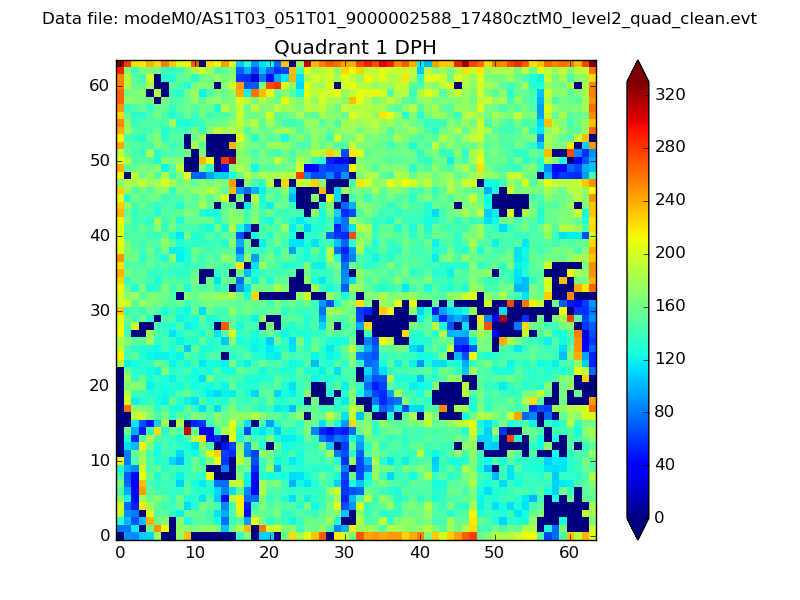 |
Quadrant B |
|---|---|---|---|
| Quadrant D | 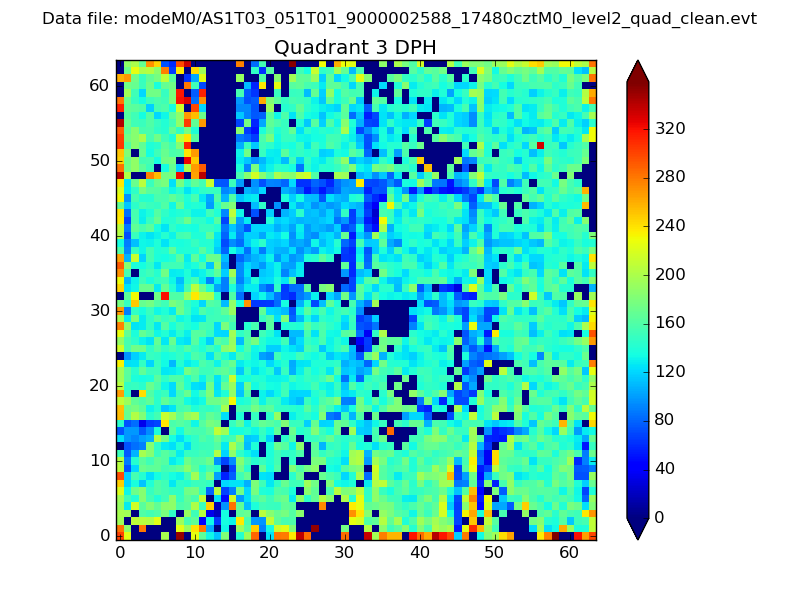 |
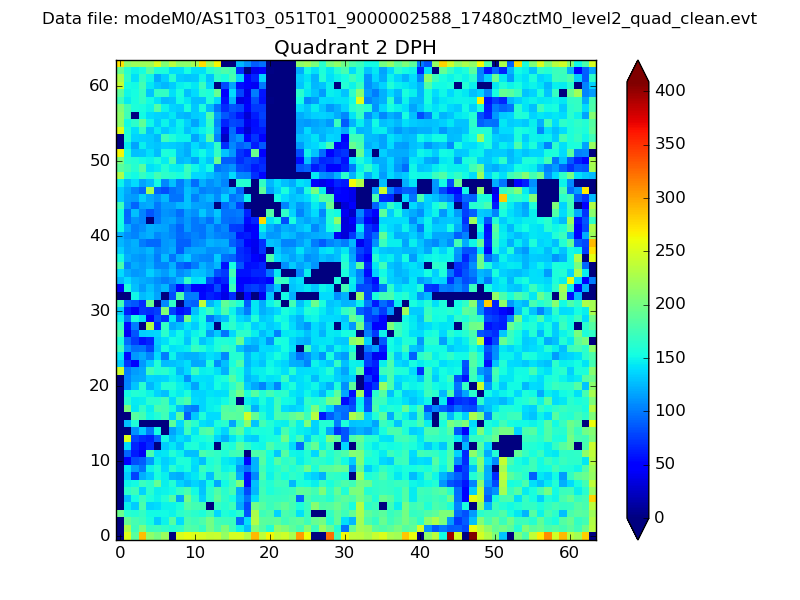 |
Quadrant C |
| Plot type | Count rate plots | Images |
|---|---|---|
| Comparison with Poisson distribution Blue bars denote a histogram of data divided into 1 sec bins. Red curve is a Poisson curve with rate = median count rate of data. |
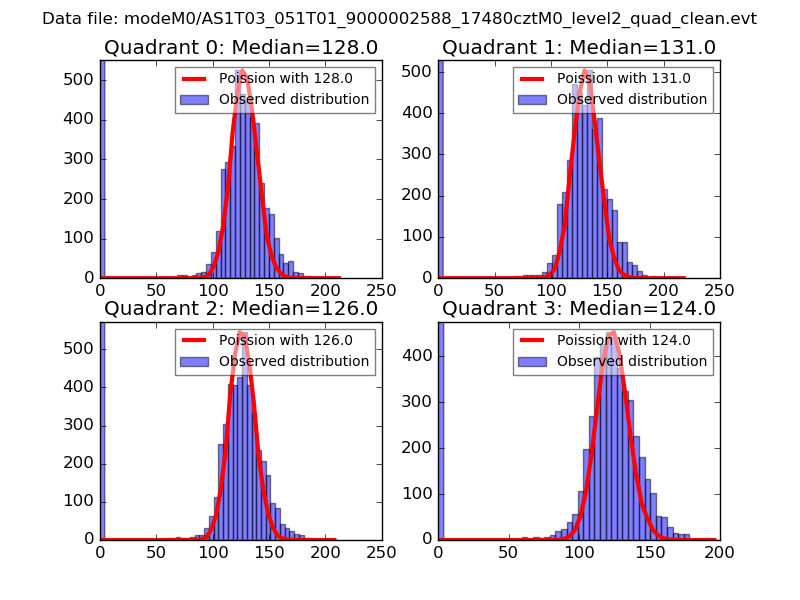 |
 |
| Quadrant-wise count rates Data is divided into 100 sec bins |
 |
|
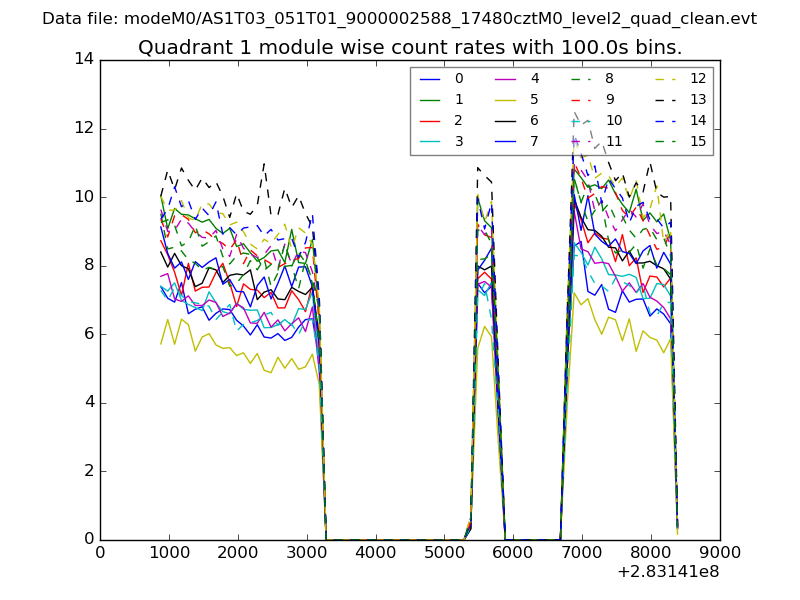
| Module-wise count rates for Quadrant A Data is divided into 100 sec bins |
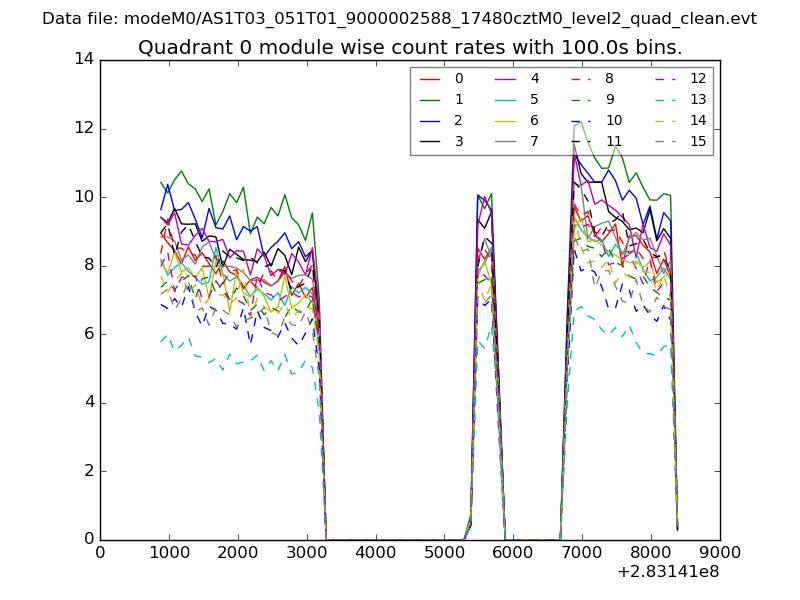 |
 |
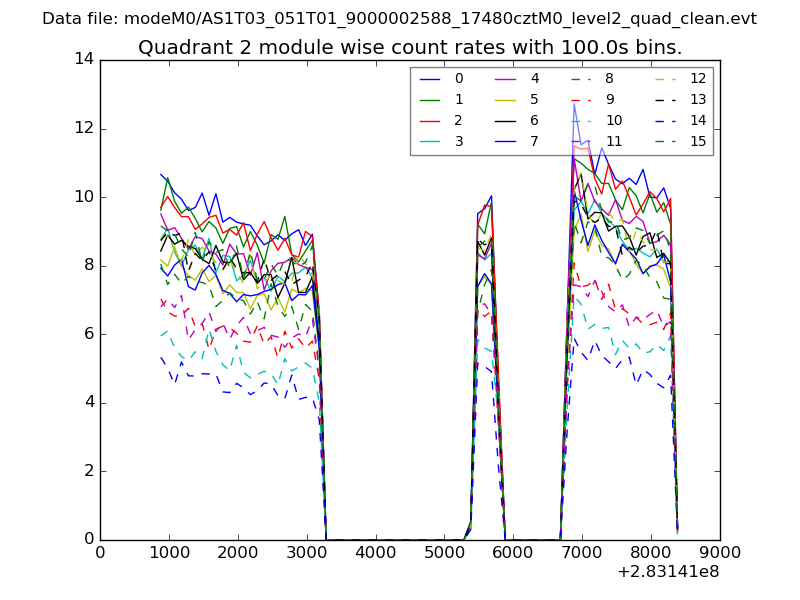
| Module-wise count rates for Quadrant B Data is divided into 100 sec bins |
 |
 |
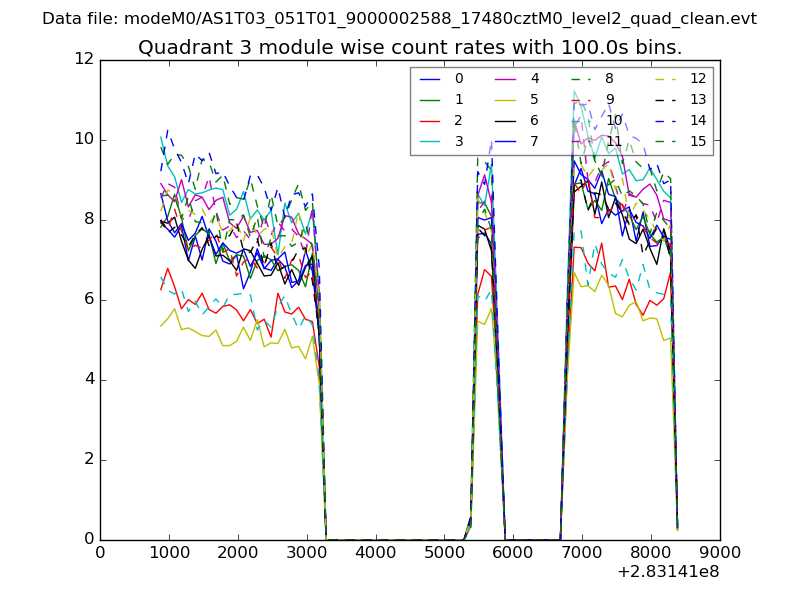
| Module-wise count rates for Quadrant C Data is divided into 100 sec bins |
 |
 |
| Module-wise count rates for Quadrant D Data is divided into 100 sec bins |
 |
 |
| Parameter | Plot |
|---|---|
| CZT HV Monitor |  |
| D_VDD | 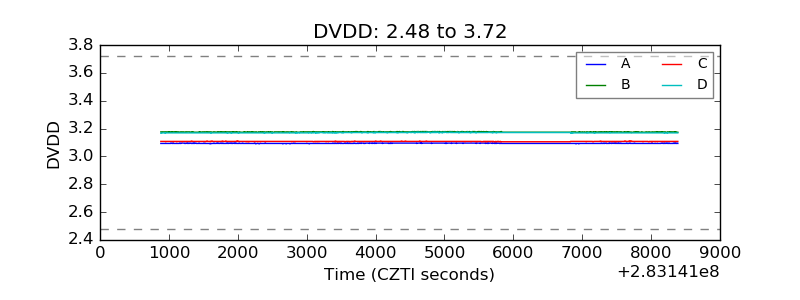 |
| Temperature 1 | 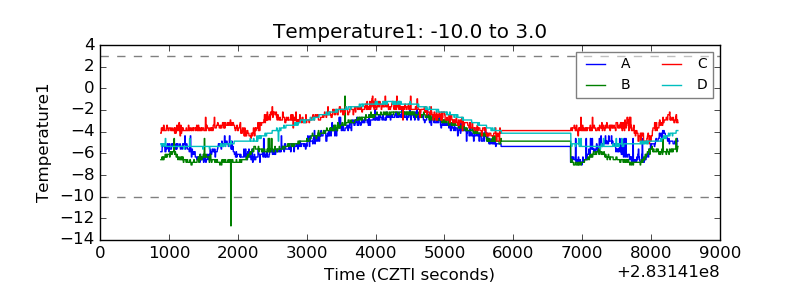 |
| Veto HV Monitor | 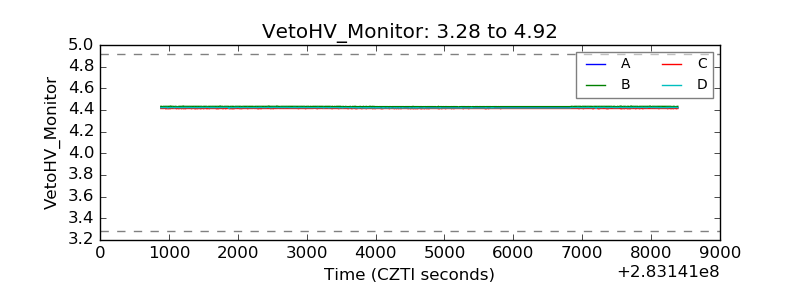 |
| Veto LLD | 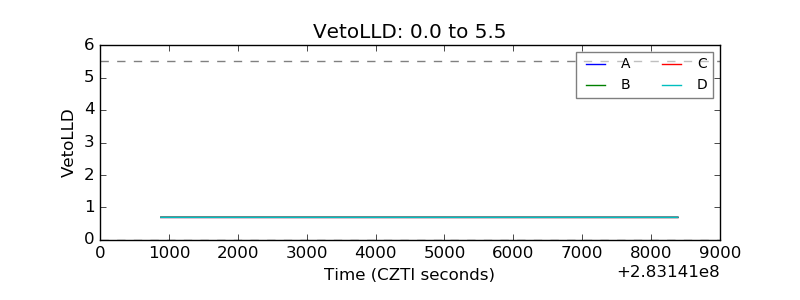 |
| Alpha Counter | 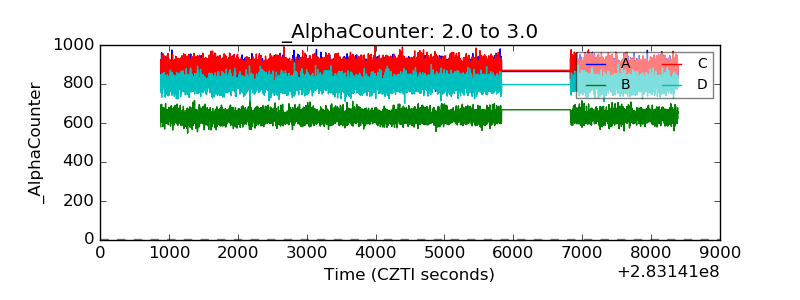 |
| _CPM_Rate | 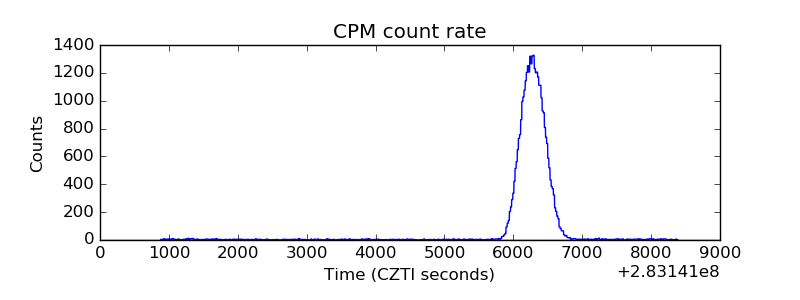 |
| CZT Counter | 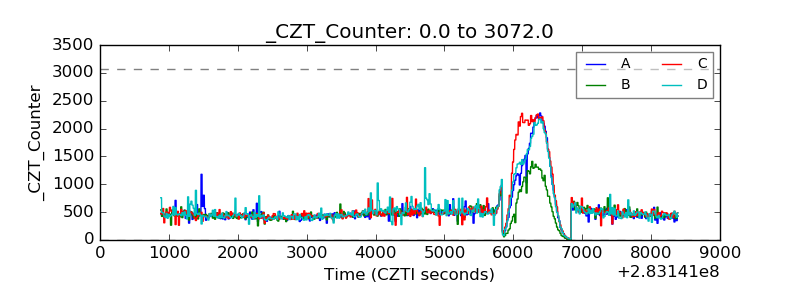 |
| +2.5 Volts monitor |  |
| +5 Volts monitor |  |
| _ROLL_ROT | 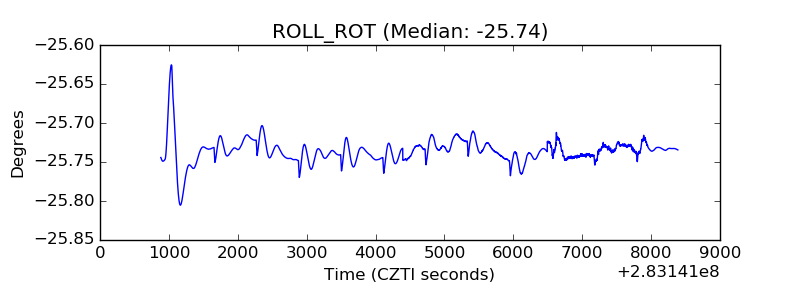 |
| _Roll_DEC | 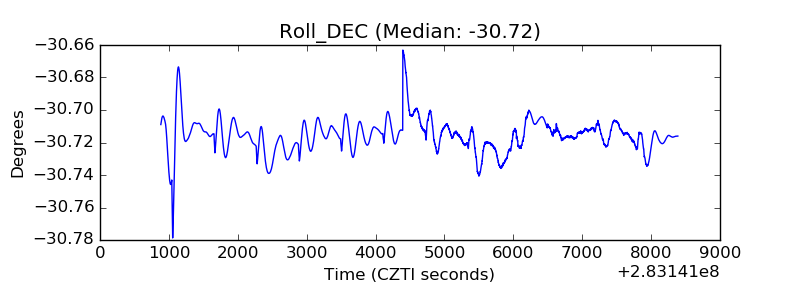 |
| _Roll_RA | 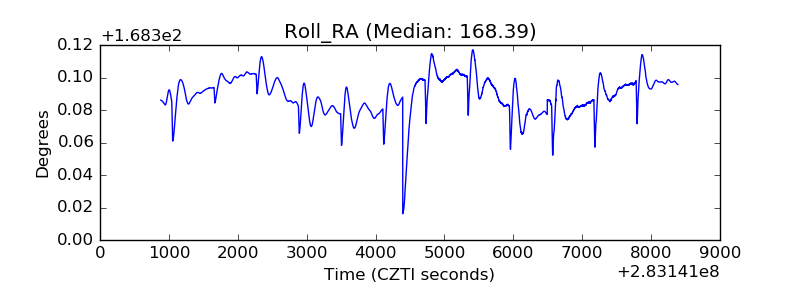 |
| Veto Counter | 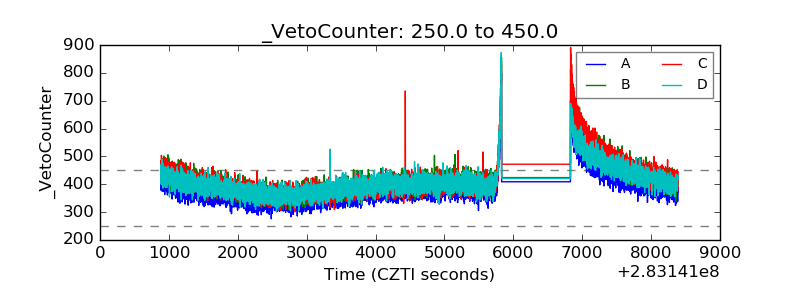 |