| Param | Original file | Final file |
|---|---|---|
| Filename | modeM0/AS1T03_051T01_9000002588_17482cztM0_level2.evt | modeM0/AS1T03_051T01_9000002588_17482cztM0_level2_quad_clean.evt |
| Size (bytes) | 553,109,760 | 95,662,080 |
| Size | 527.5 MB | 91.2 MB |
| Events in quadrant A | 3,234,388 | 621,537 |
| Events in quadrant B | 3,385,231 | 633,581 |
| Events in quadrant C | 3,314,891 | 612,451 |
| Events in quadrant D | 6,365,906 | 566,163 |
| Mode M9 | |||
|---|---|---|---|
| Quadrant | BADHDUFLAG | Total packets | Discarded packets |
| A | 0 | 12 | 0 |
| B | 0 | 13 | 0 |
| C | 0 | 13 | 0 |
| D | 0 | 13 | 0 |
| Mode M0 | |||
|---|---|---|---|
| Quadrant | BADHDUFLAG | Total packets | Discarded packets |
| A | 0 | 13680 | 2 |
| B | 0 | 14170 | 2 |
| C | 0 | 13821 | 2 |
| D | 0 | 23378 | 2 |
| Mode SS | |||
|---|---|---|---|
| Quadrant | BADHDUFLAG | Total packets | Discarded packets |
| A | 0 | 134 | 0 |
| B | 0 | 134 | 0 |
| C | 0 | 134 | 0 |
| D | 0 | 134 | 0 |
| Quadrant | Total seconds | Saturated seconds | Saturation percentage |
|---|---|---|---|
| A | 6646 | 32 | 0.481493% |
| B | 6646 | 53 | 0.797472% |
| C | 6646 | 77 | 1.158592% |
| D | 6646 | 1003 | 15.091785% |
Noise dominated data is calculated using 1-second bins in cleaned event files. If a bin has >2000 counts, and if more than 50% of those come from <1% of pixels, then it is considered to be noise-dominated and hence unusable.
| Quadrant | # 1 sec bins | Bins with >0 counts | Bins with >2000 counts | High rate bins dominated by noise | Noise dominated (total time) | Noise dominated (detector-on time) | Marked lightcurve |
|---|---|---|---|---|---|---|---|
| A | 7781 | 6647 | 0 | 0 | 0.00% | 0.00% | 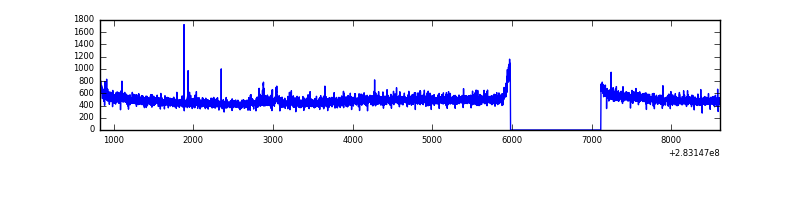 |
| B | 7781 | 6647 | 11 | 11 | 0.14% | 0.17% | 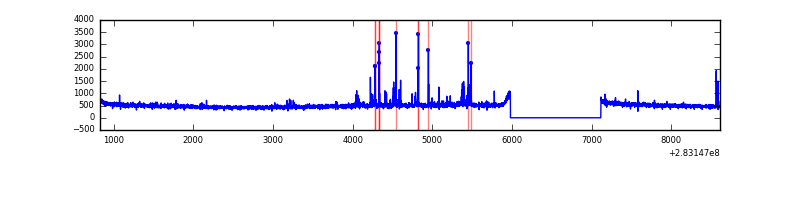 |
| C | 7781 | 6647 | 0 | 0 | 0.00% | 0.00% |  |
| D | 7781 | 6646 | 817 | 817 | 10.50% | 12.29% | 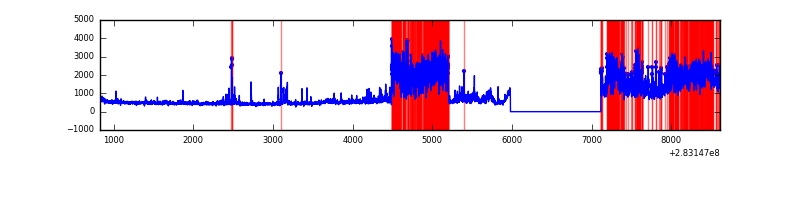 |
Top three noisy pixels from each quadrant. If the there are fewer than three noisy pixels in the level2.evt file, extra rows are filled as -1
| Pixel properties | Quadrant properties | ||||||
|---|---|---|---|---|---|---|---|
| Quadrant | DetID | PixID | Counts | Sigma | Mean | Median | Sigma |
| A | 14 | 237 | 23453 | 136.16 | 831 | 814 | 166.3 |
| A | 15 | 174 | 16170 | 92.36 | 831 | 814 | 166.3 |
| A | 0 | 226 | 7393 | 39.57 | 831 | 814 | 166.3 |
| B | 12 | 17 | 39866 | 249.93 | 829 | 807 | 156.3 |
| B | 0 | 197 | 38637 | 242.06 | 829 | 807 | 156.3 |
| B | 5 | 172 | 32777 | 204.57 | 829 | 807 | 156.3 |
| C | 14 | 238 | 125119 | 652.86 | 811 | 818 | 190.4 |
| C | 5 | 218 | 20812 | 105.01 | 811 | 818 | 190.4 |
| C | 3 | 233 | 8462 | 40.15 | 811 | 818 | 190.4 |
| D | 7 | 238 | 3030475 | 15850.16 | 785 | 763 | 191.1 |
| D | 5 | 222 | 213265 | 1111.72 | 785 | 763 | 191.1 |
| D | 13 | 232 | 56075 | 289.37 | 785 | 763 | 191.1 |
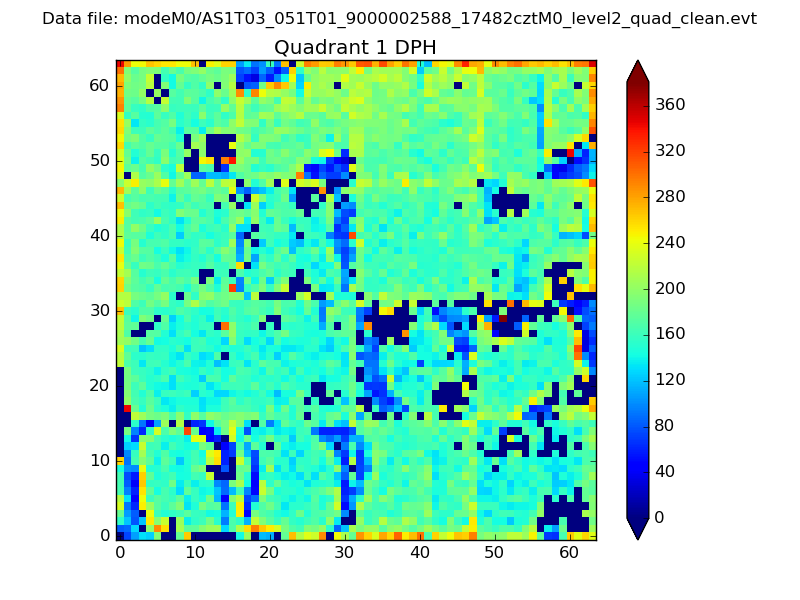
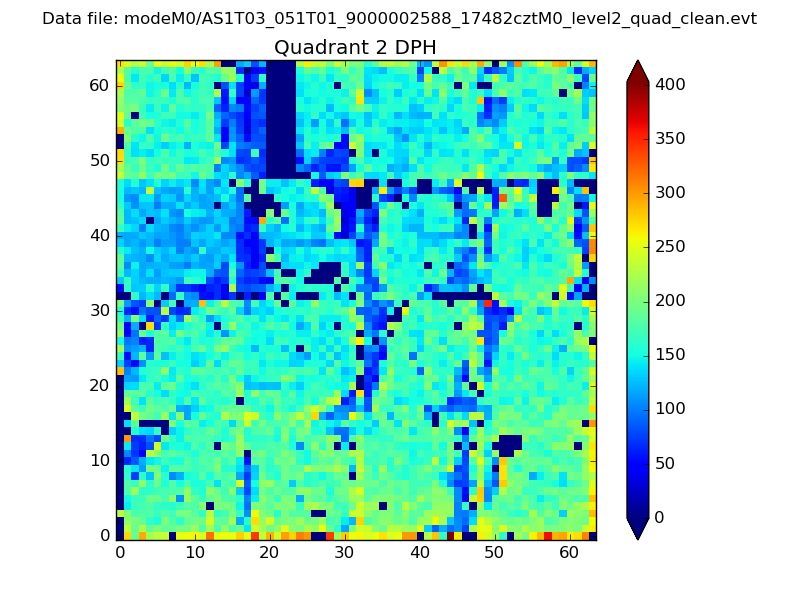
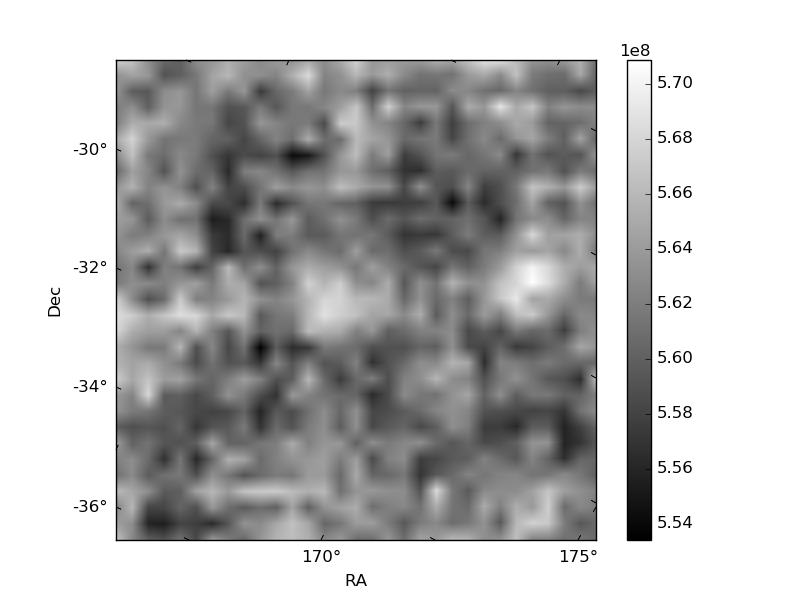
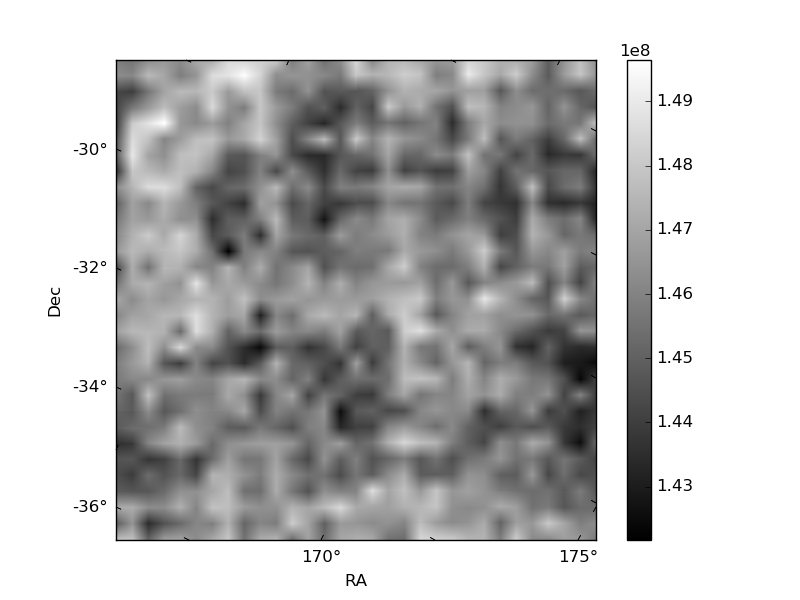
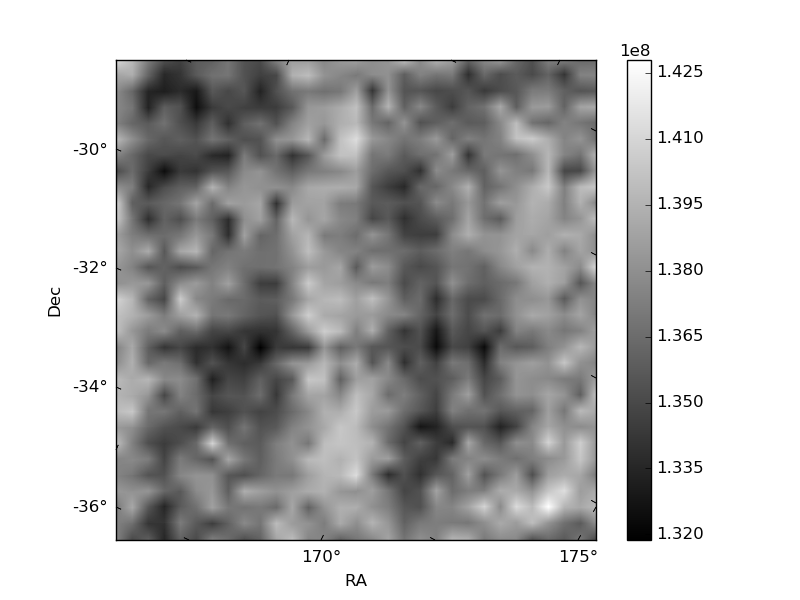
Histogram calculated using DETX and DETY for each event in the final _common_clean file
| Quadrant A | 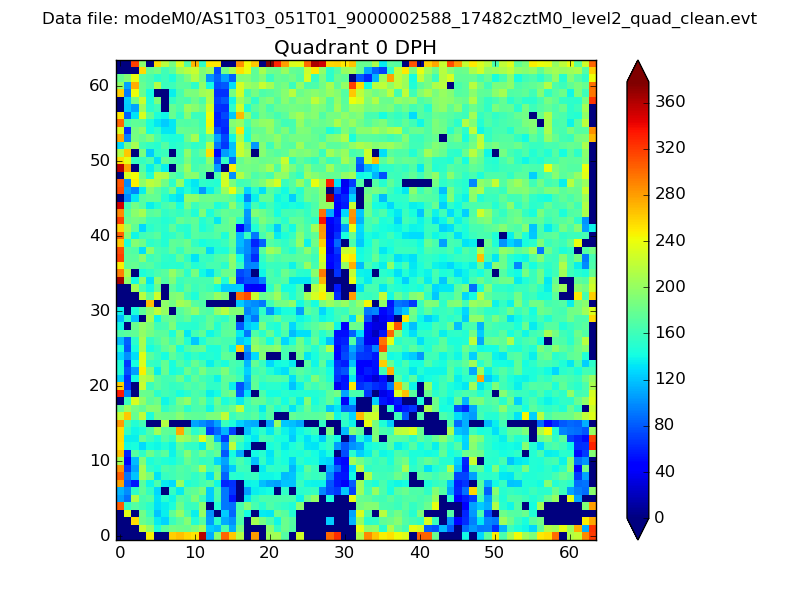 |
 |
Quadrant B |
|---|---|---|---|
| Quadrant D | 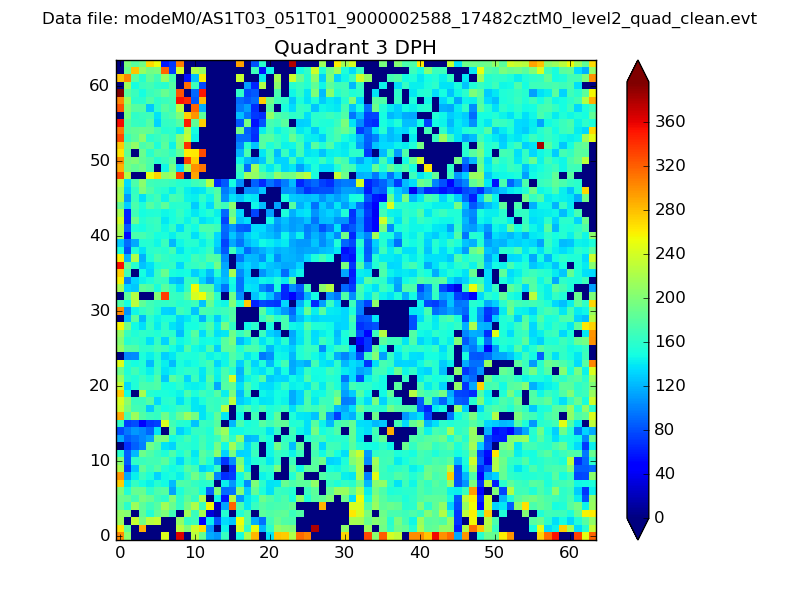 |
 |
Quadrant C |
| Plot type | Count rate plots | Images |
|---|---|---|
| Comparison with Poisson distribution Blue bars denote a histogram of data divided into 1 sec bins. Red curve is a Poisson curve with rate = median count rate of data. |
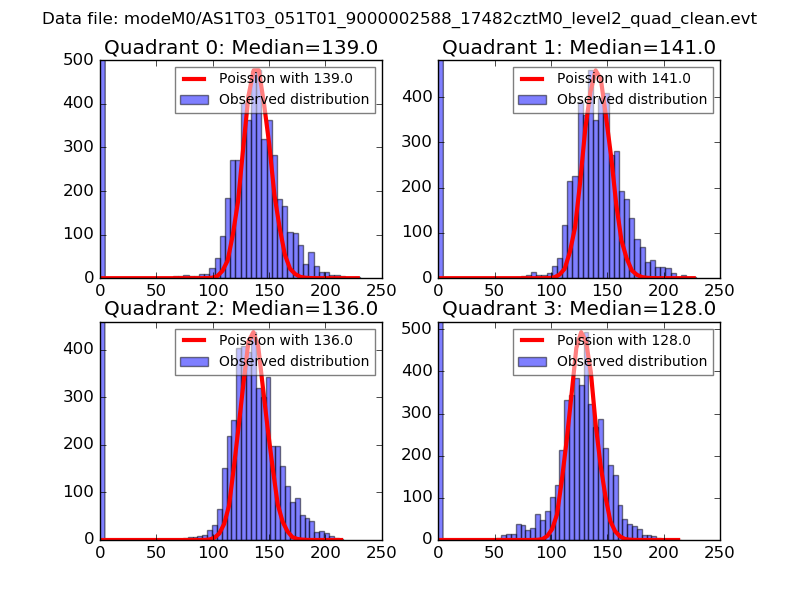 |
 |
| Quadrant-wise count rates Data is divided into 100 sec bins |
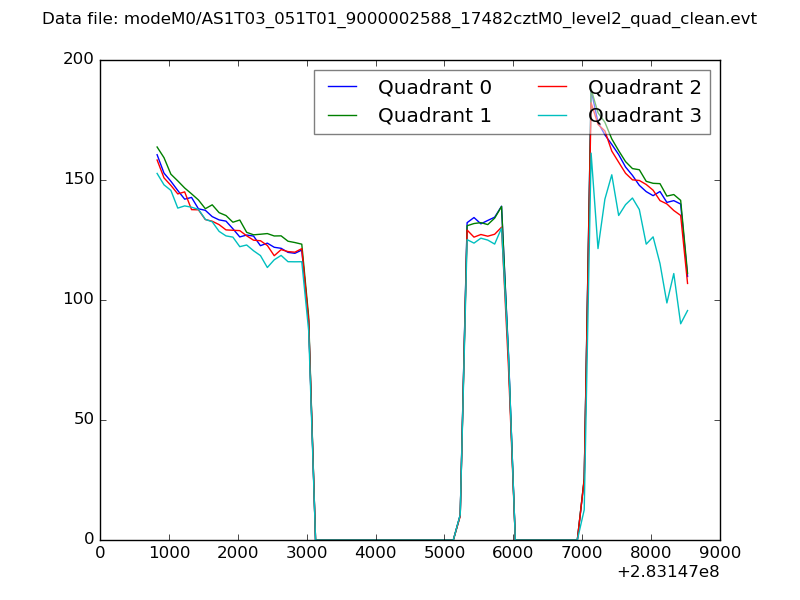 |
|
| Module-wise count rates for Quadrant A Data is divided into 100 sec bins |
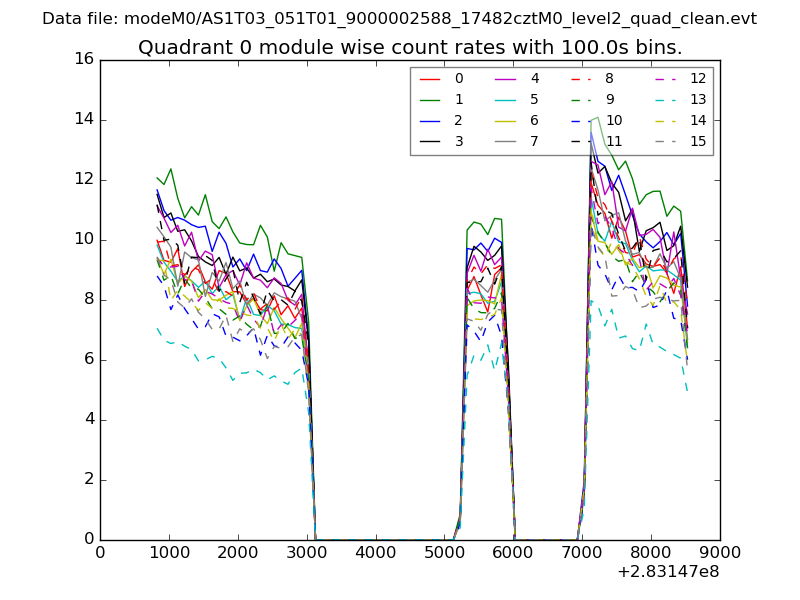 |
 |
| Module-wise count rates for Quadrant B Data is divided into 100 sec bins |
 |
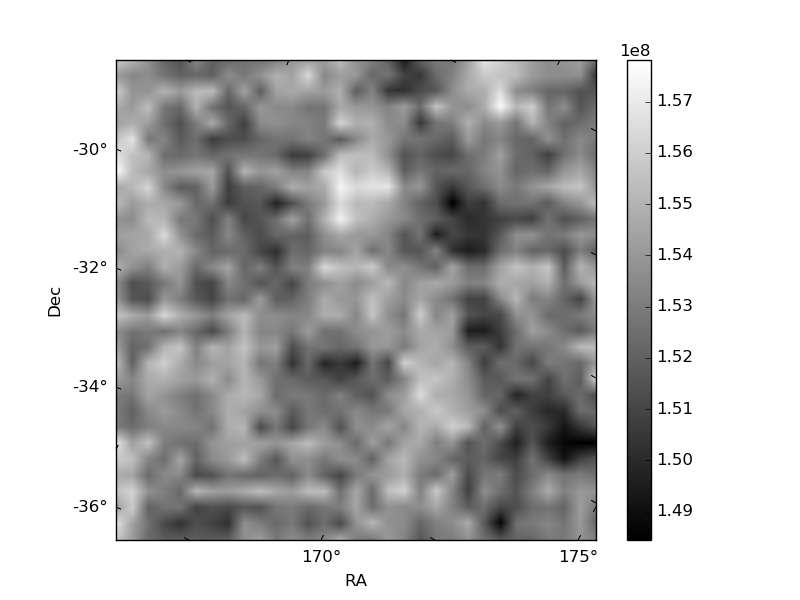 |
| Module-wise count rates for Quadrant C Data is divided into 100 sec bins |
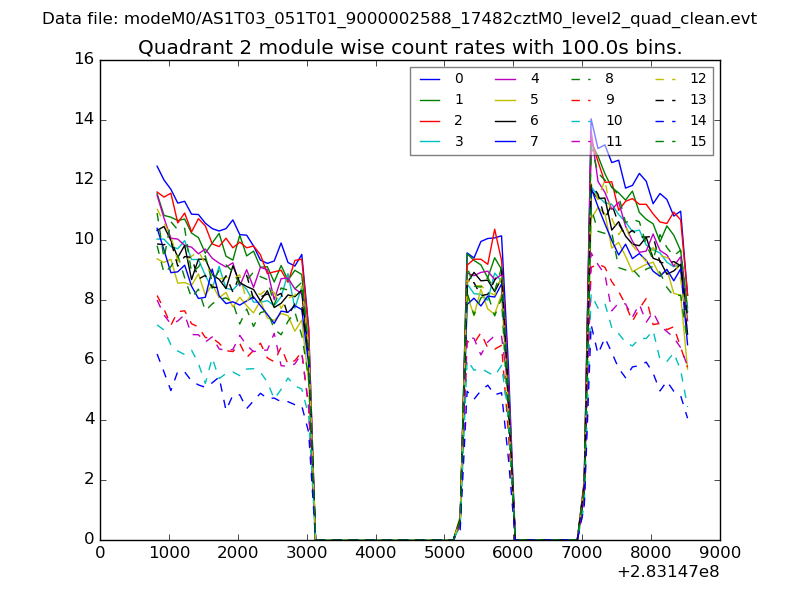 |
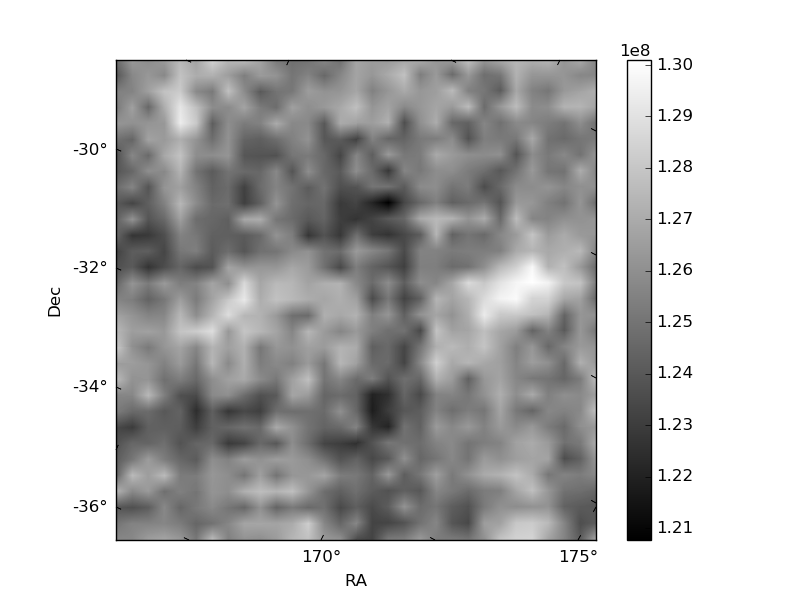 |
| Module-wise count rates for Quadrant D Data is divided into 100 sec bins |
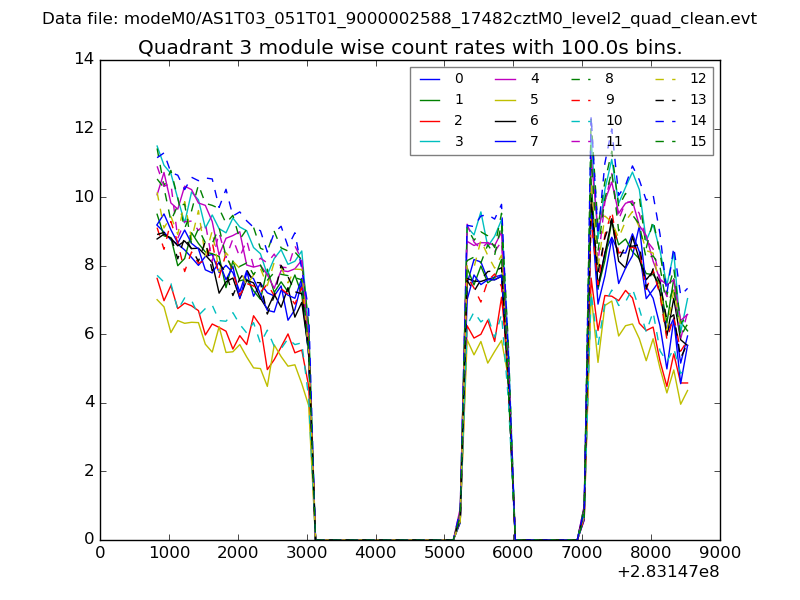 |
 |
| Parameter | Plot |
|---|---|
| CZT HV Monitor | 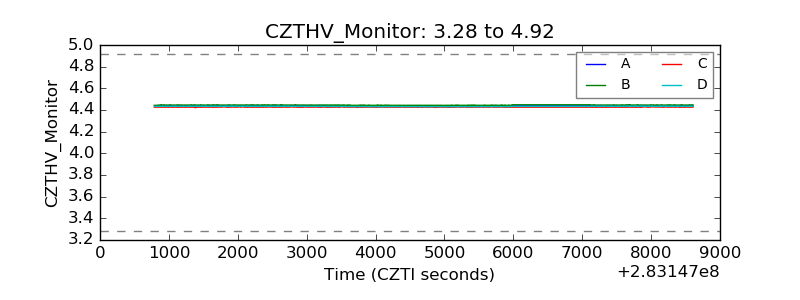 |
| D_VDD | 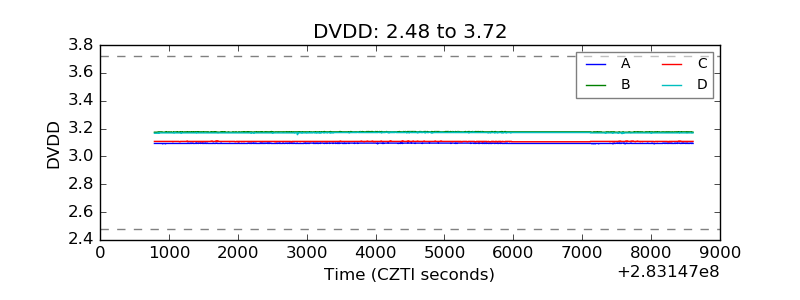 |
| Temperature 1 | 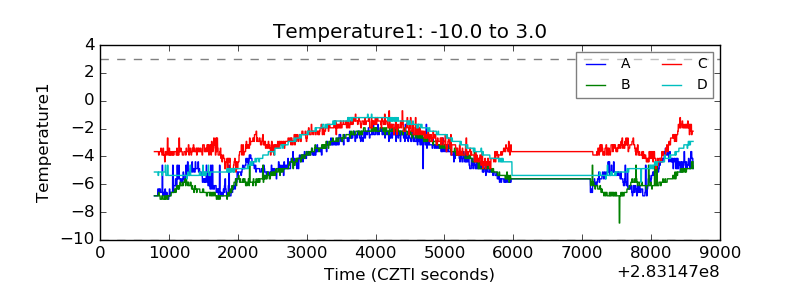 |
| Veto HV Monitor | 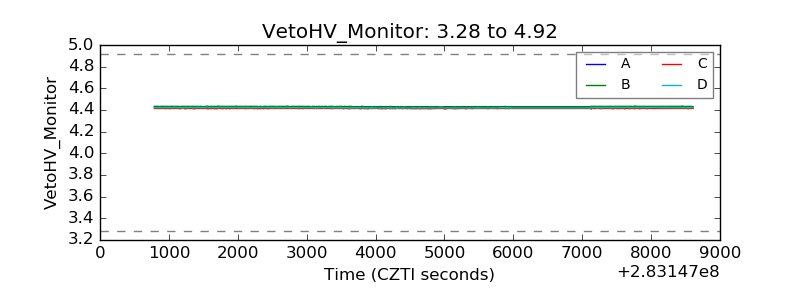 |
| Veto LLD | 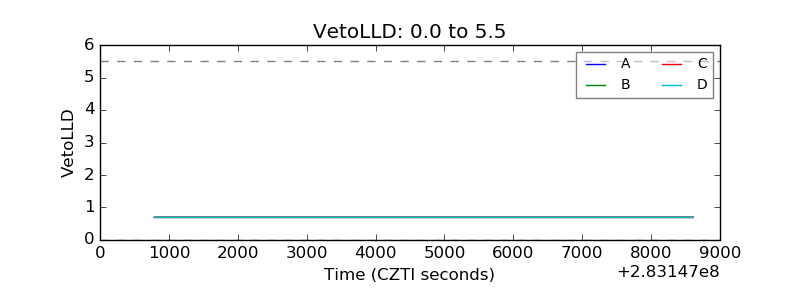 |
| Alpha Counter | 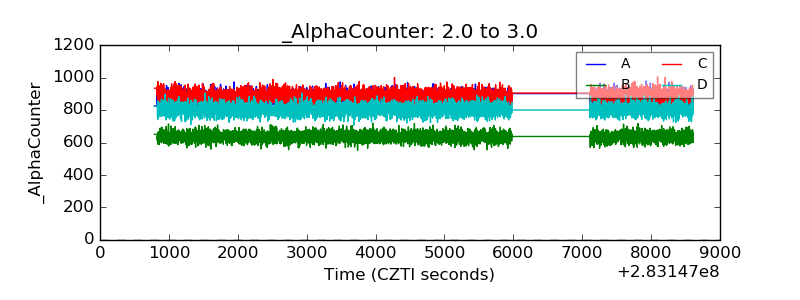 |
| _CPM_Rate |  |
| CZT Counter | 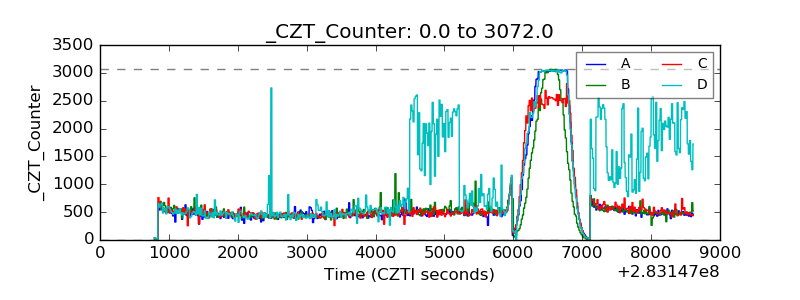 |
| +2.5 Volts monitor |  |
| +5 Volts monitor |  |
| _ROLL_ROT | 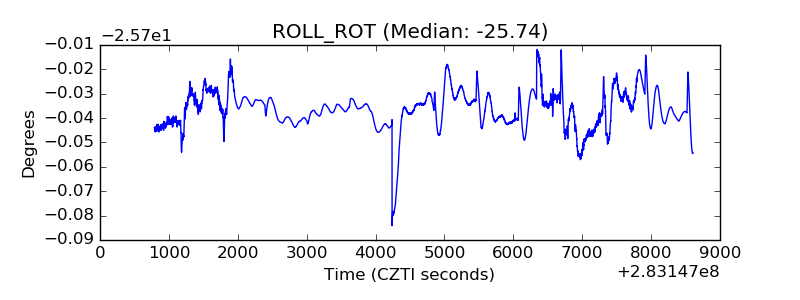 |
| _Roll_DEC | 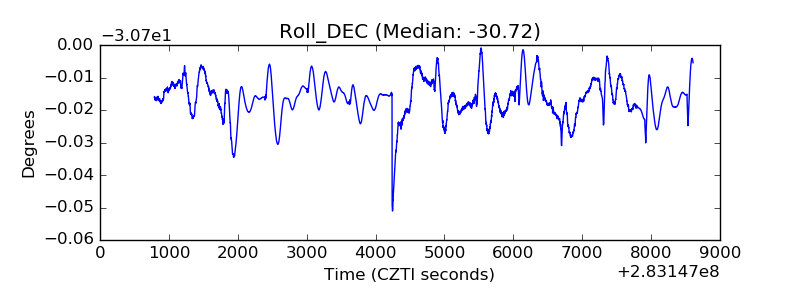 |
| _Roll_RA | 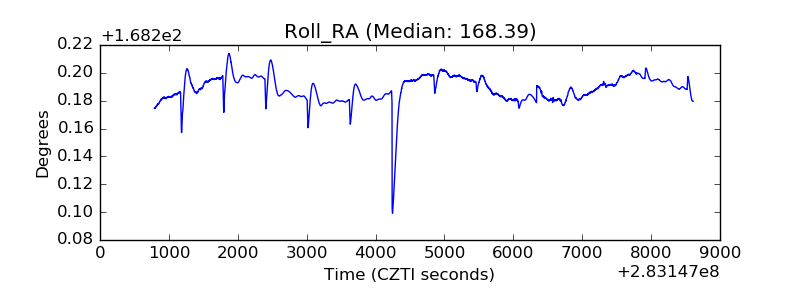 |
| Veto Counter | 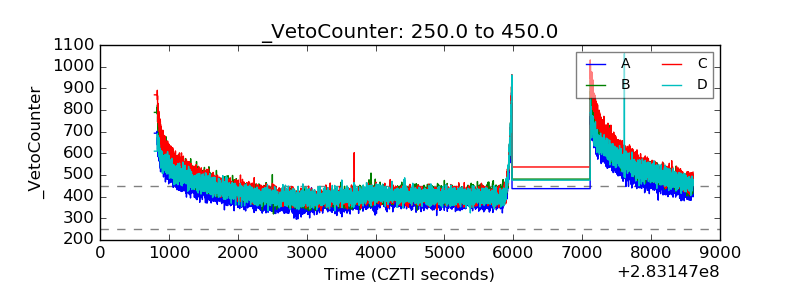 |