| Param | Original file | Final file |
|---|---|---|
| Filename | modeM0/AS1T03_051T01_9000002588_17484cztM0_level2.evt | modeM0/AS1T03_051T01_9000002588_17484cztM0_level2_quad_clean.evt |
| Size (bytes) | 461,543,040 | 84,288,960 |
| Size | 440.2 MB | 80.4 MB |
| Events in quadrant A | 3,033,900 | 548,784 |
| Events in quadrant B | 3,253,300 | 556,801 |
| Events in quadrant C | 3,111,131 | 535,072 |
| Events in quadrant D | 4,190,610 | 511,008 |
| Mode M9 | |||
|---|---|---|---|
| Quadrant | BADHDUFLAG | Total packets | Discarded packets |
| A | 0 | 13 | 0 |
| B | 0 | 13 | 0 |
| C | 0 | 13 | 0 |
| D | 0 | 13 | 0 |
| Mode M0 | |||
|---|---|---|---|
| Quadrant | BADHDUFLAG | Total packets | Discarded packets |
| A | 0 | 12295 | 1 |
| B | 0 | 13013 | 1 |
| C | 0 | 12536 | 1 |
| D | 0 | 16194 | 1 |
| Mode SS | |||
|---|---|---|---|
| Quadrant | BADHDUFLAG | Total packets | Discarded packets |
| A | 0 | 116 | 0 |
| B | 0 | 116 | 0 |
| C | 0 | 116 | 0 |
| D | 0 | 116 | 0 |
| Quadrant | Total seconds | Saturated seconds | Saturation percentage |
|---|---|---|---|
| A | 5732 | 64 | 1.116539% |
| B | 5733 | 95 | 1.657073% |
| C | 5732 | 92 | 1.605024% |
| D | 5732 | 293 | 5.111654% |
Noise dominated data is calculated using 1-second bins in cleaned event files. If a bin has >2000 counts, and if more than 50% of those come from <1% of pixels, then it is considered to be noise-dominated and hence unusable.
| Quadrant | # 1 sec bins | Bins with >0 counts | Bins with >2000 counts | High rate bins dominated by noise | Noise dominated (total time) | Noise dominated (detector-on time) | Marked lightcurve |
|---|---|---|---|---|---|---|---|
| A | 7027 | 5733 | 1 | 1 | 0.01% | 0.02% | 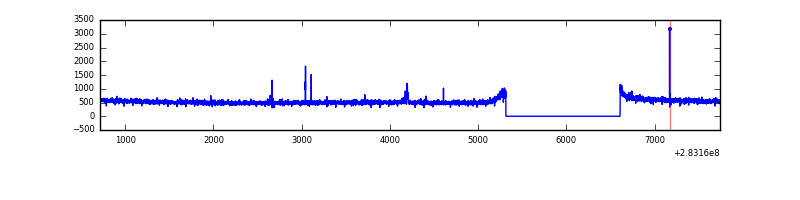 |
| B | 7028 | 5734 | 18 | 18 | 0.26% | 0.31% | 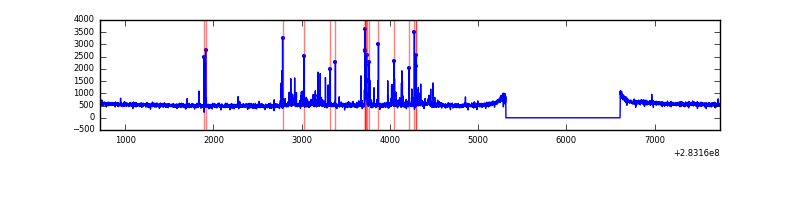 |
| C | 7027 | 5732 | 0 | 0 | 0.00% | 0.00% | 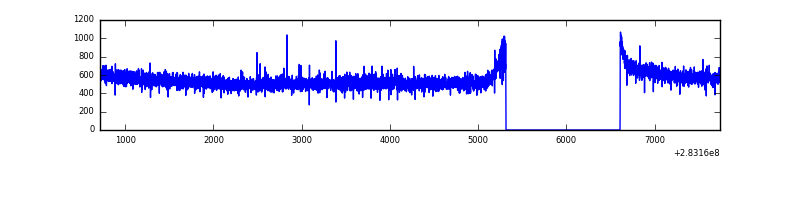 |
| D | 7027 | 5733 | 190 | 190 | 2.70% | 3.31% | 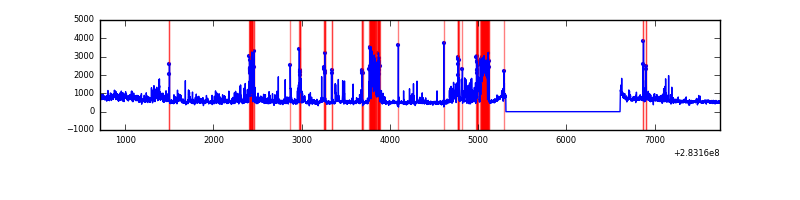 |
Top three noisy pixels from each quadrant. If the there are fewer than three noisy pixels in the level2.evt file, extra rows are filled as -1
| Pixel properties | Quadrant properties | ||||||
|---|---|---|---|---|---|---|---|
| Quadrant | DetID | PixID | Counts | Sigma | Mean | Median | Sigma |
| A | 15 | 174 | 17209 | 105.22 | 783 | 767 | 156.3 |
| A | 0 | 226 | 7049 | 40.2 | 783 | 767 | 156.3 |
| A | 12 | 194 | 5819 | 32.33 | 783 | 767 | 156.3 |
| B | 7 | 220 | 84542 | 580.21 | 771 | 754 | 144.4 |
| B | 0 | 197 | 45466 | 309.62 | 771 | 754 | 144.4 |
| B | 4 | 216 | 28302 | 190.76 | 771 | 754 | 144.4 |
| C | 14 | 238 | 116530 | 661.11 | 754 | 761 | 175.1 |
| C | 5 | 218 | 25697 | 142.4 | 754 | 761 | 175.1 |
| C | 3 | 233 | 19312 | 105.94 | 754 | 761 | 175.1 |
| D | 13 | 189 | 436627 | 2423.38 | 753 | 732 | 179.9 |
| D | 7 | 238 | 412890 | 2291.42 | 753 | 732 | 179.9 |
| D | 10 | 70 | 200515 | 1110.71 | 753 | 732 | 179.9 |
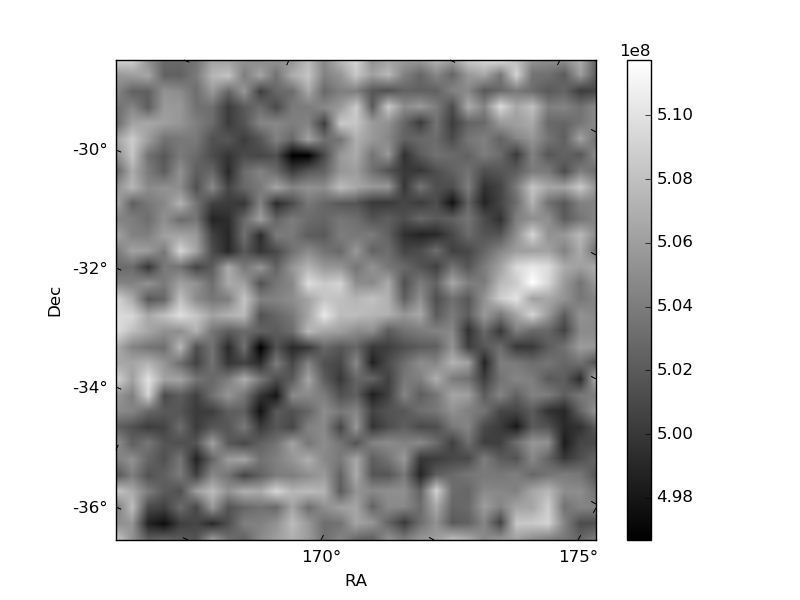
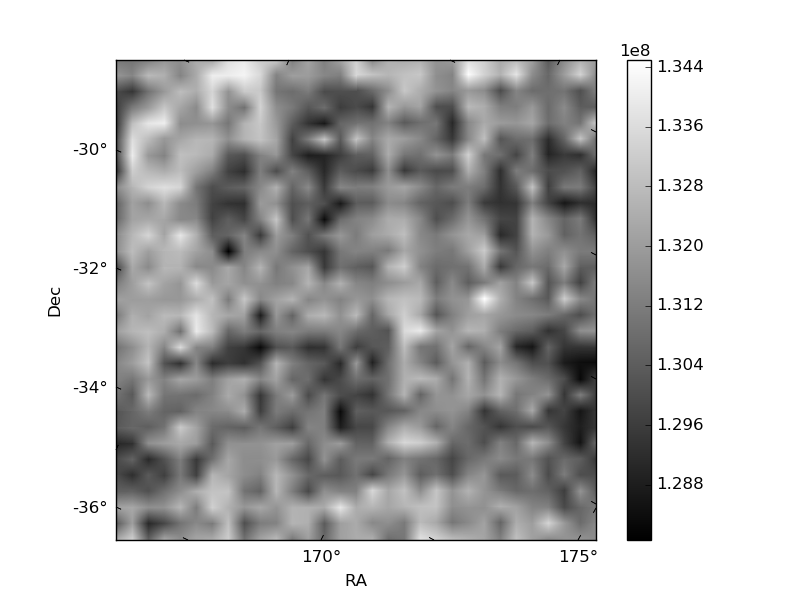
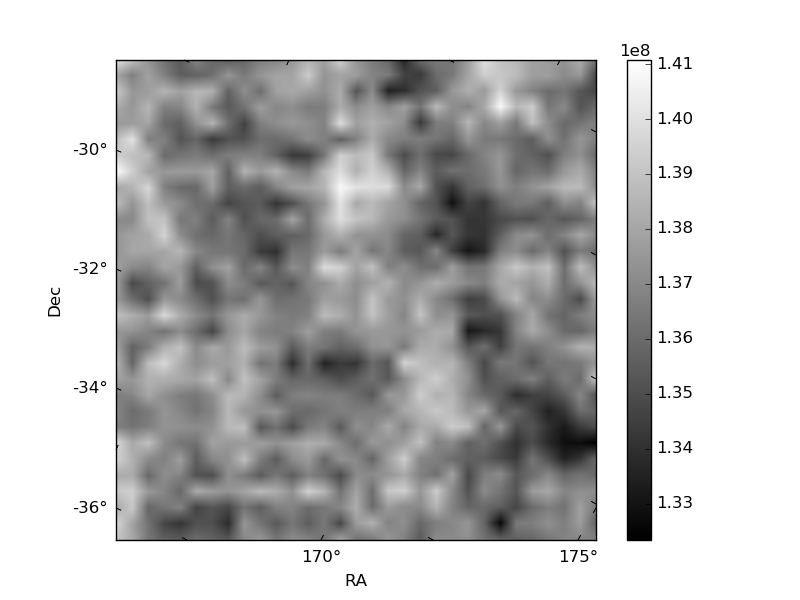
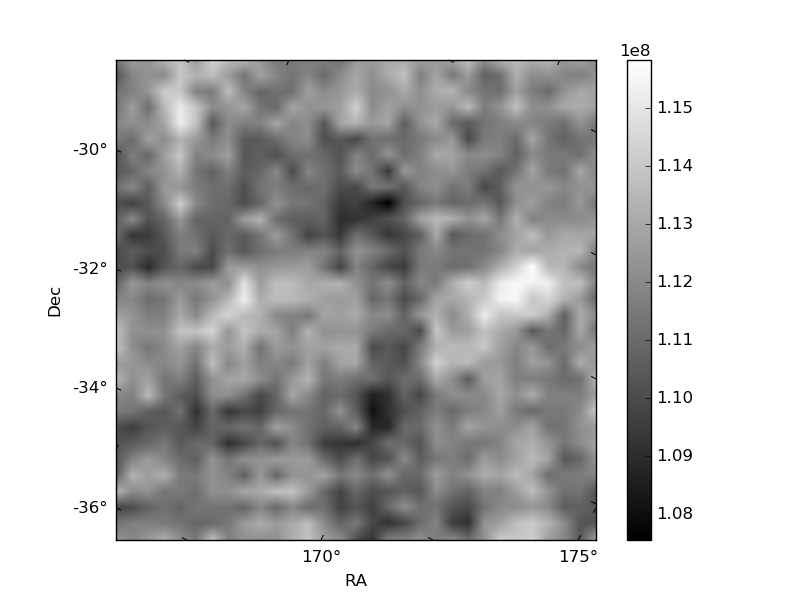
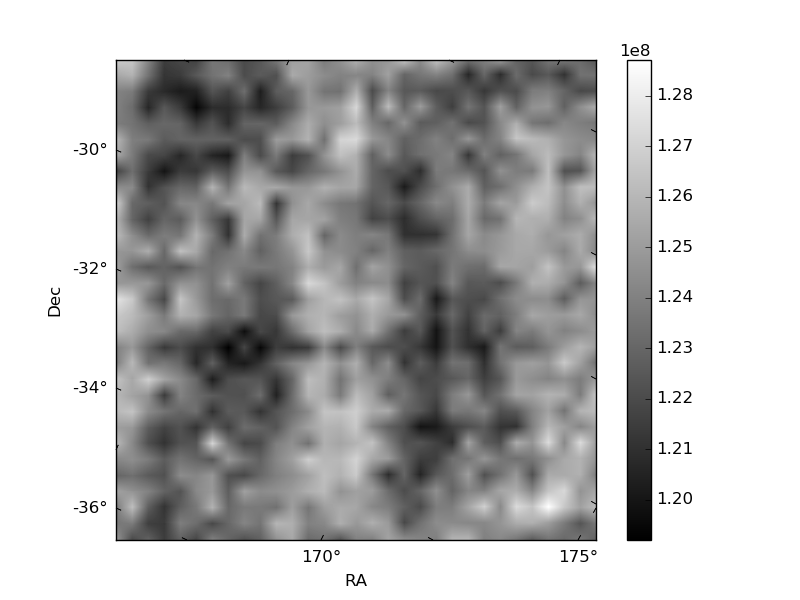
Histogram calculated using DETX and DETY for each event in the final _common_clean file
| Quadrant A | 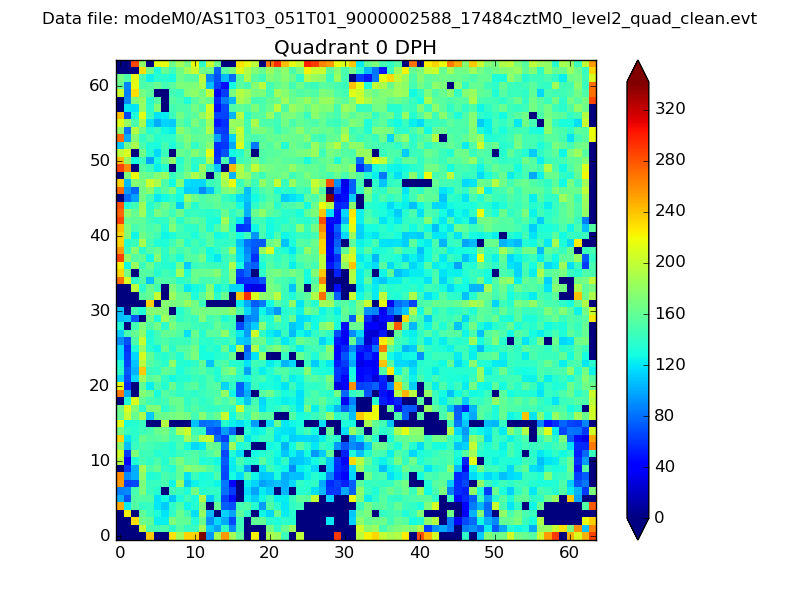 |
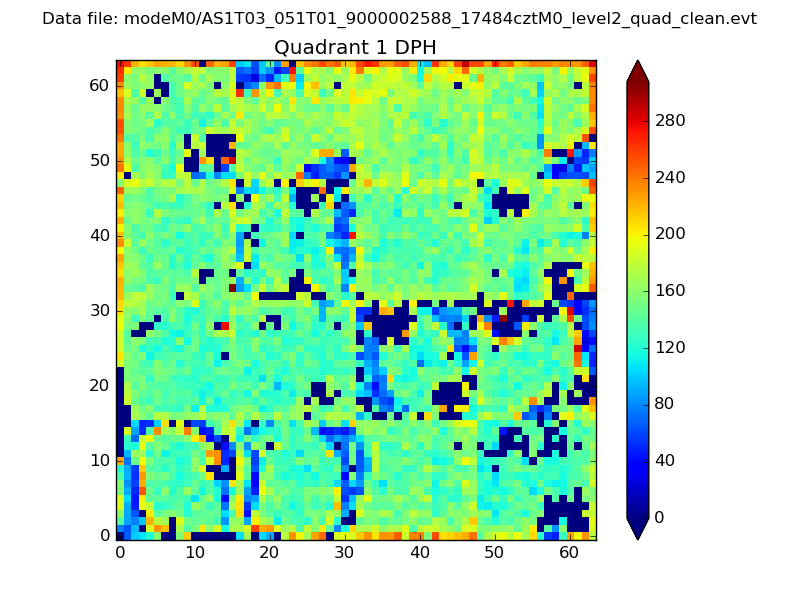 |
Quadrant B |
|---|---|---|---|
| Quadrant D | 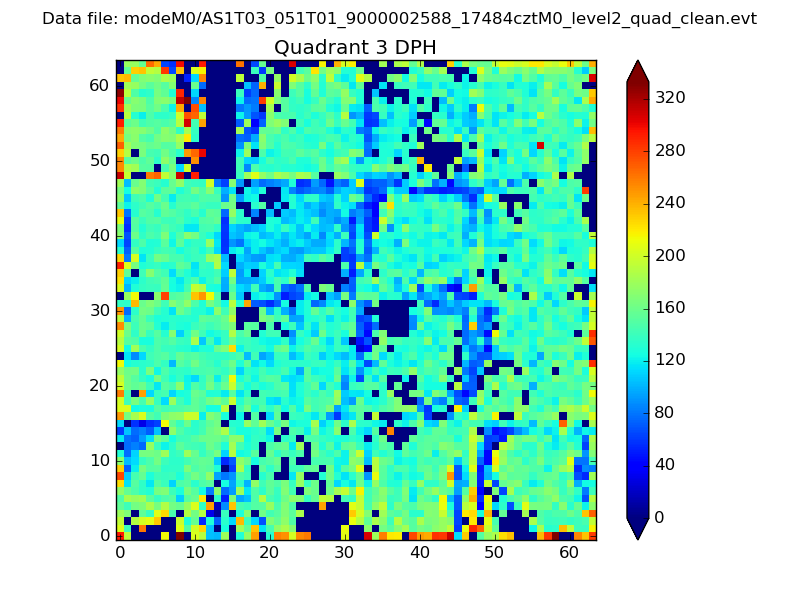 |
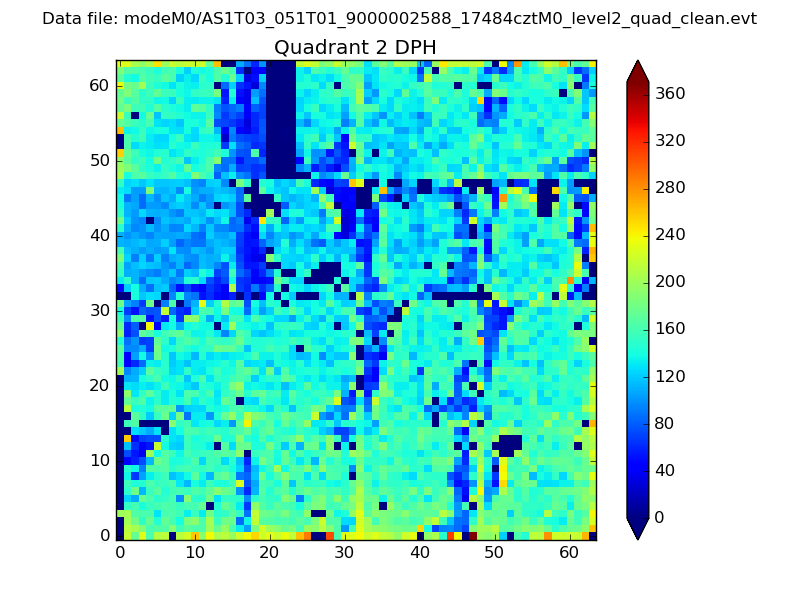 |
Quadrant C |
| Plot type | Count rate plots | Images |
|---|---|---|
| Comparison with Poisson distribution Blue bars denote a histogram of data divided into 1 sec bins. Red curve is a Poisson curve with rate = median count rate of data. |
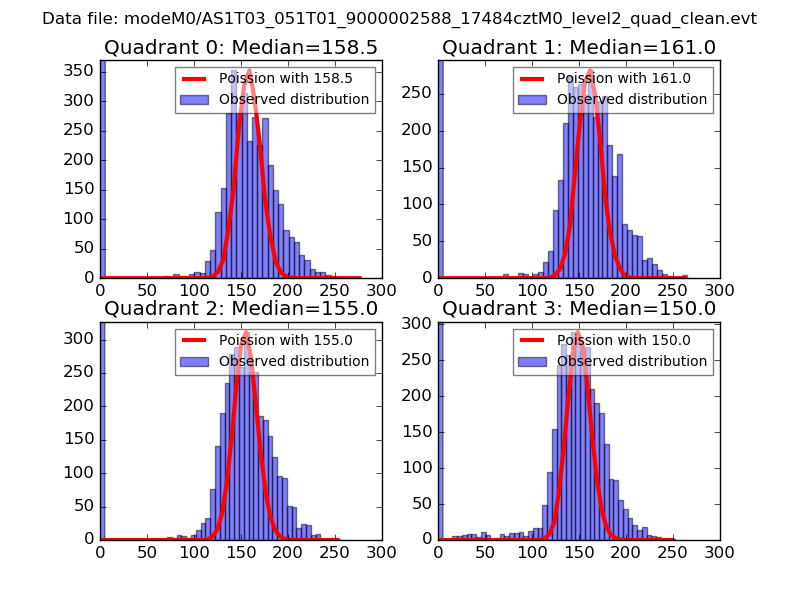 |
 |
| Quadrant-wise count rates Data is divided into 100 sec bins |
 |
|
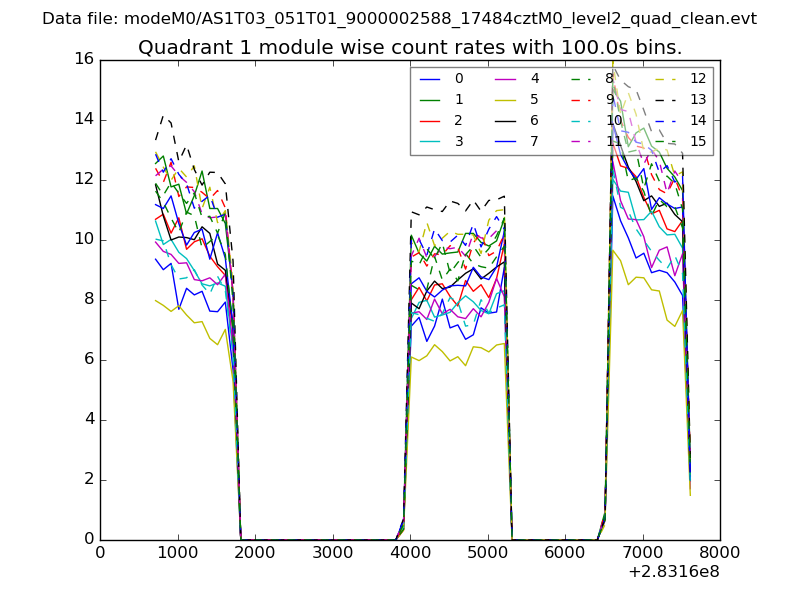
| Module-wise count rates for Quadrant A Data is divided into 100 sec bins |
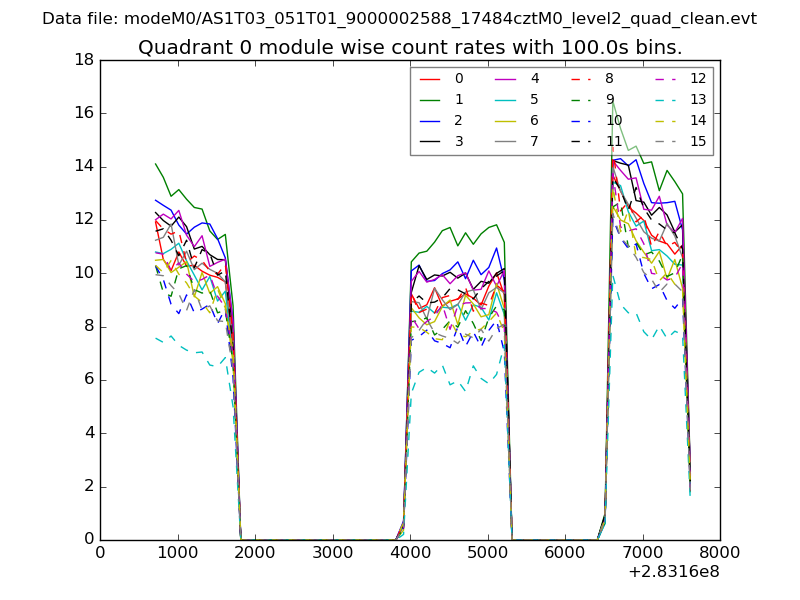 |
 |
| Module-wise count rates for Quadrant B Data is divided into 100 sec bins |
 |
 |
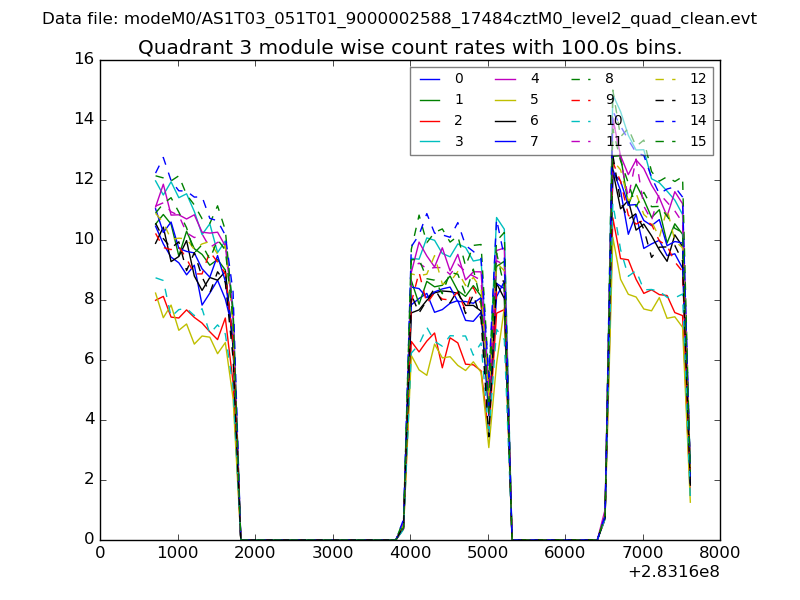
| Module-wise count rates for Quadrant C Data is divided into 100 sec bins |
 |
 |
| Module-wise count rates for Quadrant D Data is divided into 100 sec bins |
 |
 |
| Parameter | Plot |
|---|---|
| CZT HV Monitor | 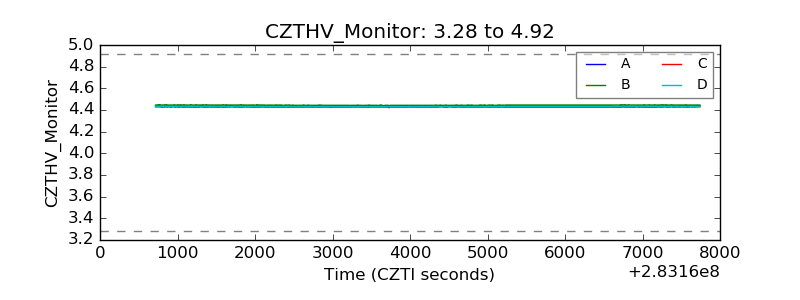 |
| D_VDD | 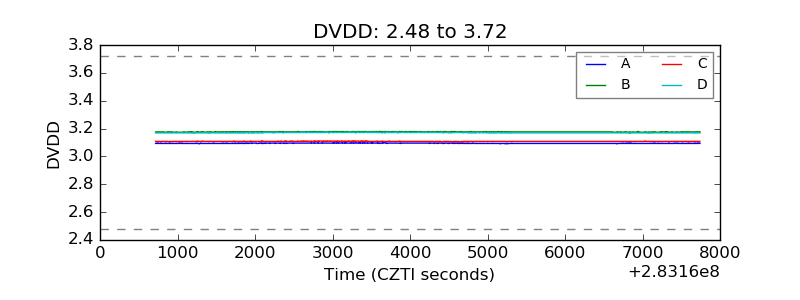 |
| Temperature 1 | 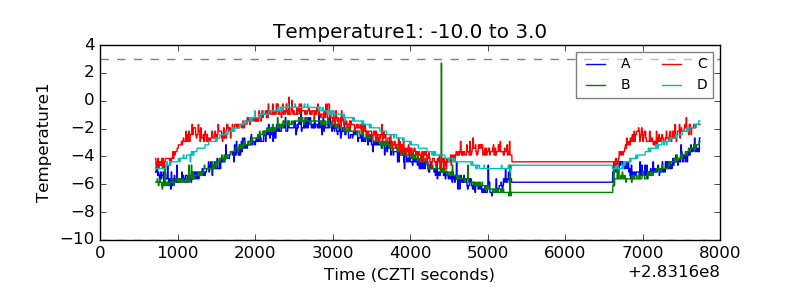 |
| Veto HV Monitor | 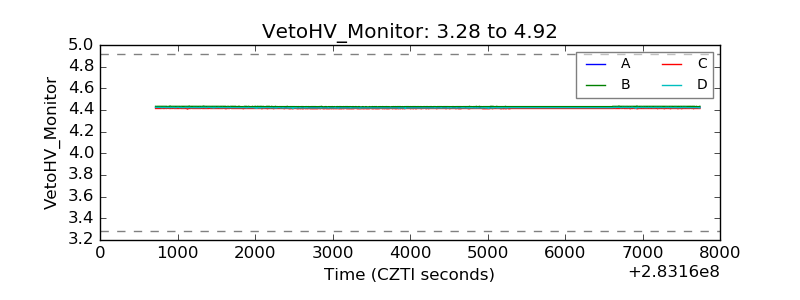 |
| Veto LLD | 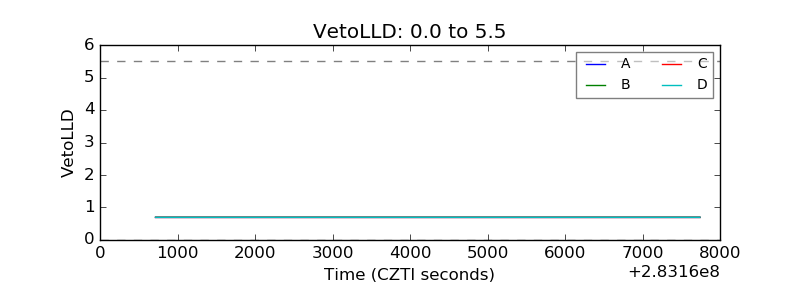 |
| Alpha Counter |  |
| _CPM_Rate |  |
| CZT Counter | 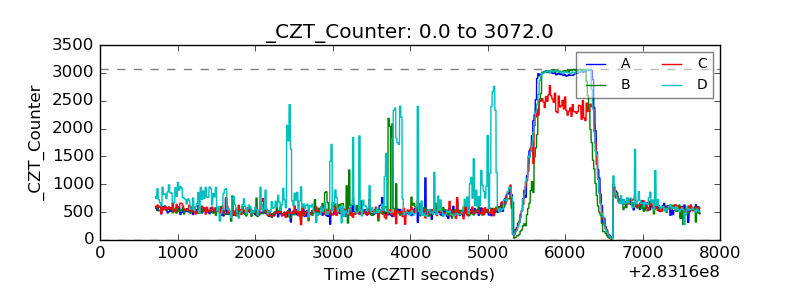 |
| +2.5 Volts monitor |  |
| +5 Volts monitor |  |
| _ROLL_ROT | 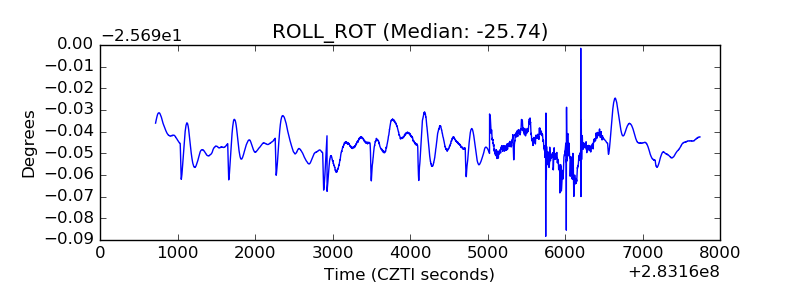 |
| _Roll_DEC | 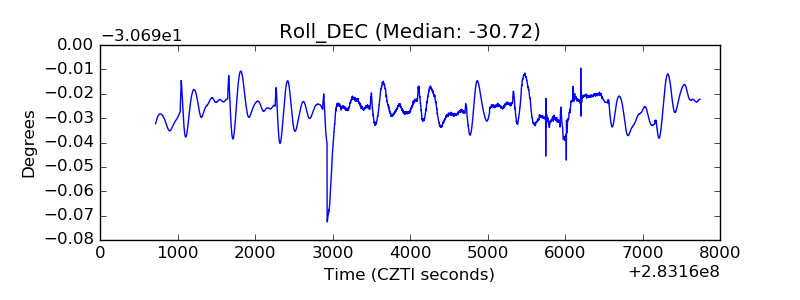 |
| _Roll_RA | 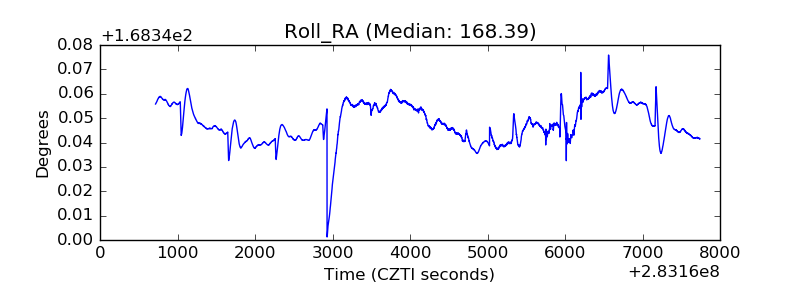 |
| Veto Counter | 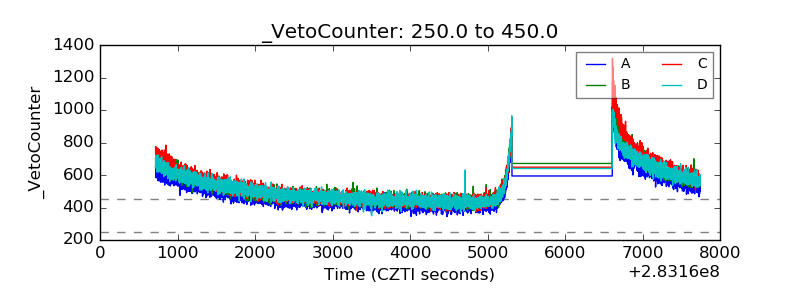 |