| Param | Original file | Final file |
|---|---|---|
| Filename | modeM0/AS1T03_051T01_9000002588_17485cztM0_level2.evt | modeM0/AS1T03_051T01_9000002588_17485cztM0_level2_quad_clean.evt |
| Size (bytes) | 576,400,320 | 84,499,200 |
| Size | 549.7 MB | 80.6 MB |
| Events in quadrant A | 3,407,081 | 550,510 |
| Events in quadrant B | 3,532,026 | 556,797 |
| Events in quadrant C | 3,404,711 | 531,703 |
| Events in quadrant D | 6,696,911 | 491,461 |
| Mode M9 | |||
|---|---|---|---|
| Quadrant | BADHDUFLAG | Total packets | Discarded packets |
| A | 0 | 15 | 0 |
| B | 0 | 16 | 0 |
| C | 0 | 16 | 0 |
| D | 0 | 16 | 0 |
| Mode M0 | |||
|---|---|---|---|
| Quadrant | BADHDUFLAG | Total packets | Discarded packets |
| A | 0 | 13770 | 2 |
| B | 0 | 14113 | 2 |
| C | 0 | 13755 | 2 |
| D | 0 | 24115 | 2 |
| Mode SS | |||
|---|---|---|---|
| Quadrant | BADHDUFLAG | Total packets | Discarded packets |
| A | 0 | 124 | 0 |
| B | 0 | 124 | 0 |
| C | 0 | 124 | 0 |
| D | 0 | 124 | 0 |
| Quadrant | Total seconds | Saturated seconds | Saturation percentage |
|---|---|---|---|
| A | 6135 | 140 | 2.281989% |
| B | 6135 | 153 | 2.493888% |
| C | 6135 | 156 | 2.542787% |
| D | 6135 | 1130 | 18.418908% |
Noise dominated data is calculated using 1-second bins in cleaned event files. If a bin has >2000 counts, and if more than 50% of those come from <1% of pixels, then it is considered to be noise-dominated and hence unusable.
| Quadrant | # 1 sec bins | Bins with >0 counts | Bins with >2000 counts | High rate bins dominated by noise | Noise dominated (total time) | Noise dominated (detector-on time) | Marked lightcurve |
|---|---|---|---|---|---|---|---|
| A | 7440 | 6135 | 24 | 24 | 0.32% | 0.39% | 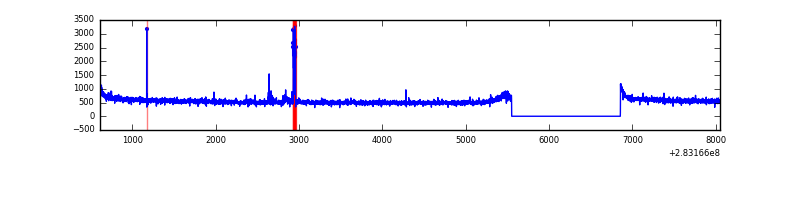 |
| B | 7440 | 6135 | 22 | 22 | 0.30% | 0.36% | 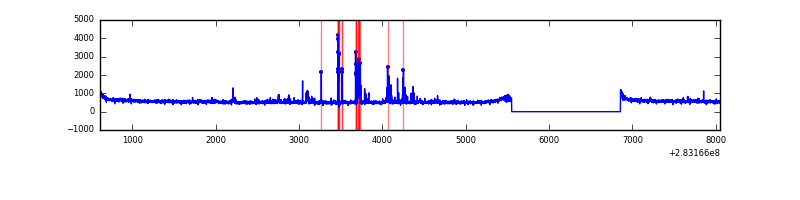 |
| C | 7440 | 6135 | 0 | 0 | 0.00% | 0.00% | 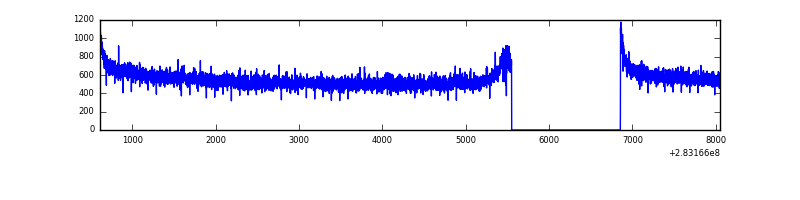 |
| D | 7439 | 6134 | 960 | 960 | 12.90% | 15.65% | 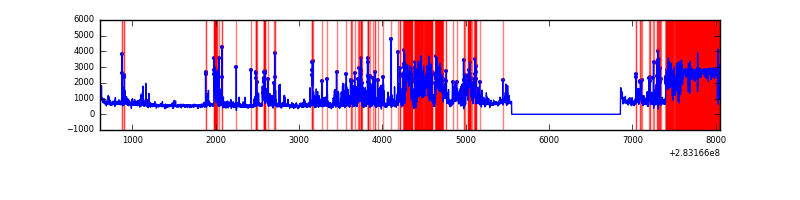 |
Top three noisy pixels from each quadrant. If the there are fewer than three noisy pixels in the level2.evt file, extra rows are filled as -1
| Pixel properties | Quadrant properties | ||||||
|---|---|---|---|---|---|---|---|
| Quadrant | DetID | PixID | Counts | Sigma | Mean | Median | Sigma |
| A | 15 | 174 | 88136 | 509.53 | 863 | 847 | 171.3 |
| A | 0 | 226 | 7731 | 40.18 | 863 | 847 | 171.3 |
| A | 12 | 194 | 6429 | 32.58 | 863 | 847 | 171.3 |
| B | 0 | 244 | 105799 | 659.82 | 850 | 832 | 159.1 |
| B | 6 | 36 | 20629 | 124.44 | 850 | 832 | 159.1 |
| B | 0 | 197 | 19383 | 116.61 | 850 | 832 | 159.1 |
| C | 14 | 238 | 129424 | 678.34 | 827 | 835 | 189.6 |
| C | 5 | 218 | 36585 | 188.59 | 827 | 835 | 189.6 |
| C | 3 | 233 | 10568 | 51.34 | 827 | 835 | 189.6 |
| D | 1 | 52 | 2437266 | 12382.49 | 772 | 753 | 196.8 |
| D | 13 | 189 | 828763 | 4207.99 | 772 | 753 | 196.8 |
| D | 7 | 238 | 190787 | 965.76 | 772 | 753 | 196.8 |
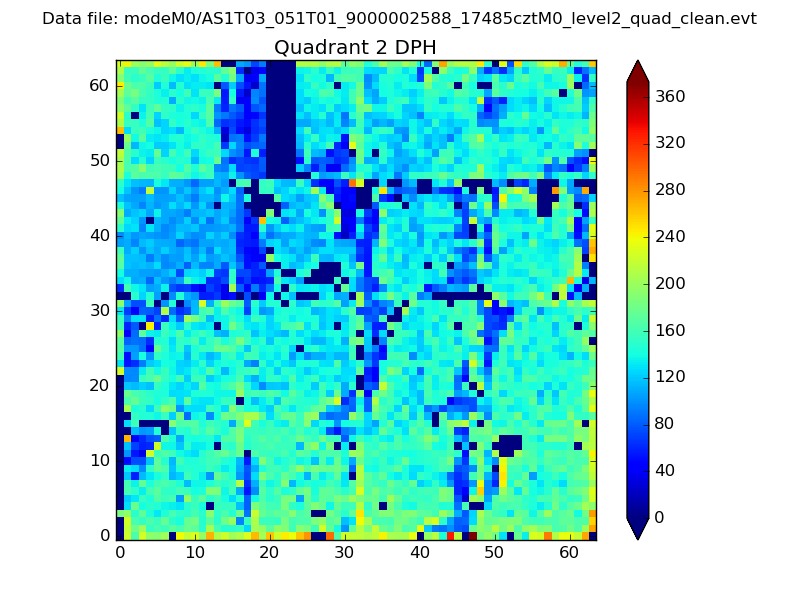
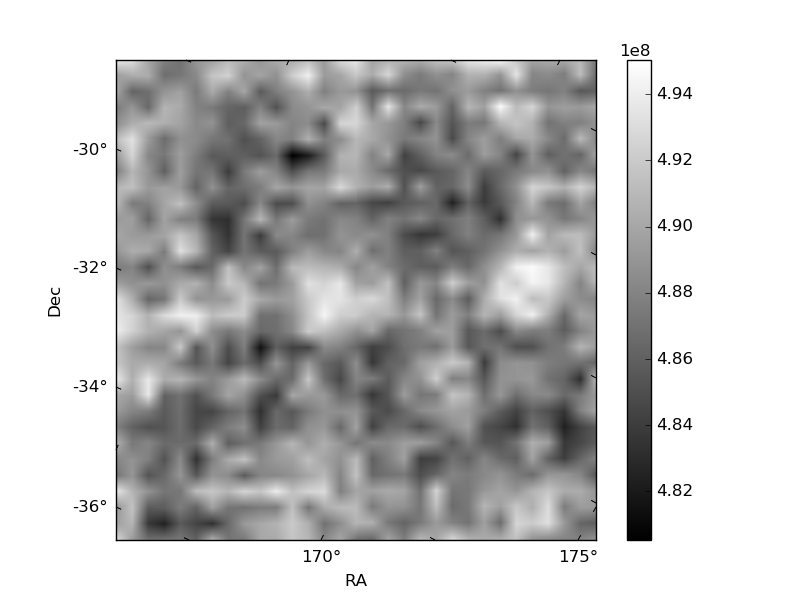
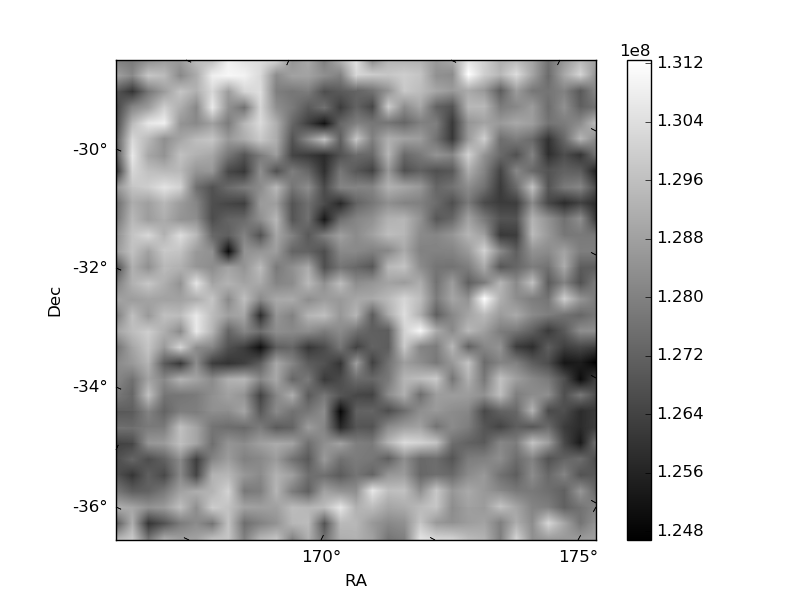
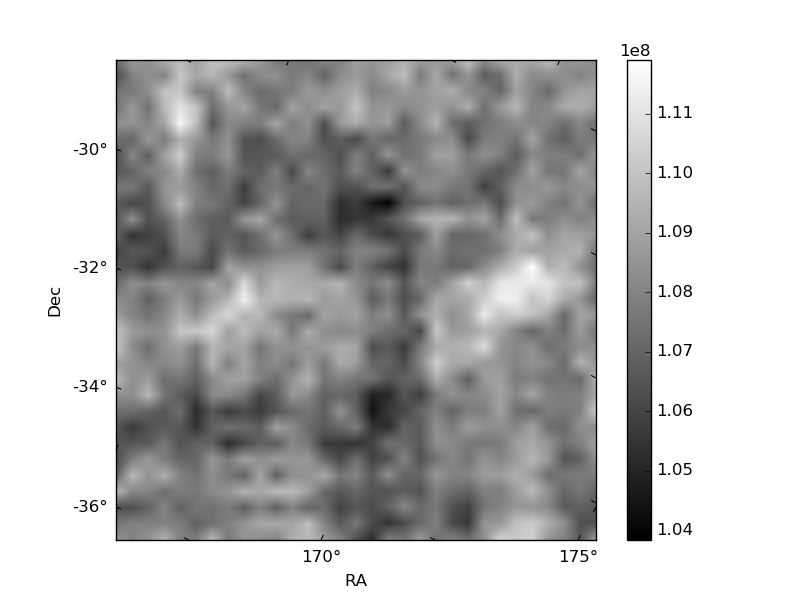
Histogram calculated using DETX and DETY for each event in the final _common_clean file
| Quadrant A | 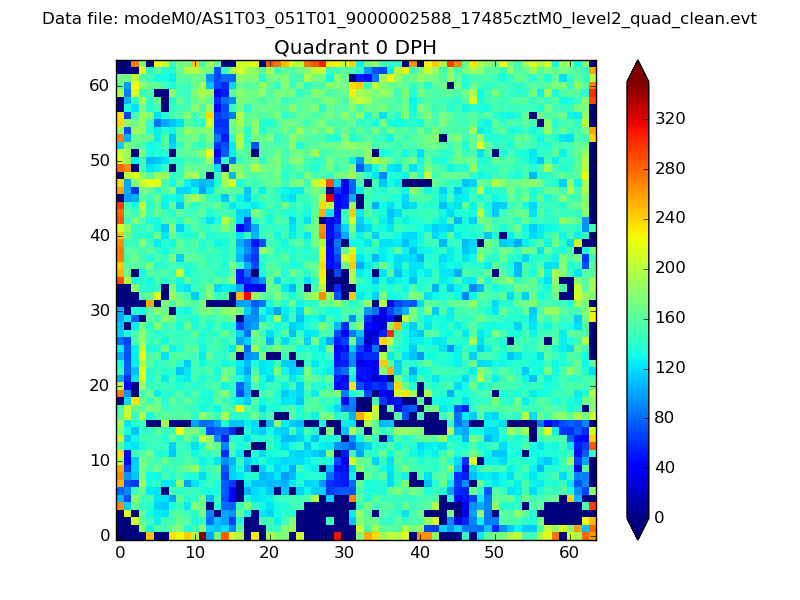 |
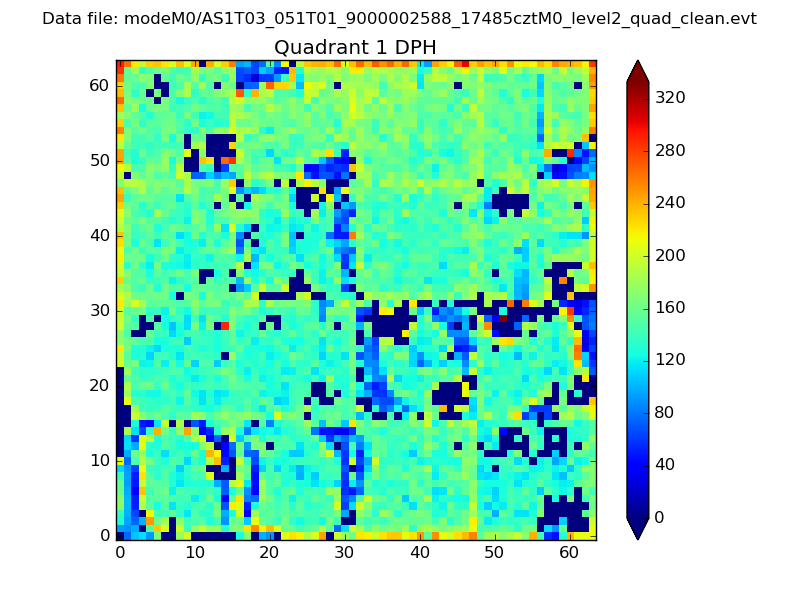 |
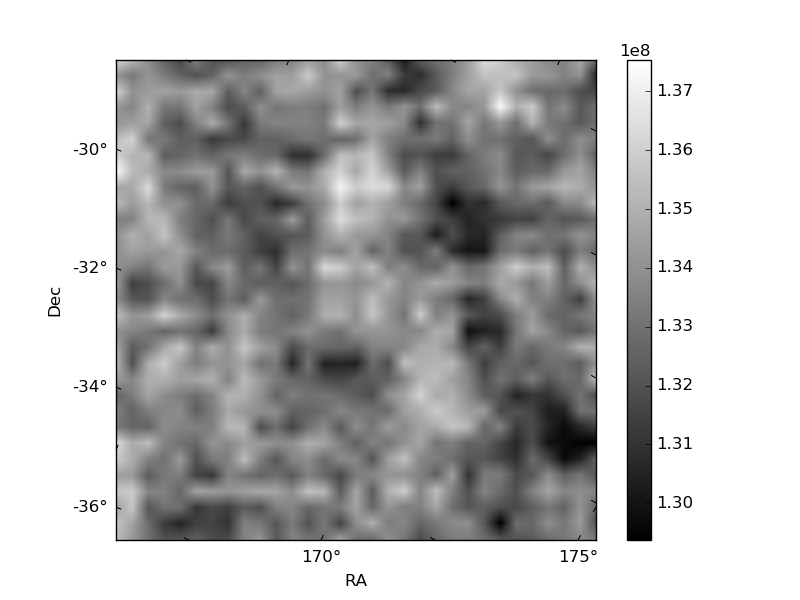
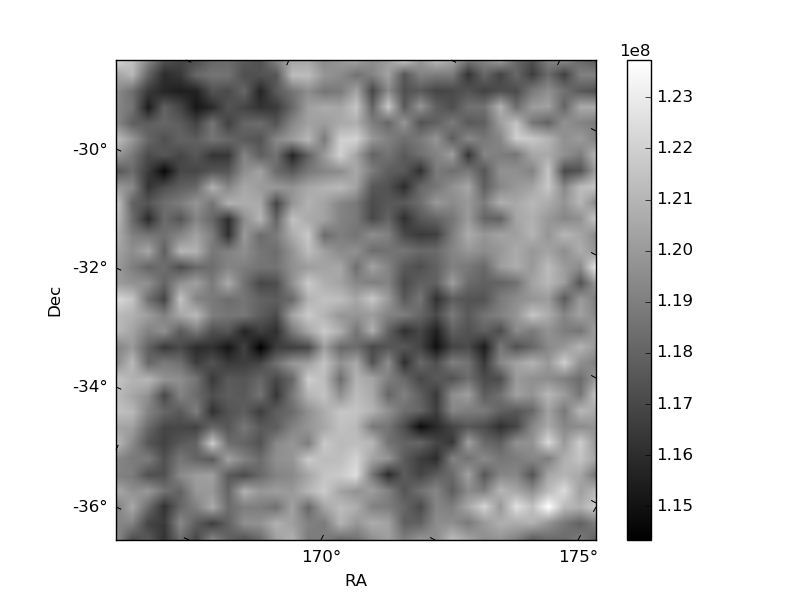
Quadrant B |
|---|---|---|---|
| Quadrant D | 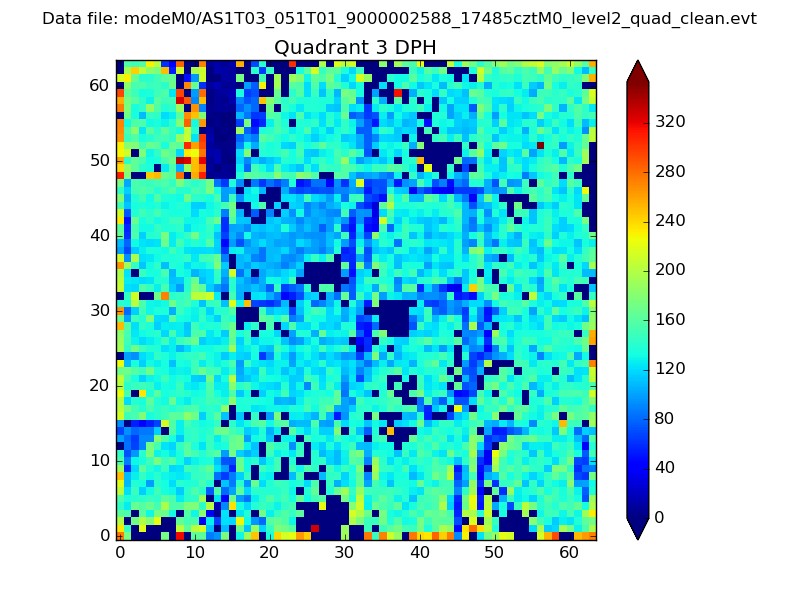 |
 |
Quadrant C |
| Plot type | Count rate plots | Images |
|---|---|---|
| Comparison with Poisson distribution Blue bars denote a histogram of data divided into 1 sec bins. Red curve is a Poisson curve with rate = median count rate of data. |
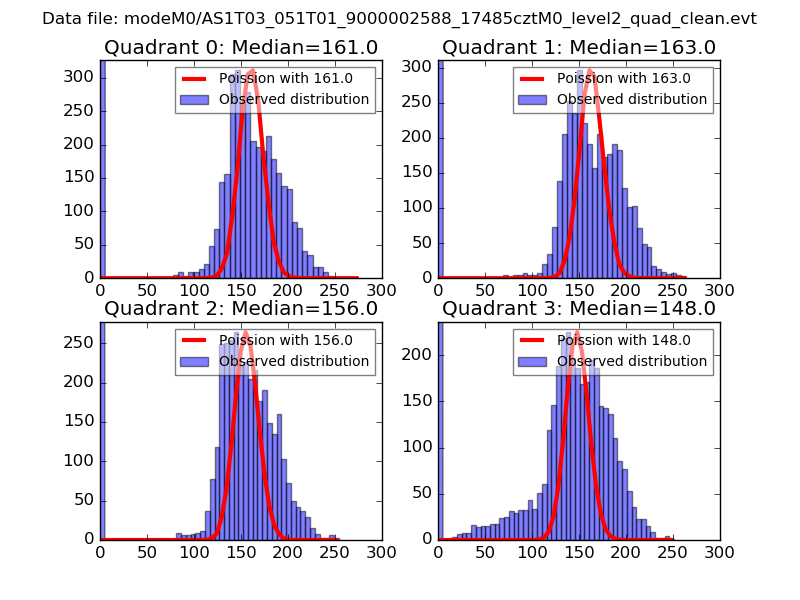 |
 |
| Quadrant-wise count rates Data is divided into 100 sec bins |
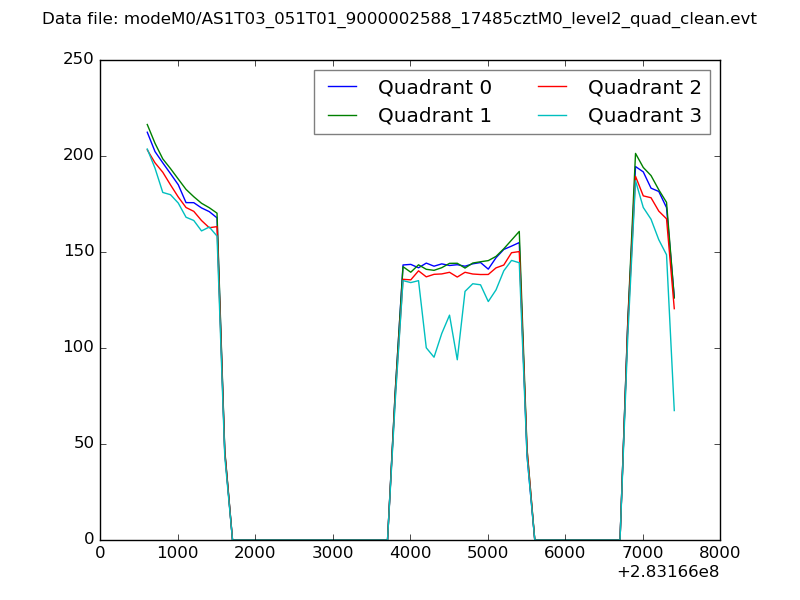 |
|
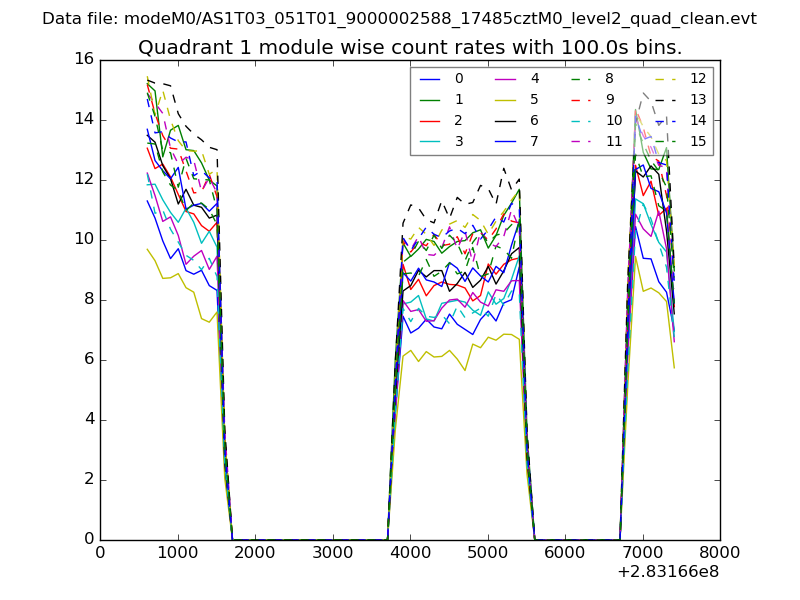
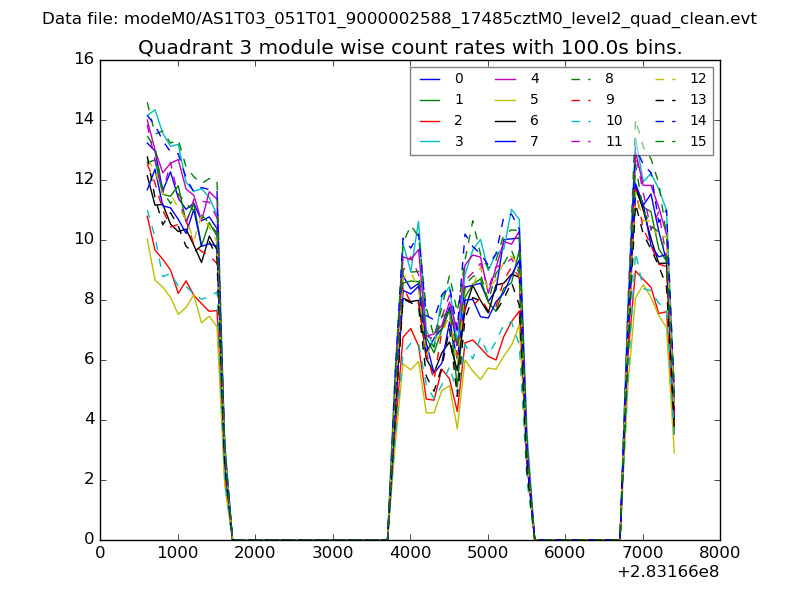
| Module-wise count rates for Quadrant A Data is divided into 100 sec bins |
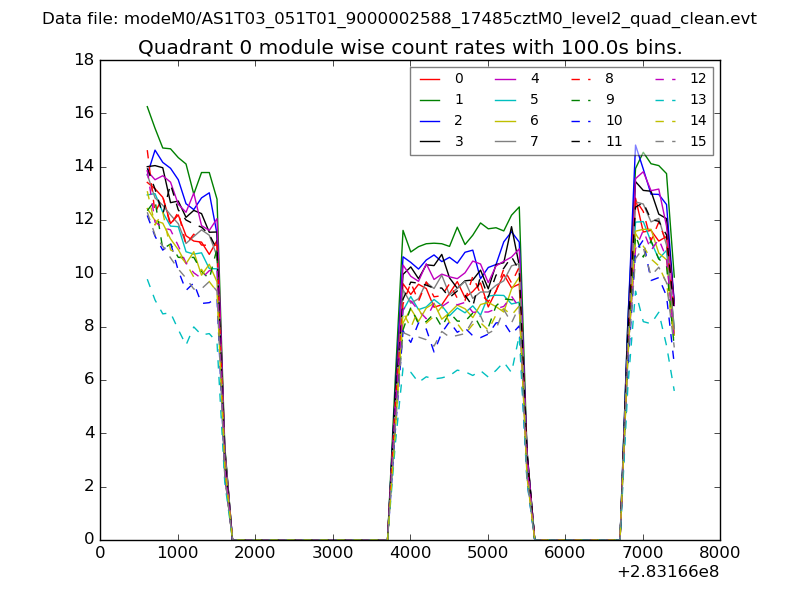 |
 |
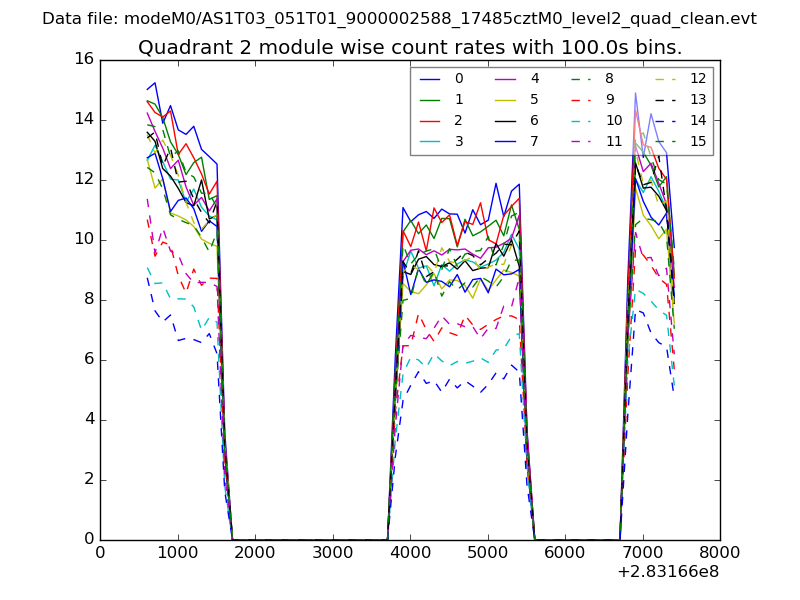
| Module-wise count rates for Quadrant B Data is divided into 100 sec bins |
 |
 |
| Module-wise count rates for Quadrant C Data is divided into 100 sec bins |
 |
 |
| Module-wise count rates for Quadrant D Data is divided into 100 sec bins |
 |
 |
| Parameter | Plot |
|---|---|
| CZT HV Monitor | 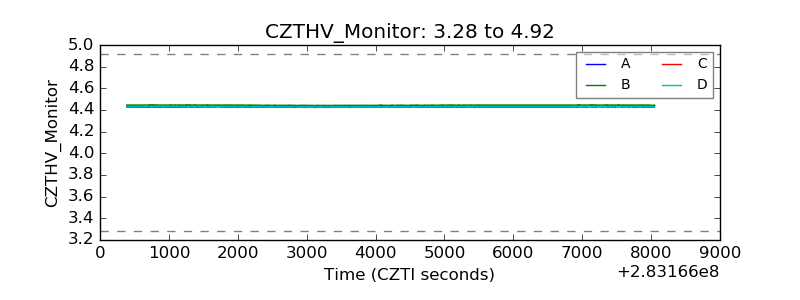 |
| D_VDD | 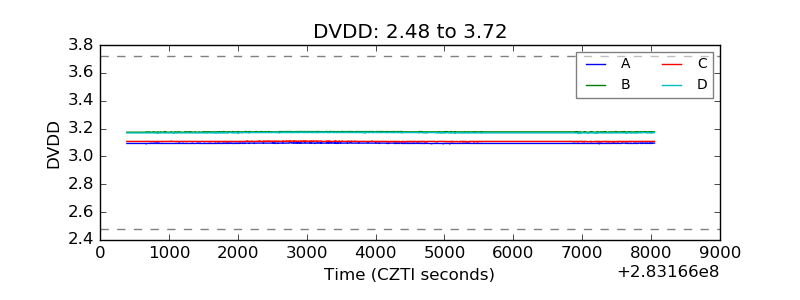 |
| Temperature 1 | 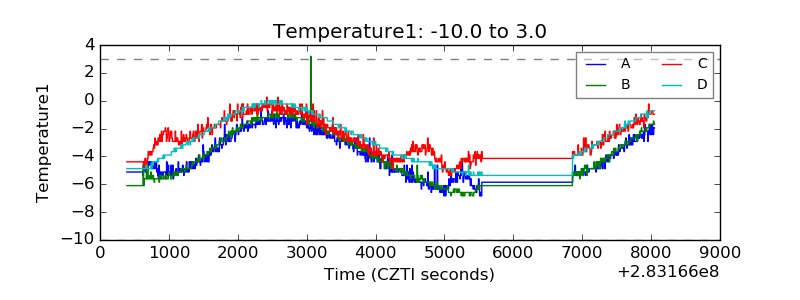 |
| Veto HV Monitor | 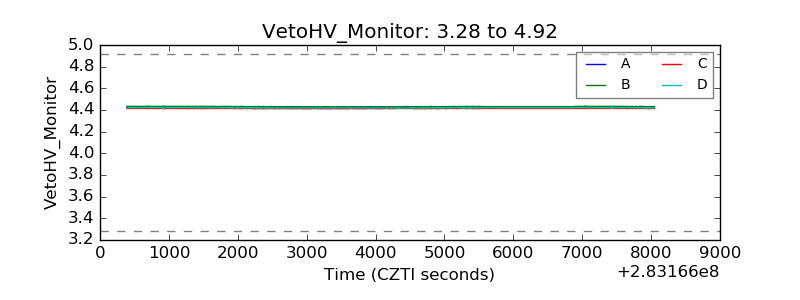 |
| Veto LLD | 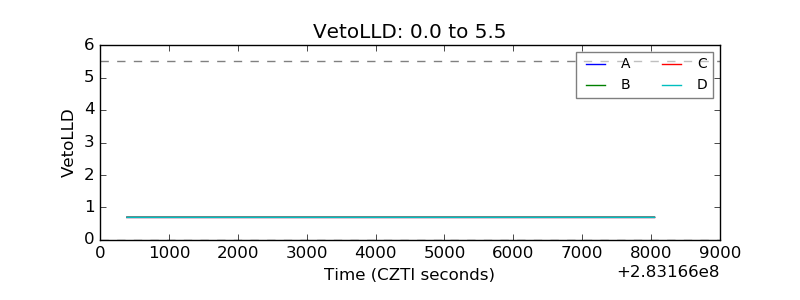 |
| Alpha Counter | 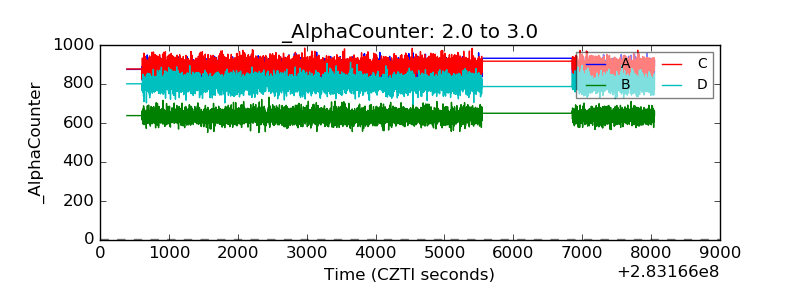 |
| _CPM_Rate |  |
| CZT Counter | 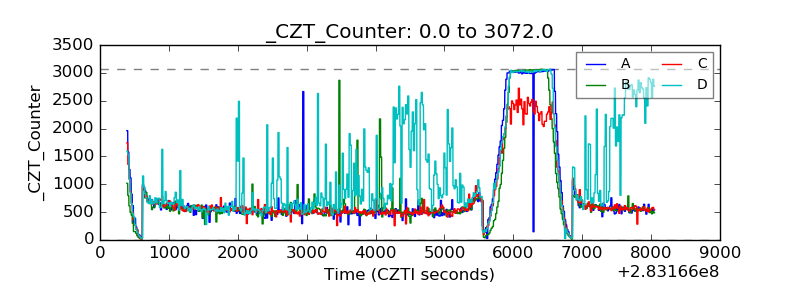 |
| +2.5 Volts monitor |  |
| +5 Volts monitor |  |
| _ROLL_ROT | 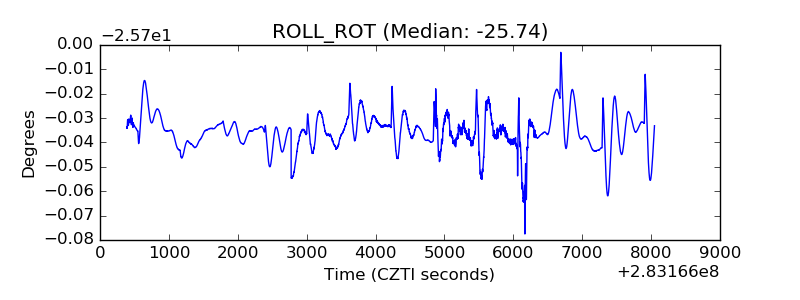 |
| _Roll_DEC | 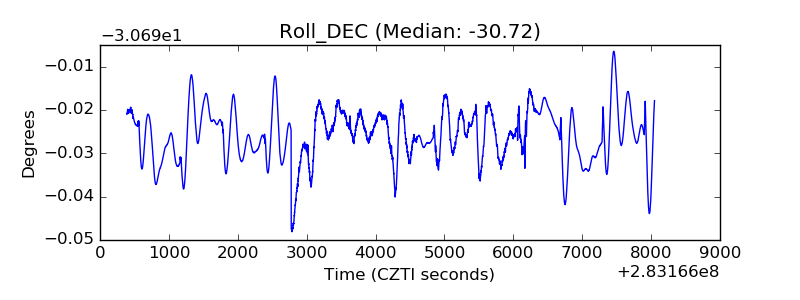 |
| _Roll_RA | 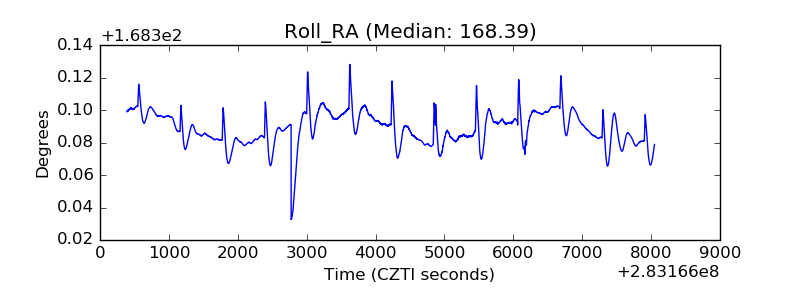 |
| Veto Counter | 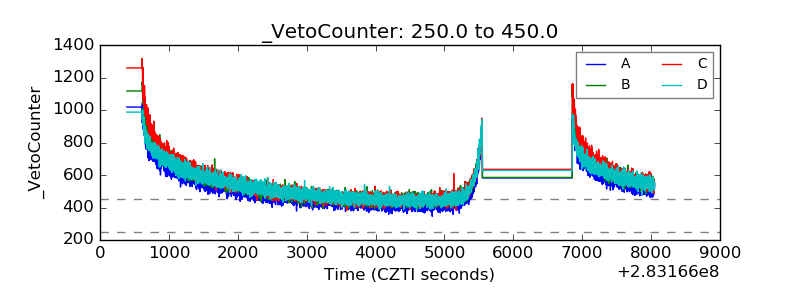 |