| Param | Original file | Final file |
|---|---|---|
| Filename | modeM0/AS1T03_051T01_9000002588_17486cztM0_level2.evt | modeM0/AS1T03_051T01_9000002588_17486cztM0_level2_quad_clean.evt |
| Size (bytes) | 378,987,840 | 32,054,400 |
| Size | 361.4 MB | 30.6 MB |
| Events in quadrant A | 1,788,450 | 193,496 |
| Events in quadrant B | 2,109,978 | 194,763 |
| Events in quadrant C | 1,799,176 | 185,656 |
| Events in quadrant D | 5,546,871 | 152,911 |
| Mode M0 | |||
|---|---|---|---|
| Quadrant | BADHDUFLAG | Total packets | Discarded packets |
| A | 0 | 7299 | 0 |
| B | 0 | 8395 | 0 |
| C | 0 | 7329 | 0 |
| D | 0 | 18889 | 0 |
| Mode SS | |||
|---|---|---|---|
| Quadrant | BADHDUFLAG | Total packets | Discarded packets |
| A | 0 | 68 | 0 |
| B | 0 | 68 | 0 |
| C | 0 | 68 | 0 |
| D | 0 | 68 | 0 |
| Quadrant | Total seconds | Saturated seconds | Saturation percentage |
|---|---|---|---|
| A | 3427 | 3 | 0.087540% |
| B | 3427 | 48 | 1.400642% |
| C | 3428 | 16 | 0.466744% |
| D | 3428 | 1308 | 38.156359% |
Noise dominated data is calculated using 1-second bins in cleaned event files. If a bin has >2000 counts, and if more than 50% of those come from <1% of pixels, then it is considered to be noise-dominated and hence unusable.
| Quadrant | # 1 sec bins | Bins with >0 counts | Bins with >2000 counts | High rate bins dominated by noise | Noise dominated (total time) | Noise dominated (detector-on time) | Marked lightcurve |
|---|---|---|---|---|---|---|---|
| A | 3427 | 3427 | 0 | 0 | 0.00% | 0.00% | 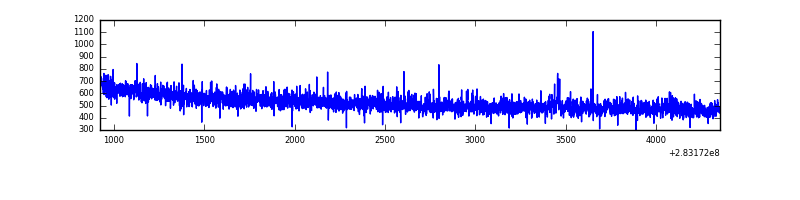 |
| B | 3427 | 3427 | 30 | 30 | 0.88% | 0.88% | 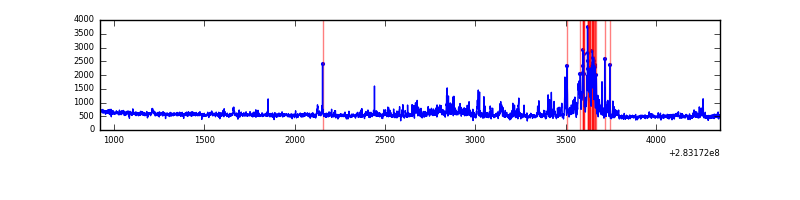 |
| C | 3428 | 3428 | 0 | 0 | 0.00% | 0.00% | 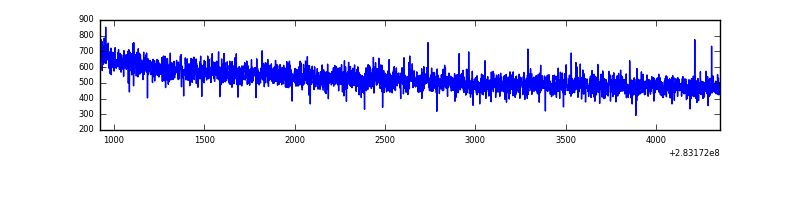 |
| D | 3428 | 3428 | 1253 | 1253 | 36.55% | 36.55% | 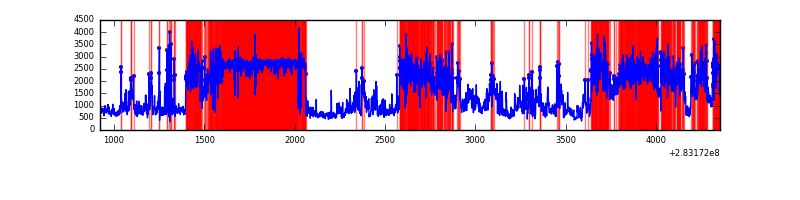 |
Top three noisy pixels from each quadrant. If the there are fewer than three noisy pixels in the level2.evt file, extra rows are filled as -1
| Pixel properties | Quadrant properties | ||||||
|---|---|---|---|---|---|---|---|
| Quadrant | DetID | PixID | Counts | Sigma | Mean | Median | Sigma |
| A | 15 | 174 | 7279 | 73.05 | 463 | 456 | 93.4 |
| A | 0 | 226 | 4264 | 40.77 | 463 | 456 | 93.4 |
| A | 12 | 194 | 3538 | 33.0 | 463 | 456 | 93.4 |
| B | 12 | 17 | 152618 | 1790.4 | 452 | 443 | 85.0 |
| B | 7 | 220 | 94975 | 1112.21 | 452 | 443 | 85.0 |
| B | 4 | 216 | 39406 | 458.42 | 452 | 443 | 85.0 |
| C | 14 | 238 | 69271 | 679.0 | 437 | 442 | 101.4 |
| C | 3 | 233 | 14223 | 135.95 | 437 | 442 | 101.4 |
| C | 5 | 218 | 9012 | 84.54 | 437 | 442 | 101.4 |
| D | 1 | 52 | 3562094 | 38904.3 | 373 | 363 | 91.6 |
| D | 5 | 222 | 253057 | 2760.14 | 373 | 363 | 91.6 |
| D | 13 | 189 | 128503 | 1399.66 | 373 | 363 | 91.6 |
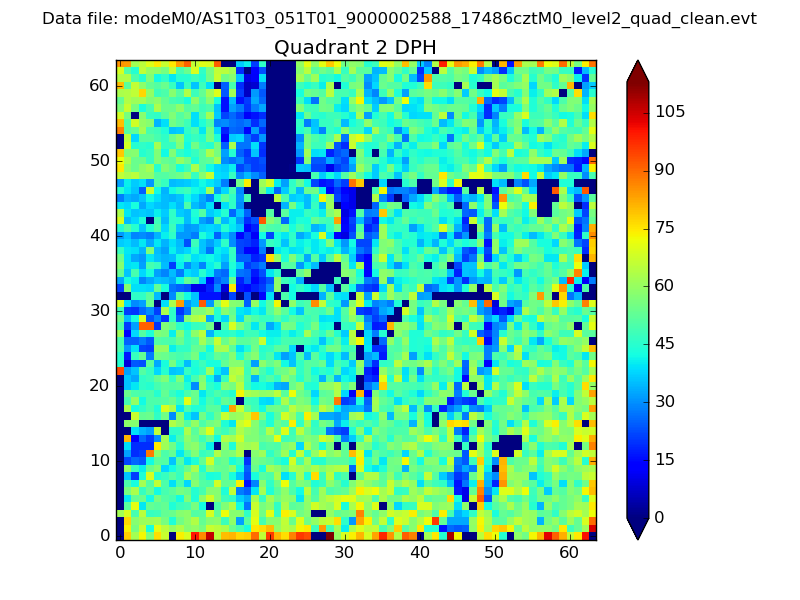
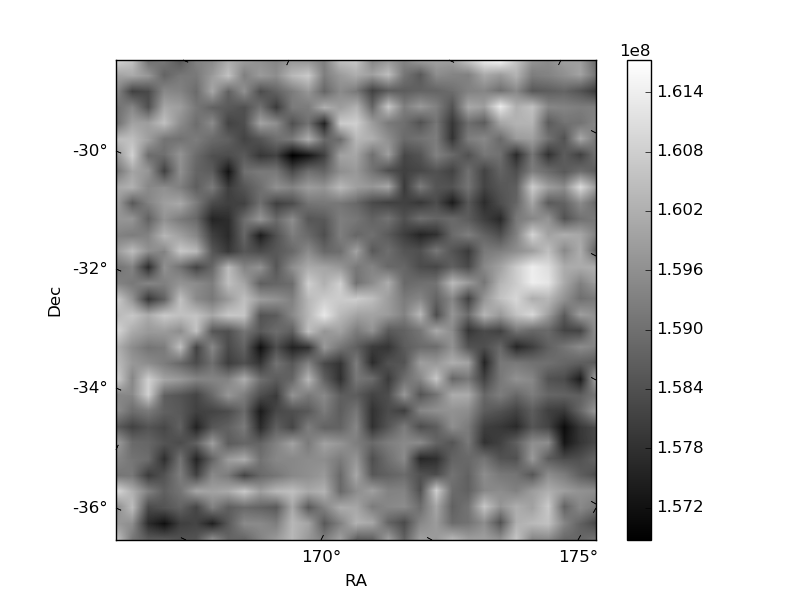
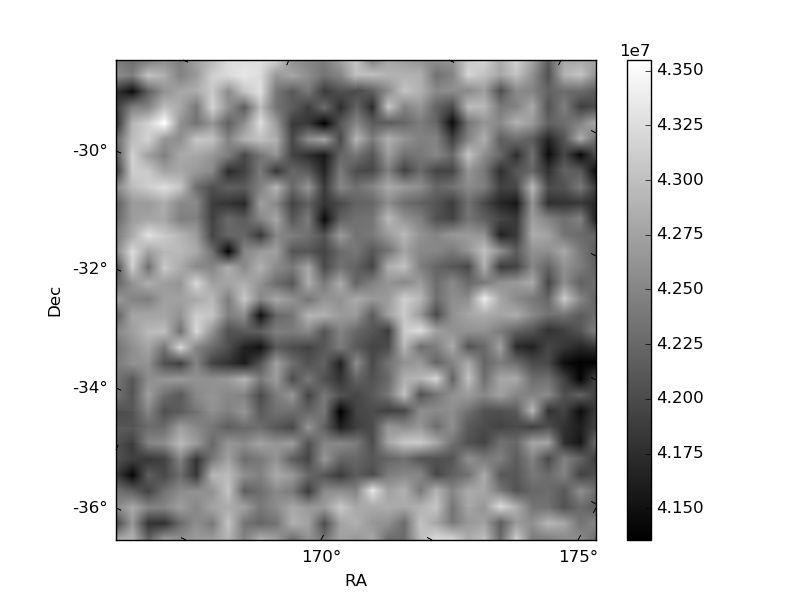
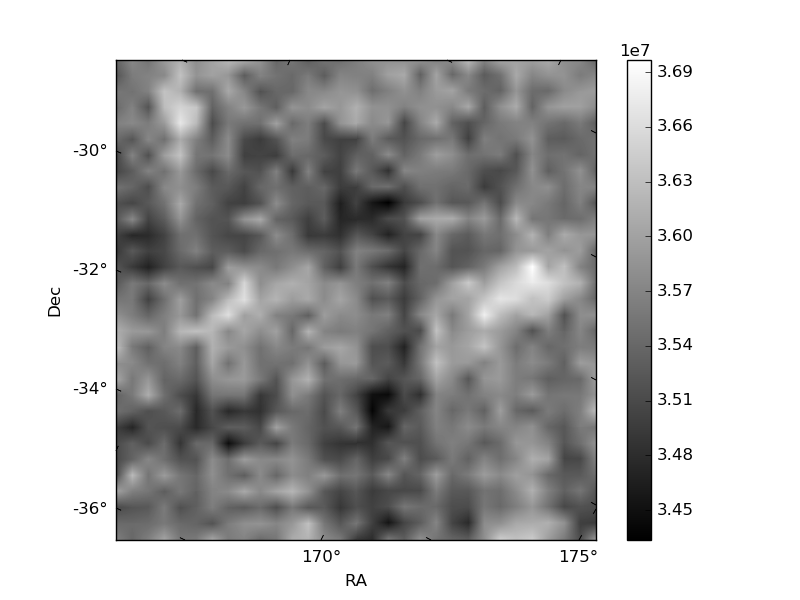
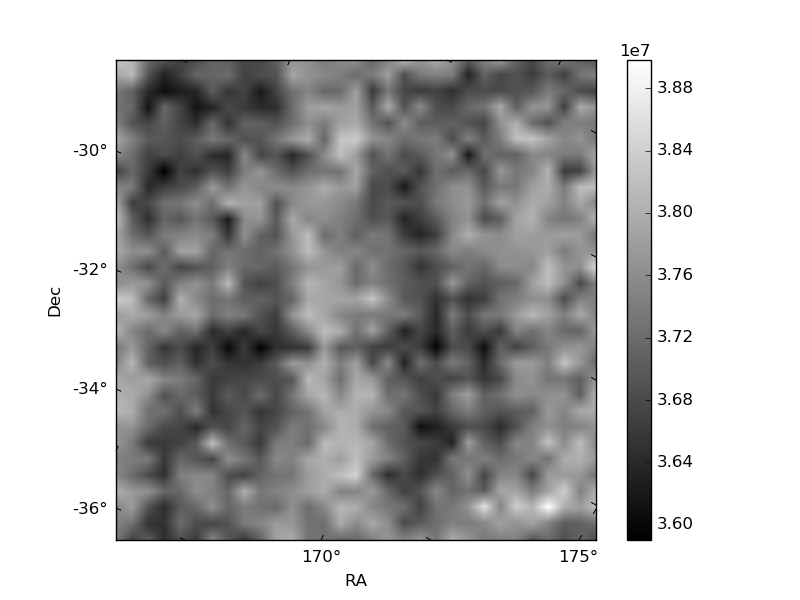
Histogram calculated using DETX and DETY for each event in the final _common_clean file
| Quadrant A | 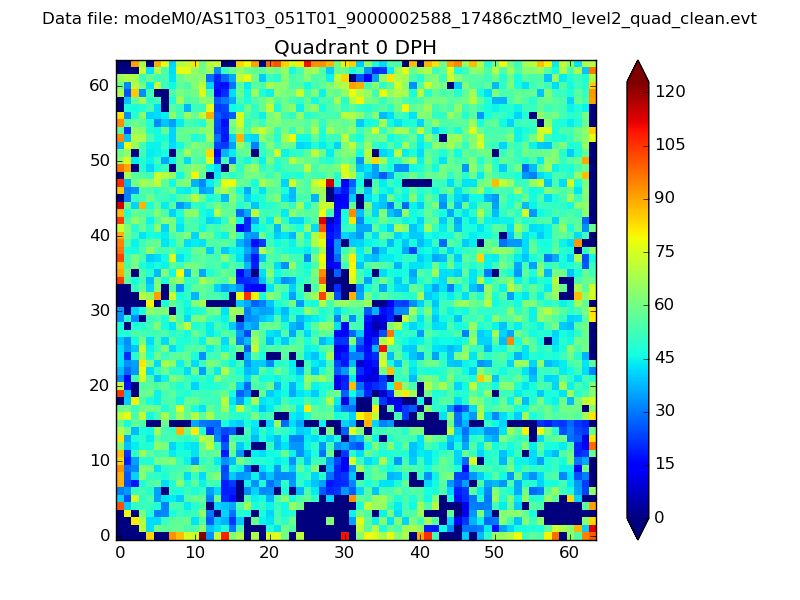 |
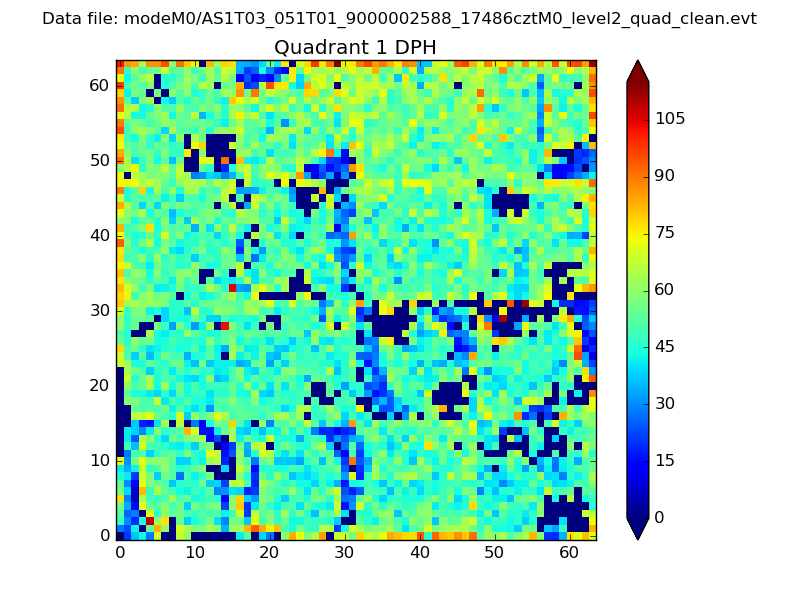 |
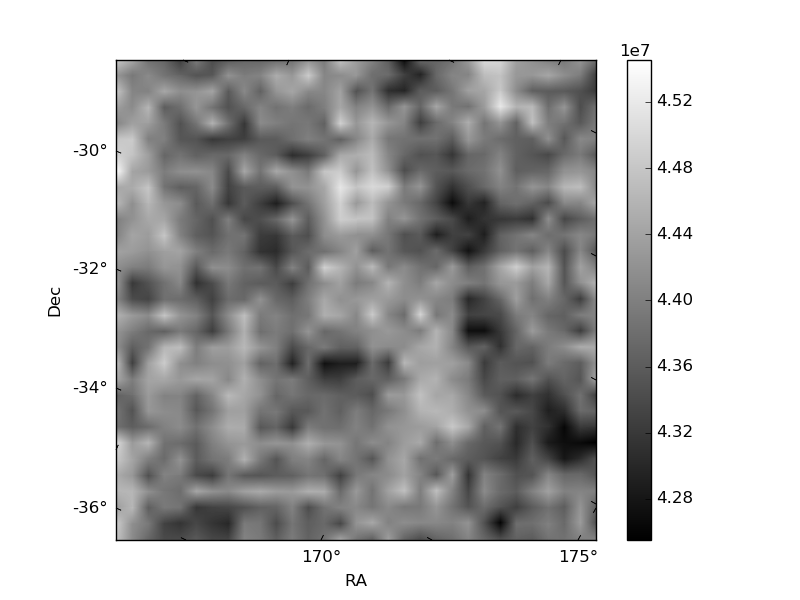
Quadrant B |
|---|---|---|---|
| Quadrant D | 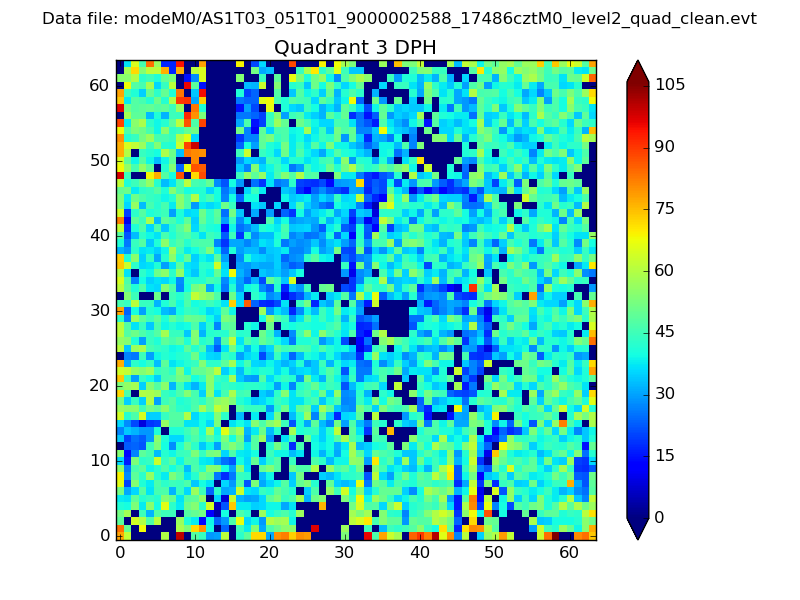 |
 |
Quadrant C |
| Plot type | Count rate plots | Images |
|---|---|---|
| Comparison with Poisson distribution Blue bars denote a histogram of data divided into 1 sec bins. Red curve is a Poisson curve with rate = median count rate of data. |
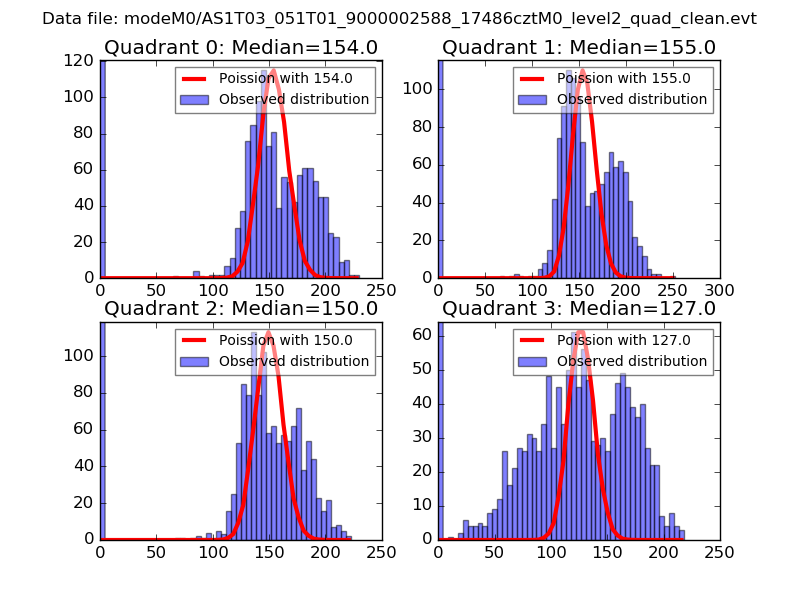 |
 |
| Quadrant-wise count rates Data is divided into 100 sec bins |
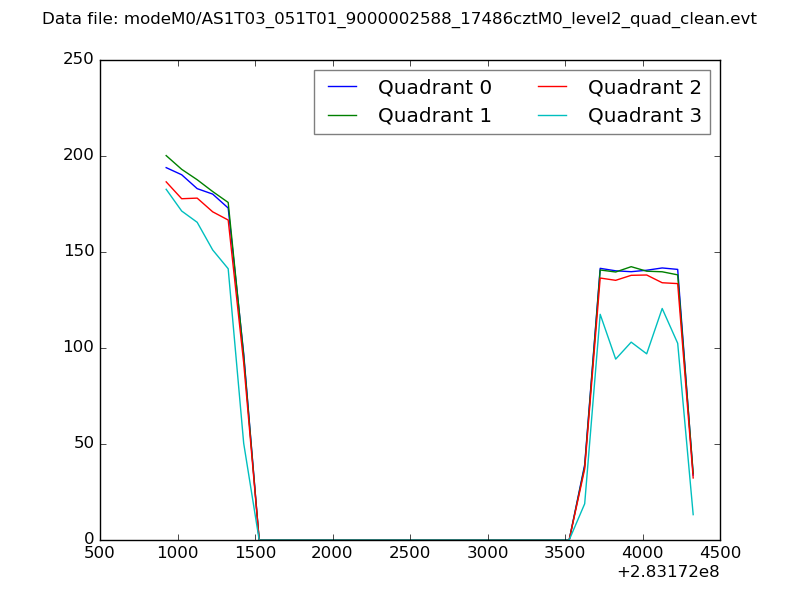 |
|
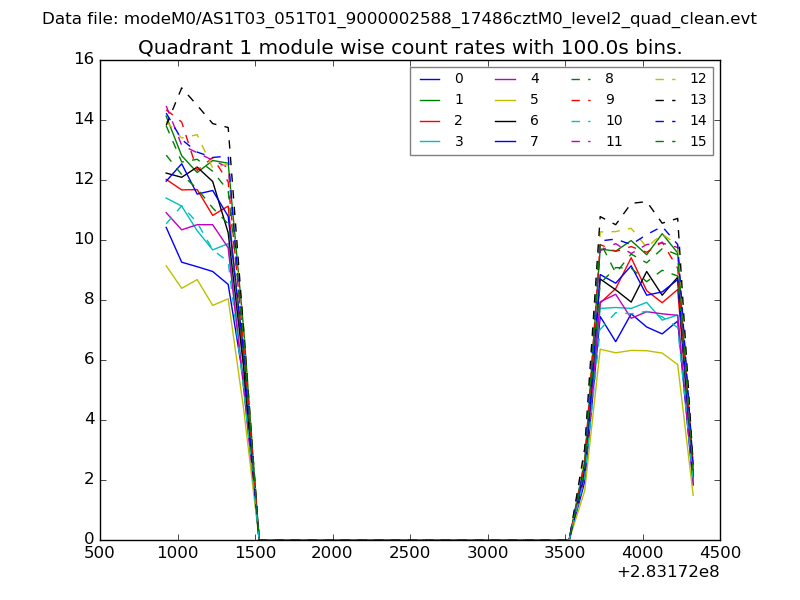
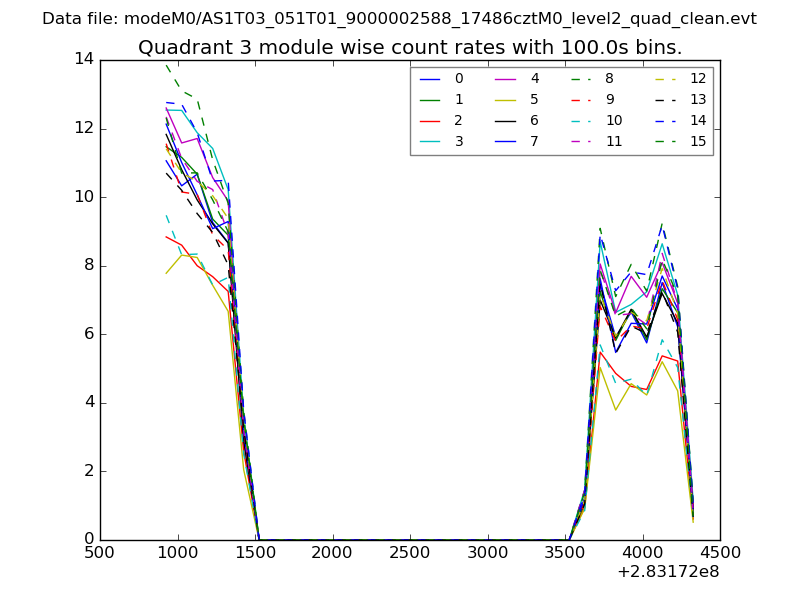
| Module-wise count rates for Quadrant A Data is divided into 100 sec bins |
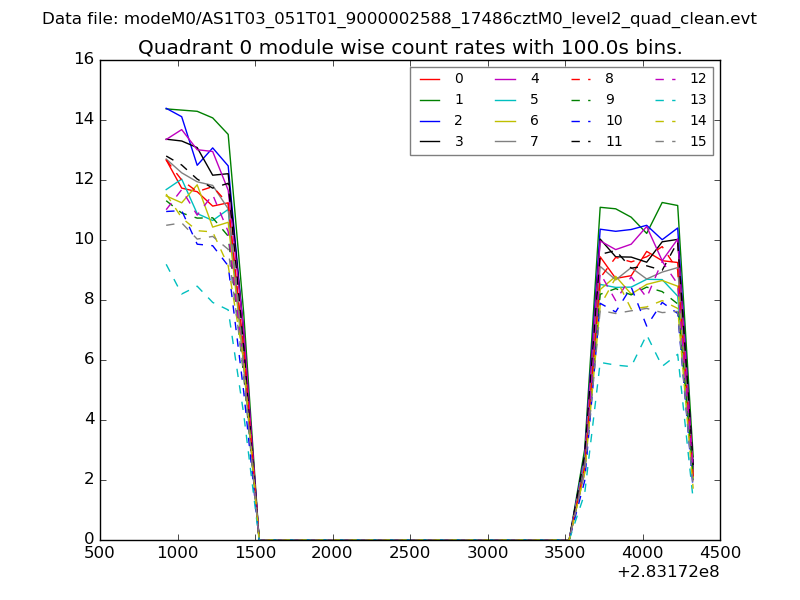 |
 |
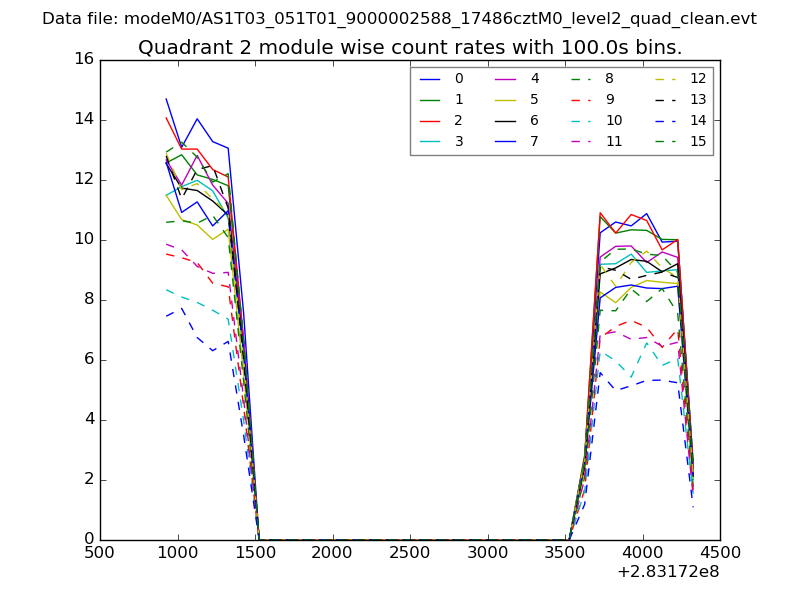
| Module-wise count rates for Quadrant B Data is divided into 100 sec bins |
 |
 |
| Module-wise count rates for Quadrant C Data is divided into 100 sec bins |
 |
 |
| Module-wise count rates for Quadrant D Data is divided into 100 sec bins |
 |
 |
| Parameter | Plot |
|---|---|
| CZT HV Monitor | 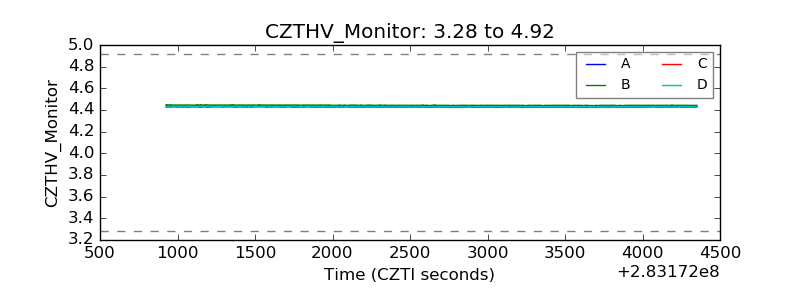 |
| D_VDD | 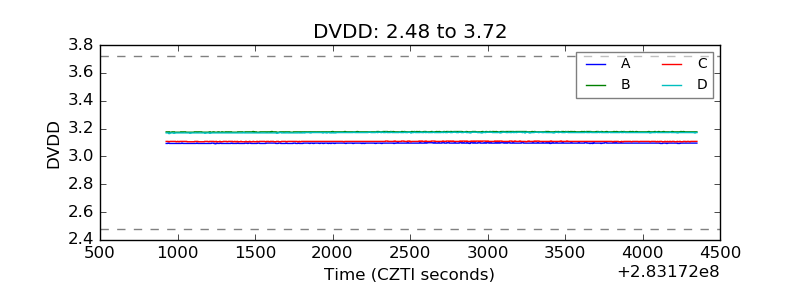 |
| Temperature 1 | 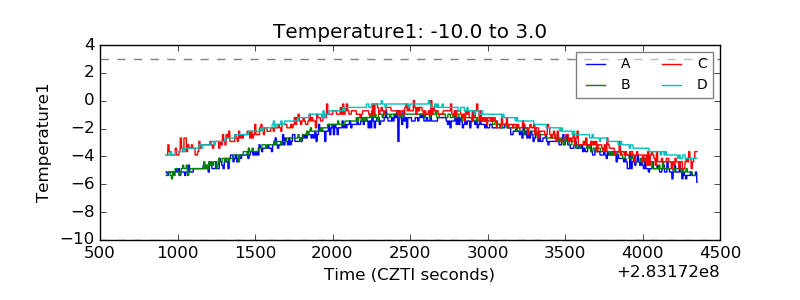 |
| Veto HV Monitor | 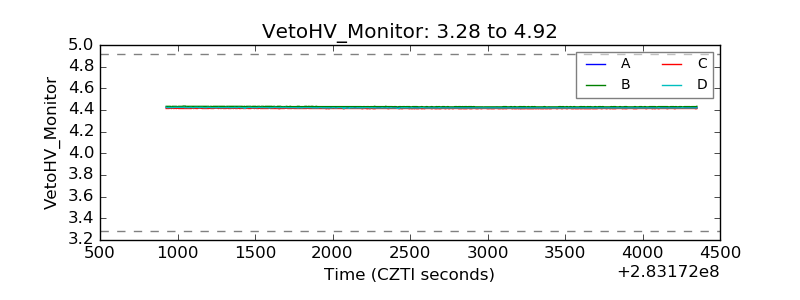 |
| Veto LLD | 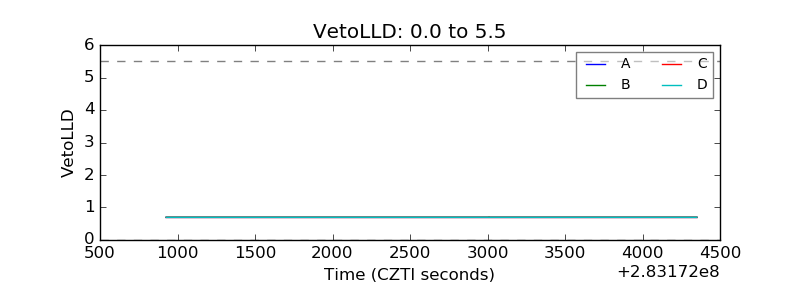 |
| Alpha Counter | 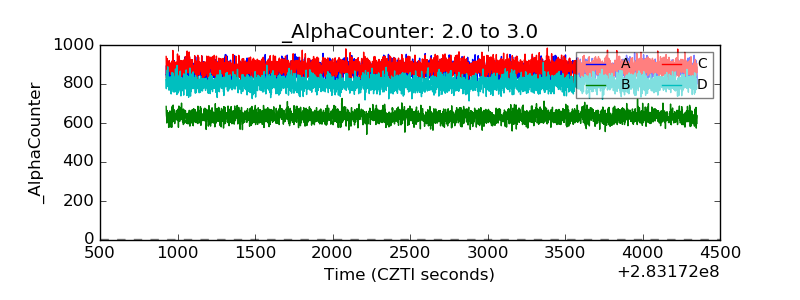 |
| _CPM_Rate |  |
| CZT Counter | 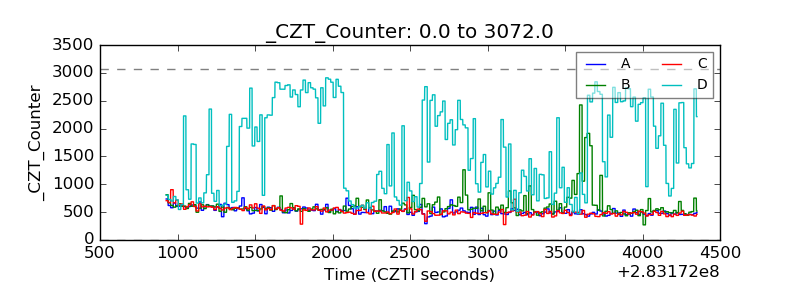 |
| +2.5 Volts monitor |  |
| +5 Volts monitor |  |
| _ROLL_ROT | 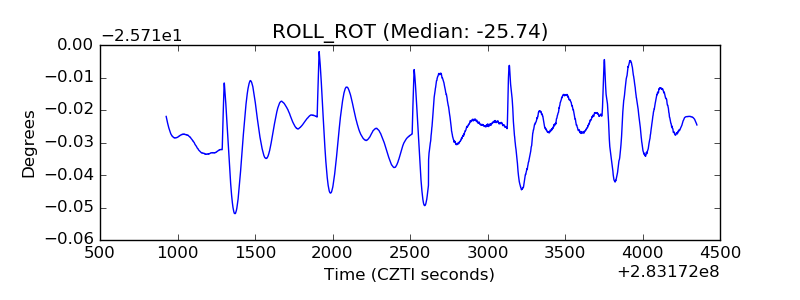 |
| _Roll_DEC | 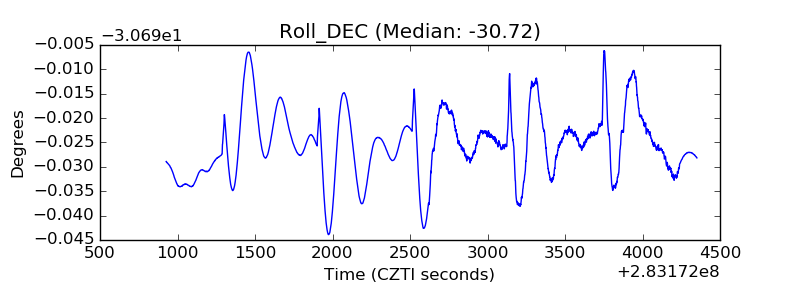 |
| _Roll_RA | 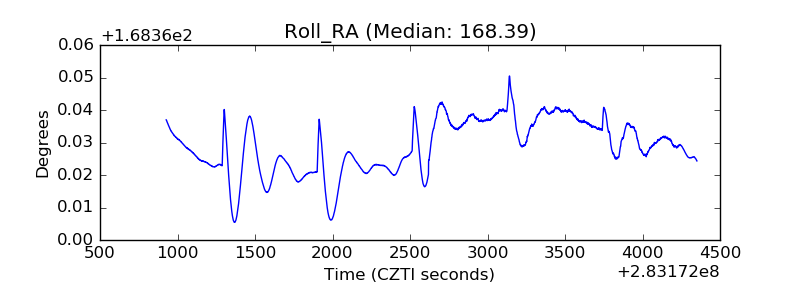 |
| Veto Counter |  |