| Param | Original file | Final file |
|---|---|---|
| Filename | modeM0/AS1T03_068T01_9000002594_17500cztM0_level2.evt | modeM0/AS1T03_068T01_9000002594_17500cztM0_level2_quad_clean.evt |
| Size (bytes) | 95,209,920 | 29,557,440 |
| Size | 90.8 MB | 28.2 MB |
| Events in quadrant A | 716,249 | 203,558 |
| Events in quadrant B | 692,984 | 206,250 |
| Events in quadrant C | 700,190 | 194,999 |
| Events in quadrant D | 682,790 | 192,576 |
| Mode M0 | |||
|---|---|---|---|
| Quadrant | BADHDUFLAG | Total packets | Discarded packets |
| A | 0 | 2831 | 1 |
| B | 0 | 2768 | 1 |
| C | 0 | 2794 | 1 |
| D | 0 | 2768 | 1 |
| Mode SS | |||
|---|---|---|---|
| Quadrant | BADHDUFLAG | Total packets | Discarded packets |
| A | 0 | 26 | 0 |
| B | 0 | 26 | 0 |
| C | 0 | 26 | 0 |
| D | 0 | 26 | 0 |
| Mode M9 | |||
|---|---|---|---|
| Quadrant | BADHDUFLAG | Total packets | Discarded packets |
| A | 0 | 10 | 0 |
| B | 0 | 10 | 0 |
| C | 0 | 10 | 0 |
| D | 0 | 10 | 0 |
| Quadrant | Total seconds | Saturated seconds | Saturation percentage |
|---|---|---|---|
| A | 1296 | 11 | 0.848765% |
| B | 1296 | 16 | 1.234568% |
| C | 1296 | 10 | 0.771605% |
| D | 1296 | 1 | 0.077160% |
Noise dominated data is calculated using 1-second bins in cleaned event files. If a bin has >2000 counts, and if more than 50% of those come from <1% of pixels, then it is considered to be noise-dominated and hence unusable.
| Quadrant | # 1 sec bins | Bins with >0 counts | Bins with >2000 counts | High rate bins dominated by noise | Noise dominated (total time) | Noise dominated (detector-on time) | Marked lightcurve |
|---|---|---|---|---|---|---|---|
| A | 1296 | 1296 | 0 | 0 | 0.00% | 0.00% | 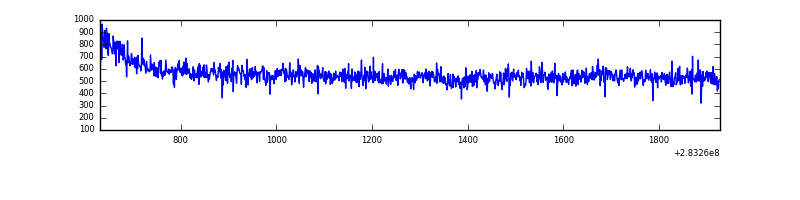 |
| B | 1296 | 1296 | 0 | 0 | 0.00% | 0.00% | 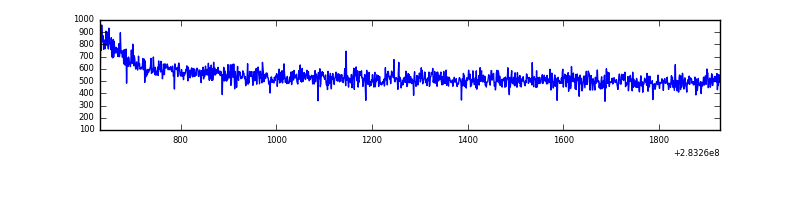 |
| C | 1296 | 1296 | 0 | 0 | 0.00% | 0.00% | 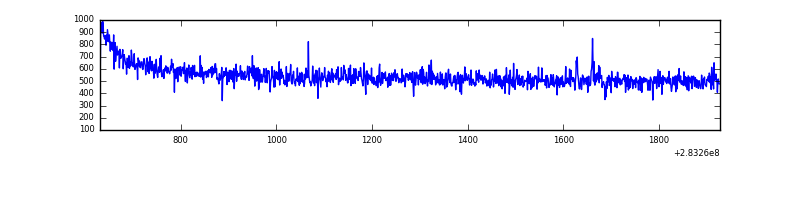 |
| D | 1296 | 1296 | 0 | 0 | 0.00% | 0.00% | 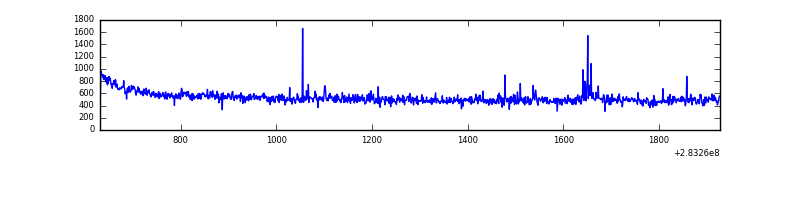 |
Top three noisy pixels from each quadrant. If the there are fewer than three noisy pixels in the level2.evt file, extra rows are filled as -1
| Pixel properties | Quadrant properties | ||||||
|---|---|---|---|---|---|---|---|
| Quadrant | DetID | PixID | Counts | Sigma | Mean | Median | Sigma |
| A | 13 | 210 | 16334 | 418.79 | 182 | 179 | 38.6 |
| A | 0 | 226 | 1600 | 36.84 | 182 | 179 | 38.6 |
| A | 12 | 194 | 1327 | 29.76 | 182 | 179 | 38.6 |
| B | 12 | 111 | 3779 | 101.69 | 177 | 173 | 35.5 |
| B | 11 | 111 | 3353 | 89.67 | 177 | 173 | 35.5 |
| B | 14 | 111 | 2923 | 77.55 | 177 | 173 | 35.5 |
| C | 14 | 238 | 26907 | 661.76 | 168 | 169 | 40.4 |
| C | 5 | 218 | 10212 | 248.56 | 168 | 169 | 40.4 |
| C | 3 | 233 | 3041 | 71.08 | 168 | 169 | 40.4 |
| D | 13 | 189 | 12278 | 281.58 | 174 | 169 | 43.0 |
| D | 2 | 234 | 4263 | 95.2 | 174 | 169 | 43.0 |
| D | 3 | 238 | 2868 | 62.76 | 174 | 169 | 43.0 |
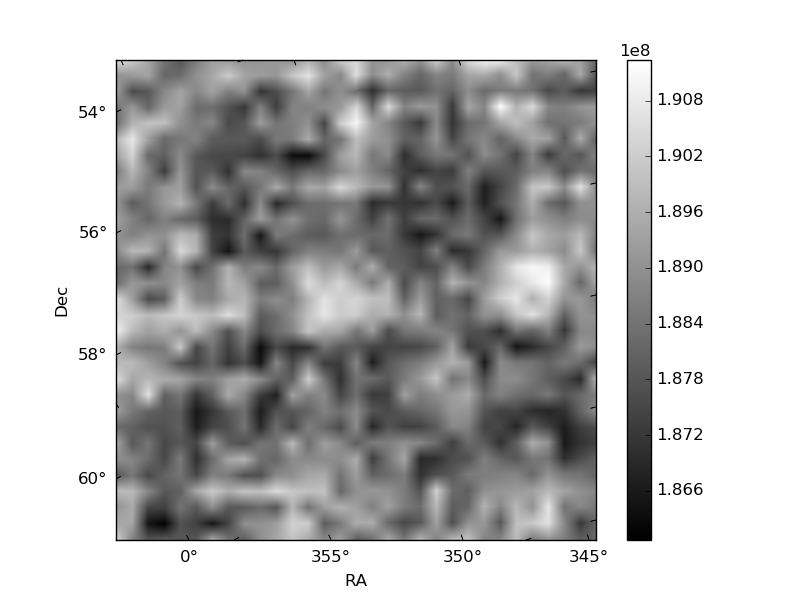
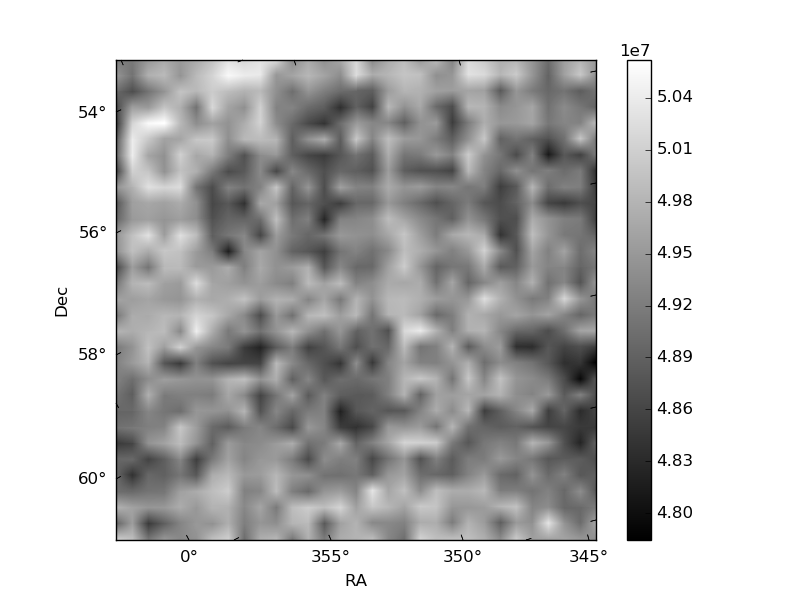
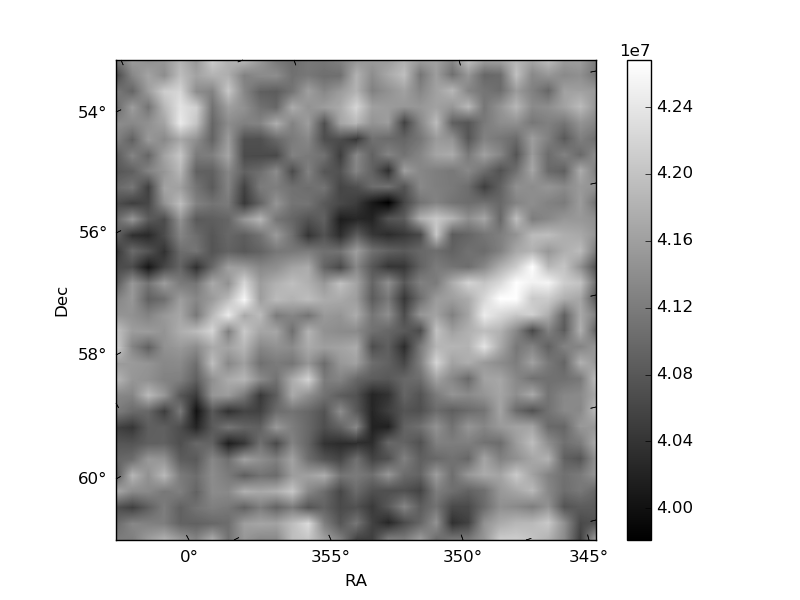
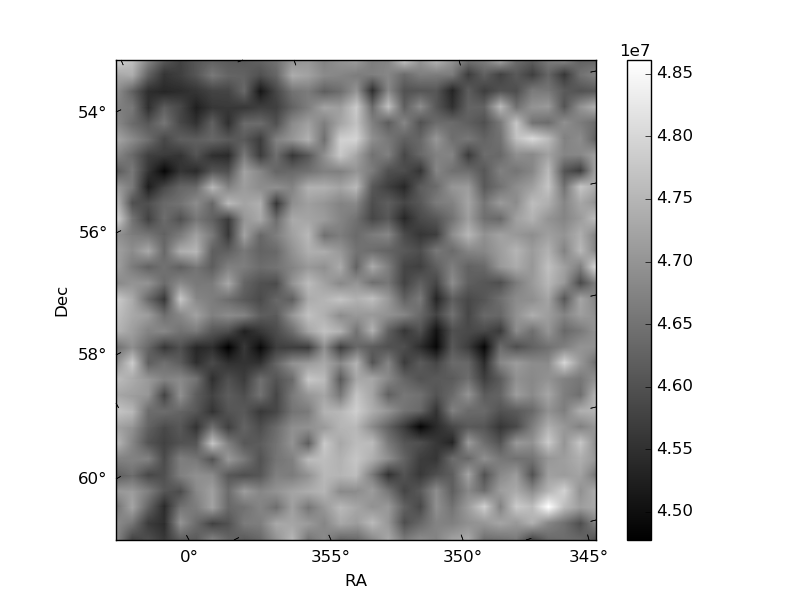
Histogram calculated using DETX and DETY for each event in the final _common_clean file
| Quadrant A | 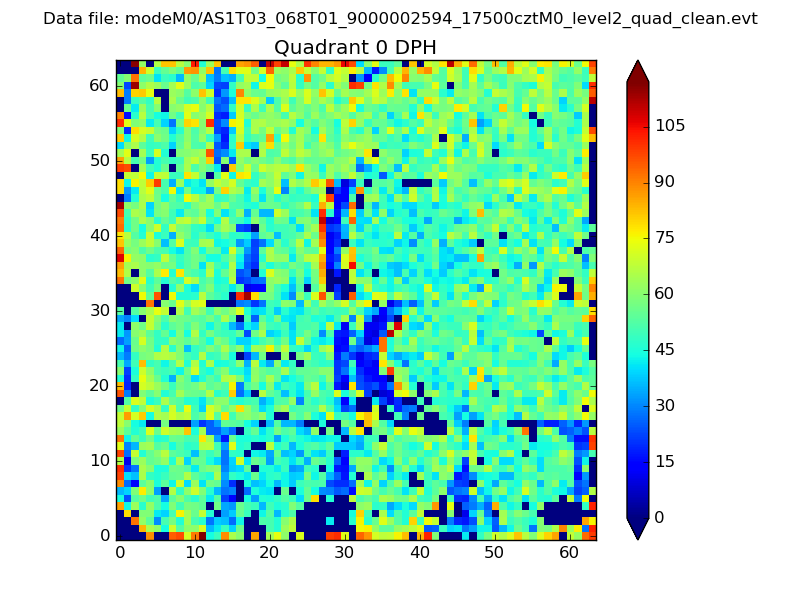 |
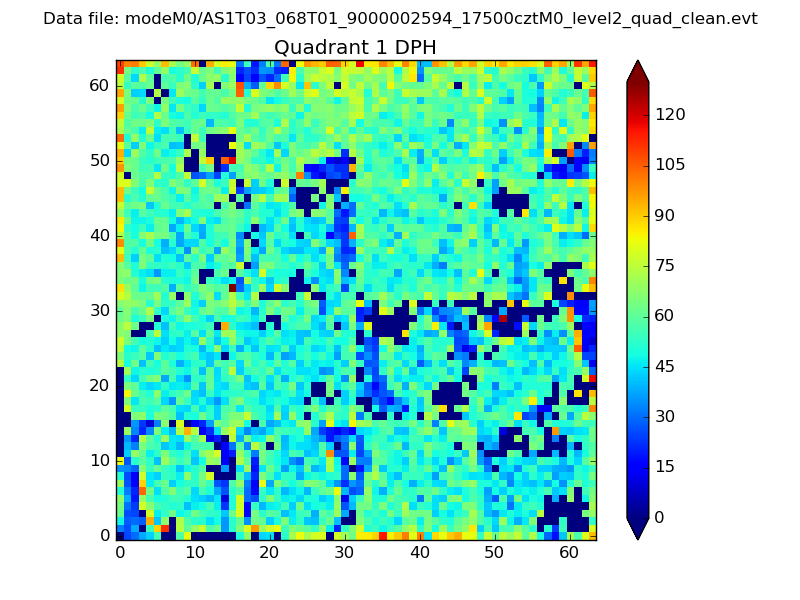 |
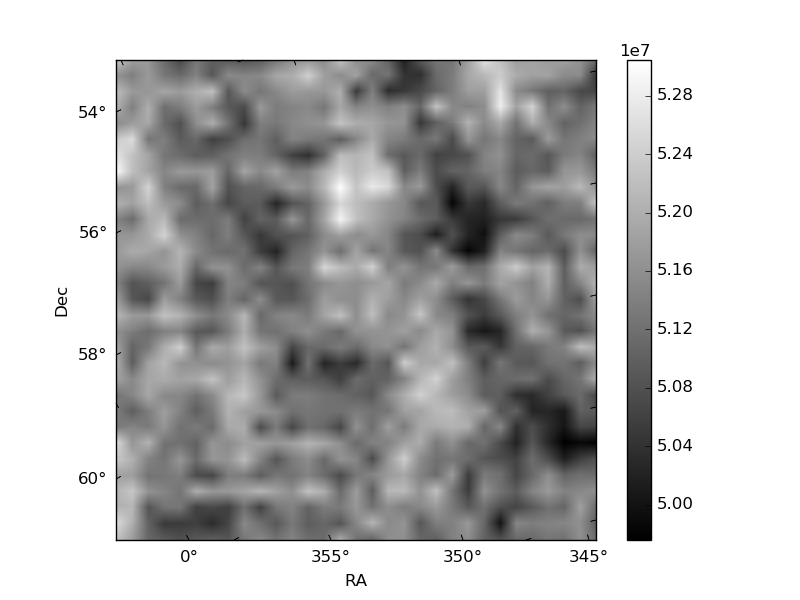
Quadrant B |
|---|---|---|---|
| Quadrant D | 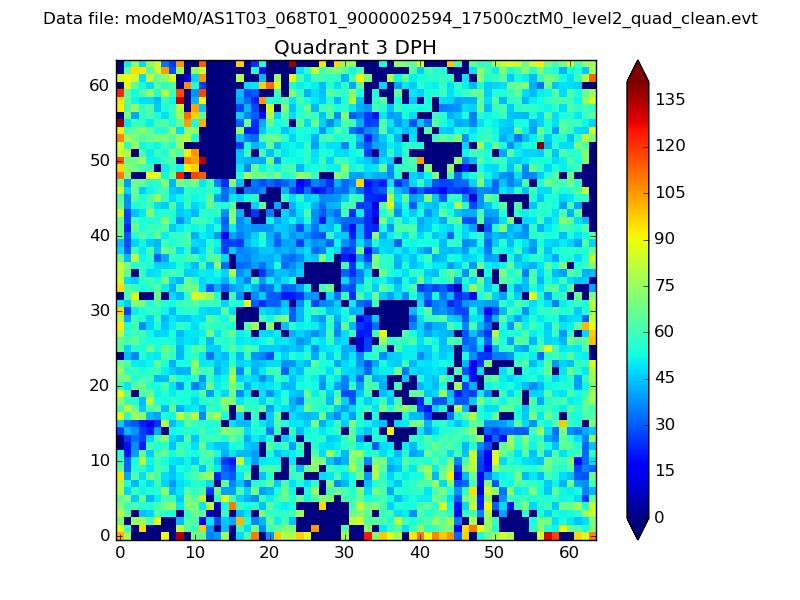 |
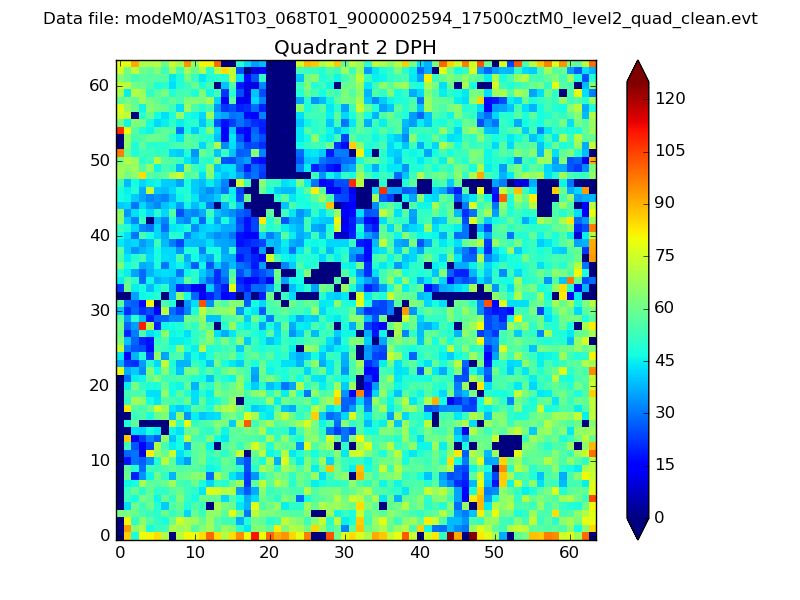 |
Quadrant C |
| Plot type | Count rate plots | Images |
|---|---|---|
| Comparison with Poisson distribution Blue bars denote a histogram of data divided into 1 sec bins. Red curve is a Poisson curve with rate = median count rate of data. |
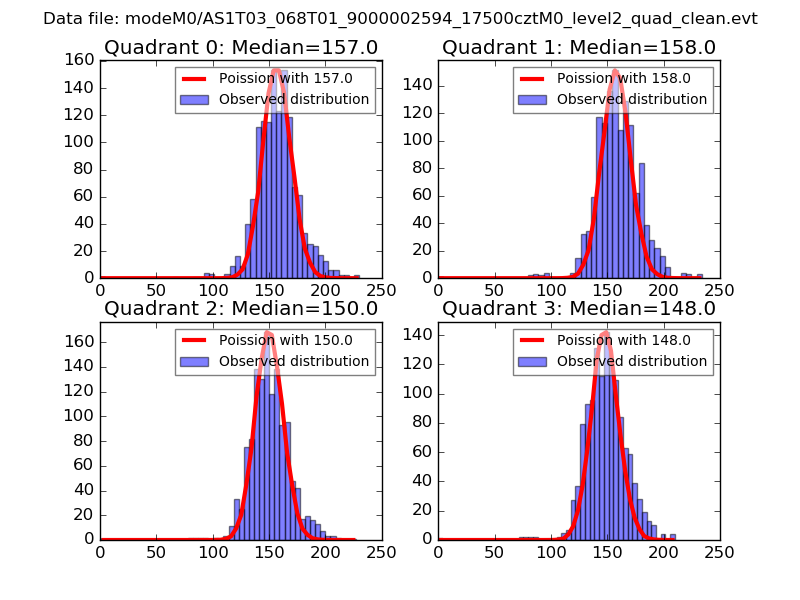 |
 |
| Quadrant-wise count rates Data is divided into 100 sec bins |
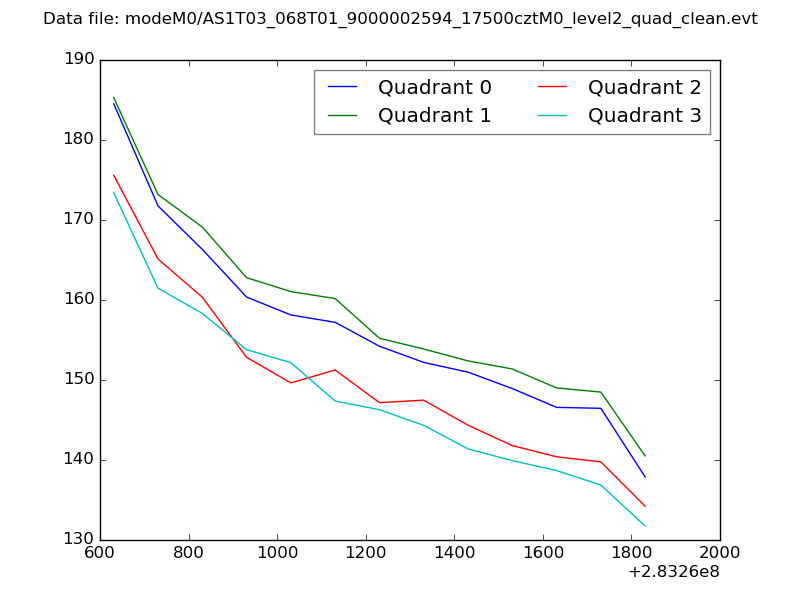 |
|
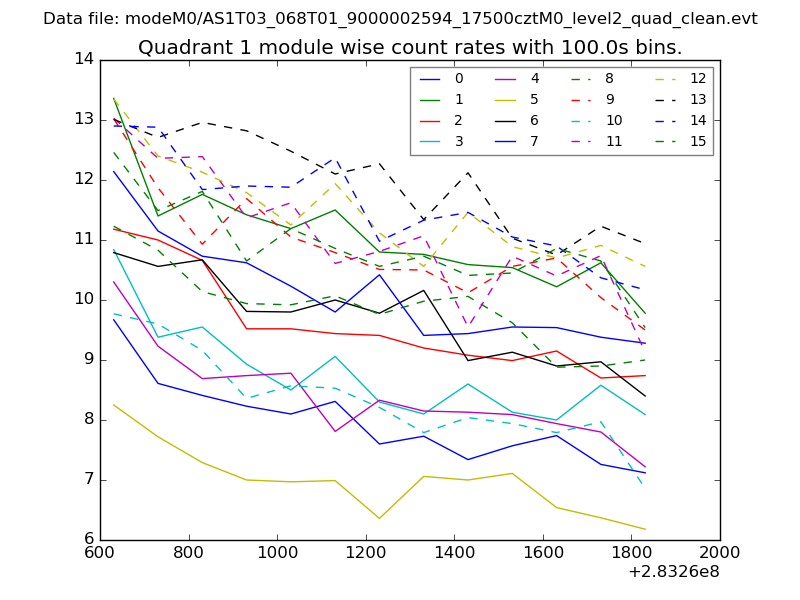
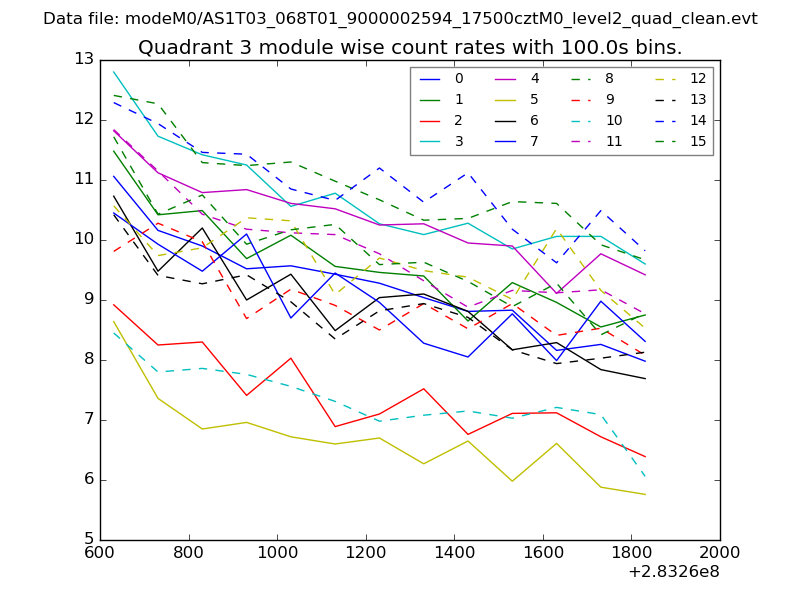
| Module-wise count rates for Quadrant A Data is divided into 100 sec bins |
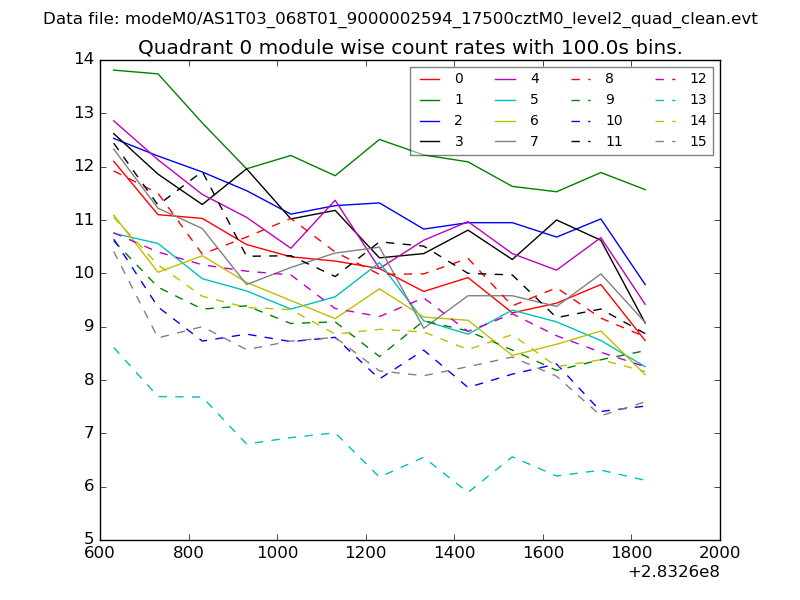 |
 |
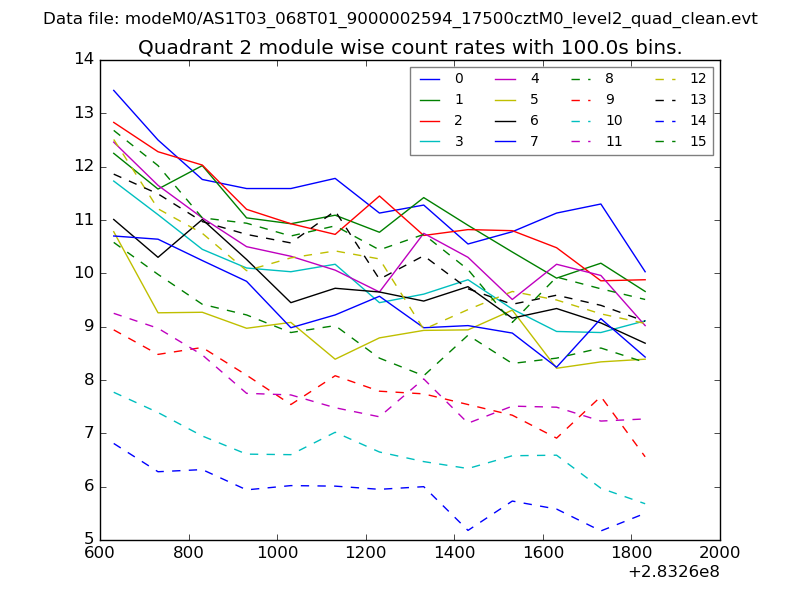
| Module-wise count rates for Quadrant B Data is divided into 100 sec bins |
 |
 |
| Module-wise count rates for Quadrant C Data is divided into 100 sec bins |
 |
 |
| Module-wise count rates for Quadrant D Data is divided into 100 sec bins |
 |
 |
| Parameter | Plot |
|---|---|
| CZT HV Monitor | 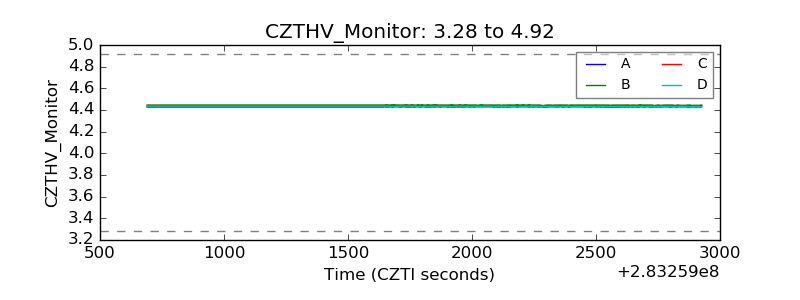 |
| D_VDD | 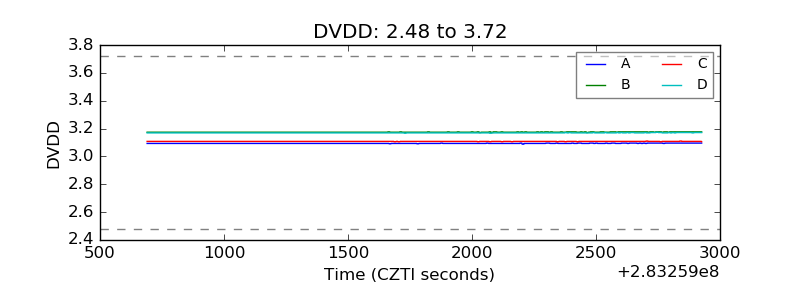 |
| Temperature 1 | 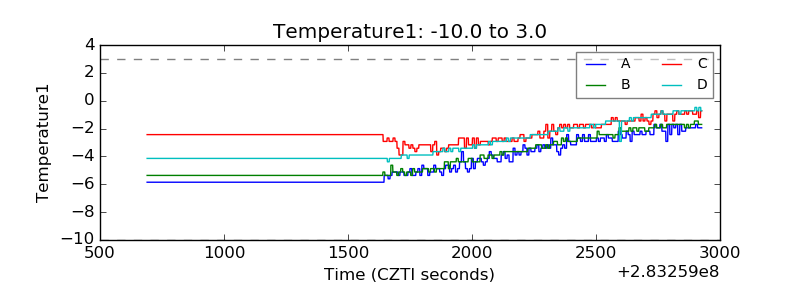 |
| Veto HV Monitor | 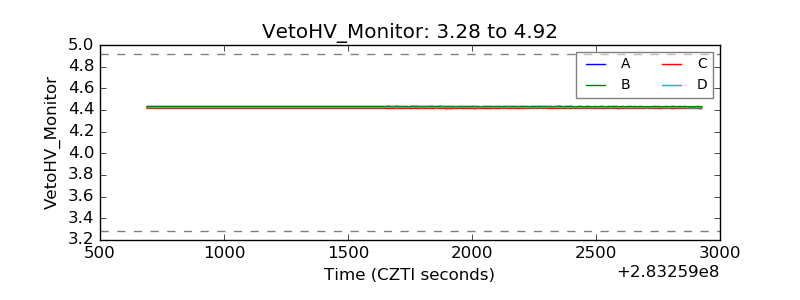 |
| Veto LLD | 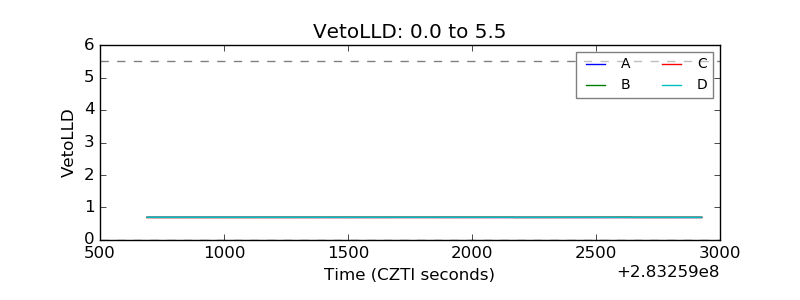 |
| Alpha Counter | 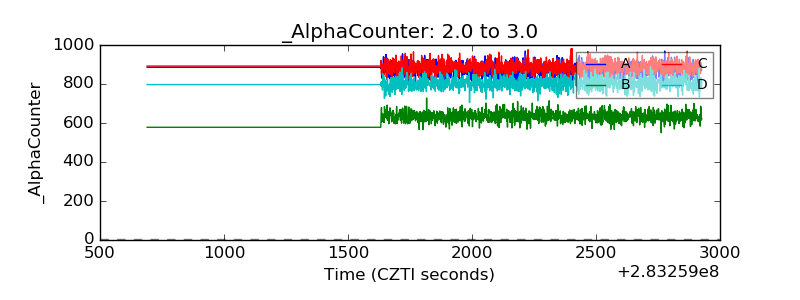 |
| _CPM_Rate | 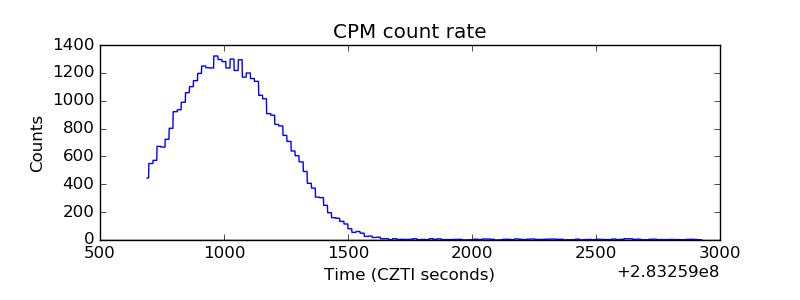 |
| CZT Counter | 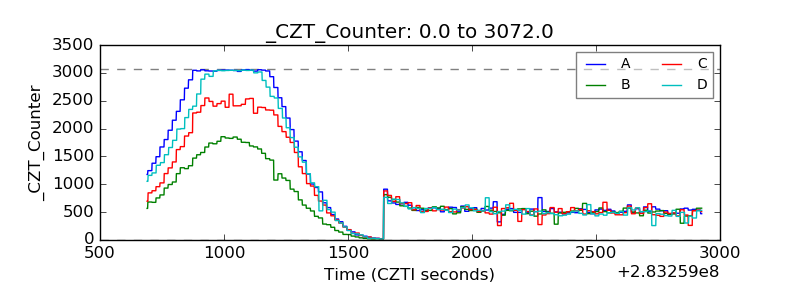 |
| +2.5 Volts monitor |  |
| +5 Volts monitor |  |
| _ROLL_ROT | 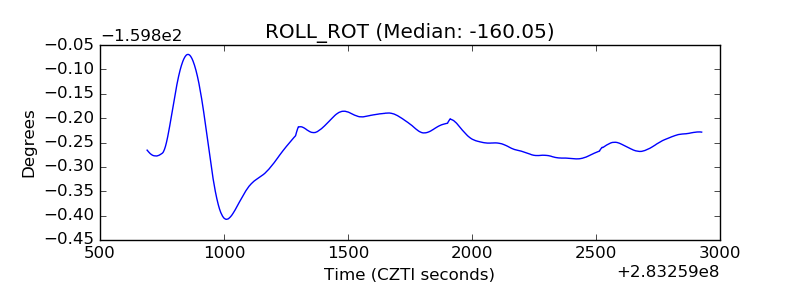 |
| _Roll_DEC | 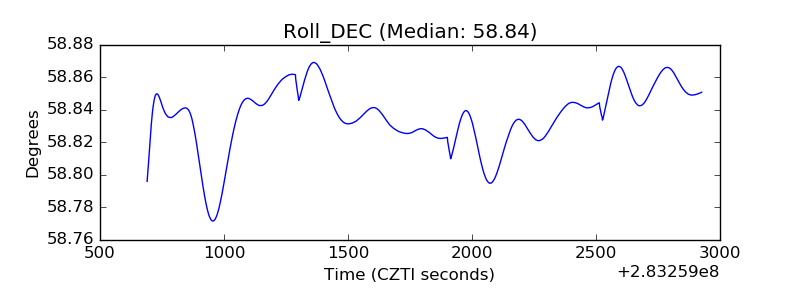 |
| _Roll_RA | 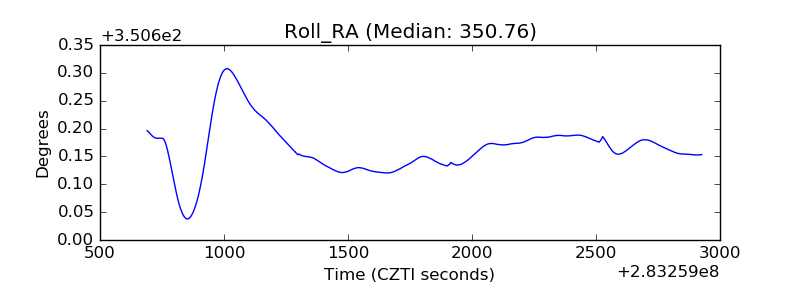 |
| Veto Counter | 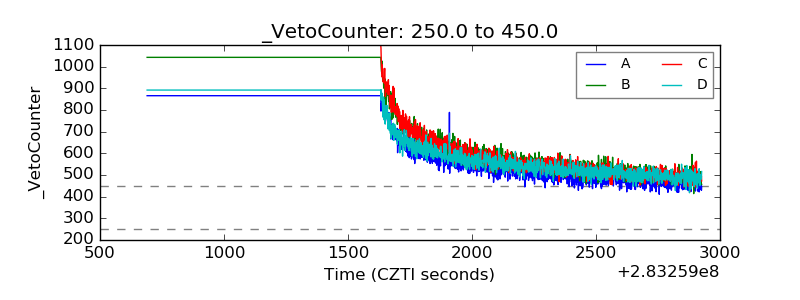 |