| Param | Original file | Final file |
|---|---|---|
| Filename | modeM0/AS1T03_068T01_9000002594_17502cztM0_level2.evt | modeM0/AS1T03_068T01_9000002594_17502cztM0_level2_quad_clean.evt |
| Size (bytes) | 472,656,960 | 104,676,480 |
| Size | 450.8 MB | 99.8 MB |
| Events in quadrant A | 3,501,053 | 687,333 |
| Events in quadrant B | 3,473,149 | 687,558 |
| Events in quadrant C | 3,400,877 | 656,045 |
| Events in quadrant D | 3,467,427 | 655,425 |
| Mode M0 | |||
|---|---|---|---|
| Quadrant | BADHDUFLAG | Total packets | Discarded packets |
| A | 0 | 14973 | 2 |
| B | 0 | 14687 | 2 |
| C | 0 | 14341 | 2 |
| D | 0 | 15017 | 2 |
| Mode SS | |||
|---|---|---|---|
| Quadrant | BADHDUFLAG | Total packets | Discarded packets |
| A | 0 | 140 | 0 |
| B | 0 | 140 | 0 |
| C | 0 | 140 | 0 |
| D | 0 | 140 | 0 |
| Mode M9 | |||
|---|---|---|---|
| Quadrant | BADHDUFLAG | Total packets | Discarded packets |
| A | 0 | 9 | 0 |
| B | 0 | 9 | 0 |
| C | 0 | 9 | 0 |
| D | 0 | 9 | 0 |
| Quadrant | Total seconds | Saturated seconds | Saturation percentage |
|---|---|---|---|
| A | 6947 | 108 | 1.554628% |
| B | 6948 | 112 | 1.611975% |
| C | 6948 | 125 | 1.799079% |
| D | 6948 | 96 | 1.381693% |
Noise dominated data is calculated using 1-second bins in cleaned event files. If a bin has >2000 counts, and if more than 50% of those come from <1% of pixels, then it is considered to be noise-dominated and hence unusable.
| Quadrant | # 1 sec bins | Bins with >0 counts | Bins with >2000 counts | High rate bins dominated by noise | Noise dominated (total time) | Noise dominated (detector-on time) | Marked lightcurve |
|---|---|---|---|---|---|---|---|
| A | 7807 | 6948 | 14 | 14 | 0.18% | 0.20% | 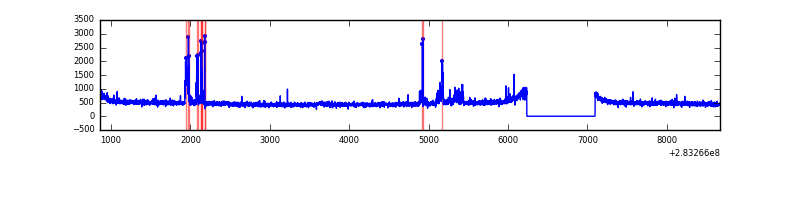 |
| B | 7808 | 6949 | 14 | 14 | 0.18% | 0.20% | 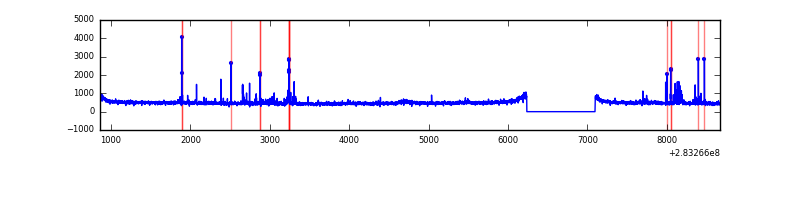 |
| C | 7808 | 6948 | 0 | 0 | 0.00% | 0.00% | 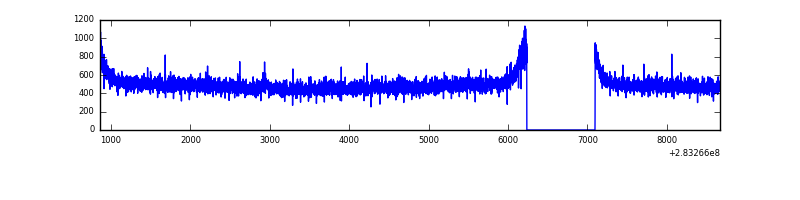 |
| D | 7808 | 6949 | 11 | 11 | 0.14% | 0.16% | 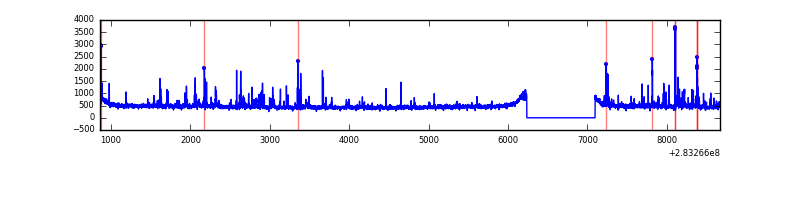 |
Top three noisy pixels from each quadrant. If the there are fewer than three noisy pixels in the level2.evt file, extra rows are filled as -1
| Pixel properties | Quadrant properties | ||||||
|---|---|---|---|---|---|---|---|
| Quadrant | DetID | PixID | Counts | Sigma | Mean | Median | Sigma |
| A | 15 | 174 | 206649 | 1204.34 | 850 | 830 | 170.9 |
| A | 13 | 210 | 16119 | 89.46 | 850 | 830 | 170.9 |
| A | 0 | 226 | 7541 | 39.27 | 850 | 830 | 170.9 |
| B | 7 | 220 | 84892 | 524.33 | 842 | 820 | 160.3 |
| B | 0 | 219 | 32849 | 199.75 | 842 | 820 | 160.3 |
| B | 4 | 216 | 31129 | 189.03 | 842 | 820 | 160.3 |
| C | 14 | 238 | 126528 | 668.3 | 813 | 818 | 188.1 |
| C | 5 | 218 | 60280 | 316.11 | 813 | 818 | 188.1 |
| C | 3 | 233 | 36638 | 190.43 | 813 | 818 | 188.1 |
| D | 13 | 189 | 129284 | 648.6 | 832 | 808 | 198.1 |
| D | 10 | 70 | 89068 | 445.57 | 832 | 808 | 198.1 |
| D | 7 | 238 | 26501 | 129.71 | 832 | 808 | 198.1 |
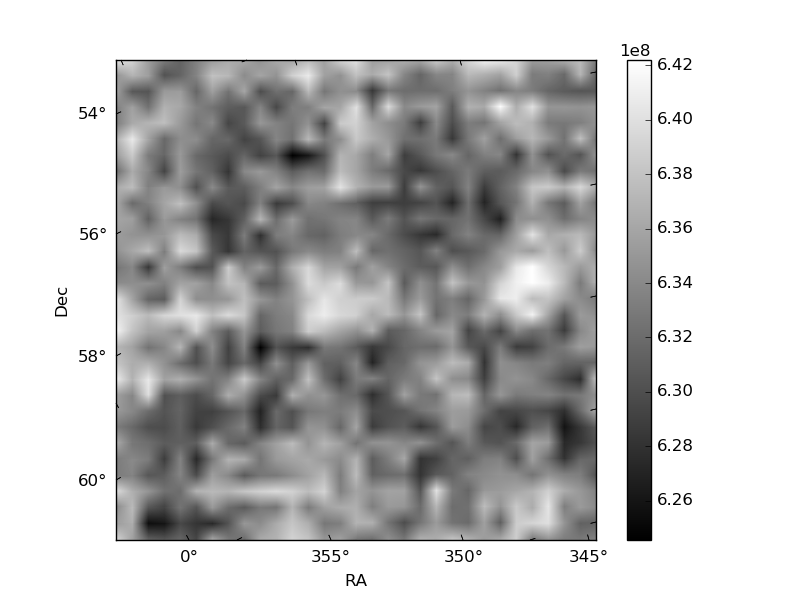
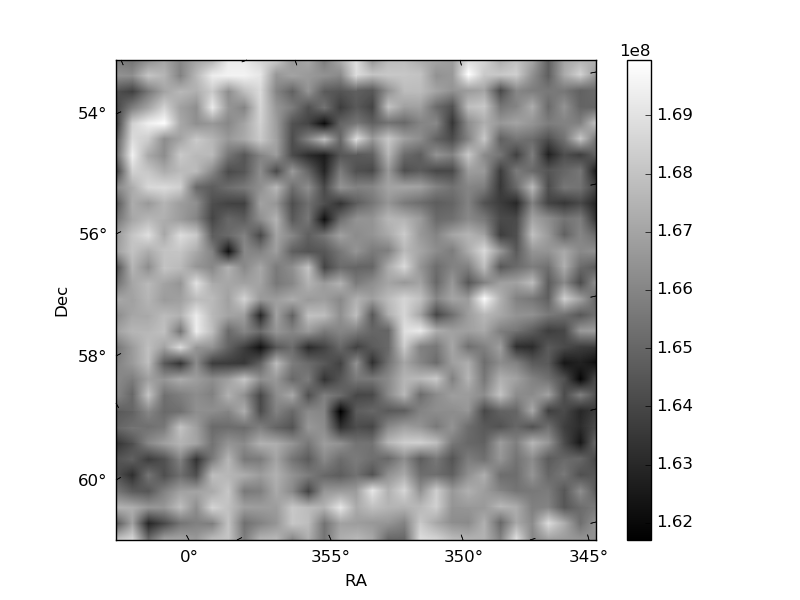
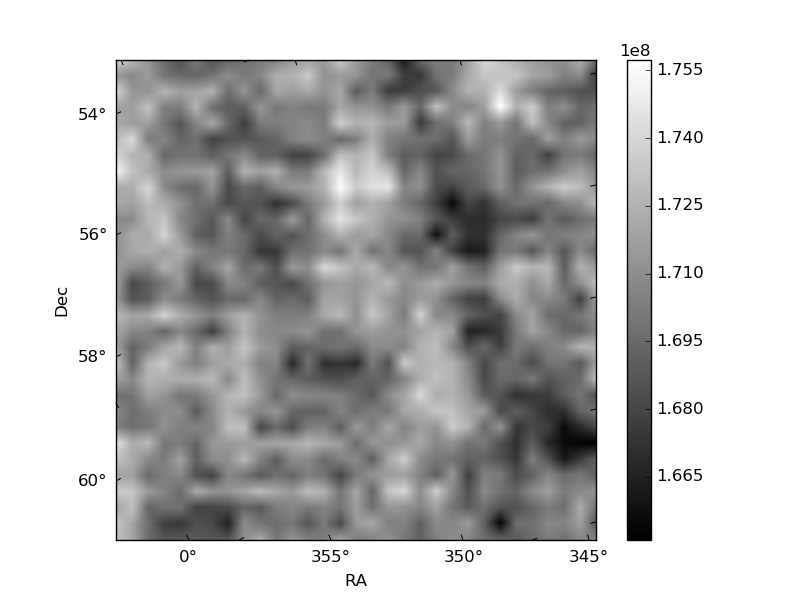
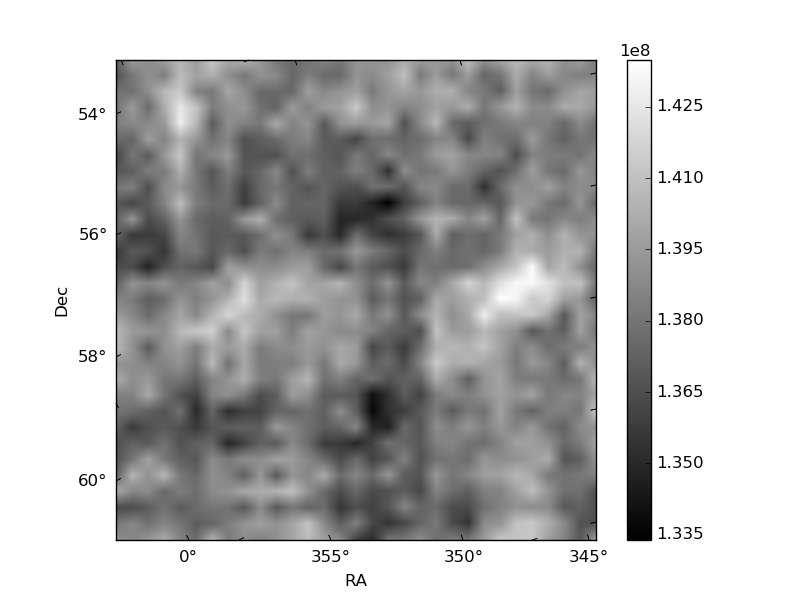
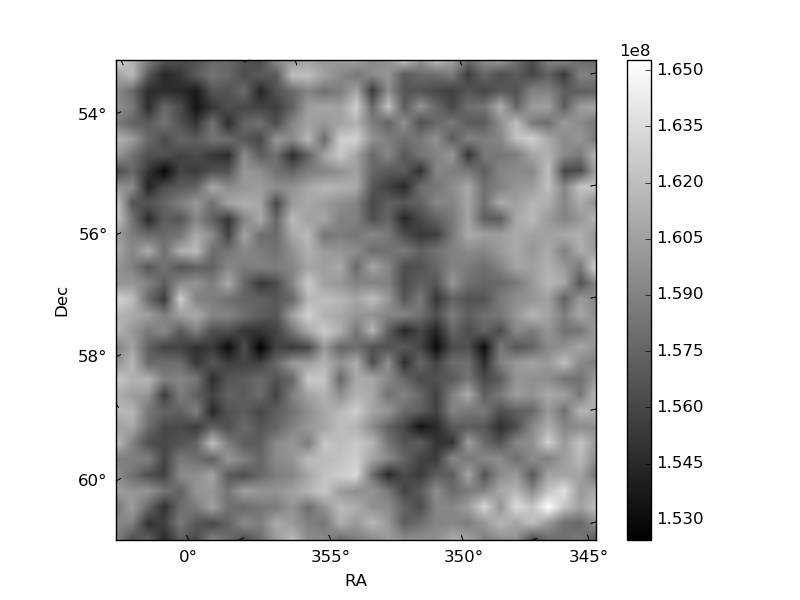
Histogram calculated using DETX and DETY for each event in the final _common_clean file
| Quadrant A | 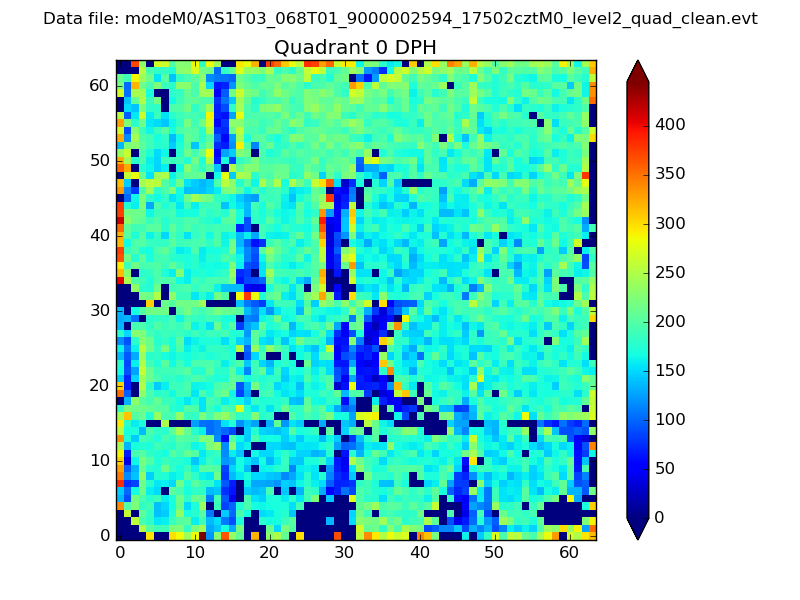 |
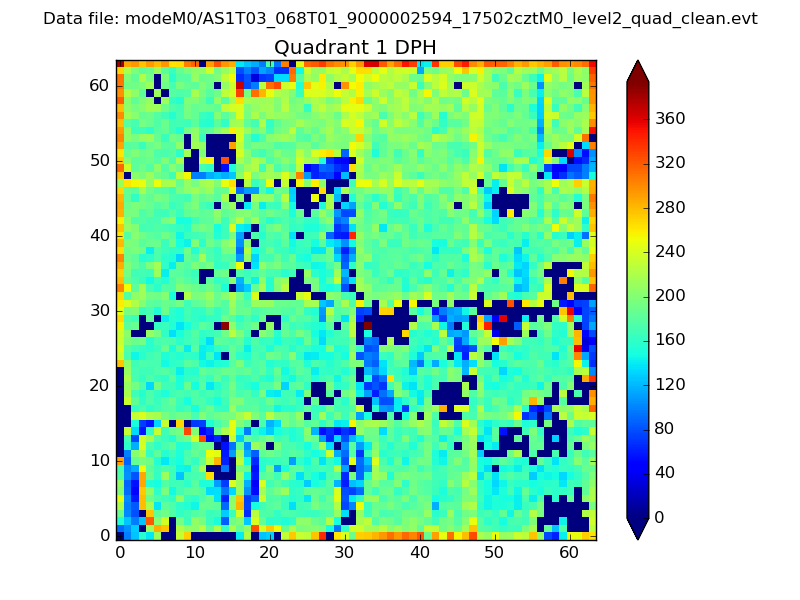 |
Quadrant B |
|---|---|---|---|
| Quadrant D |  |
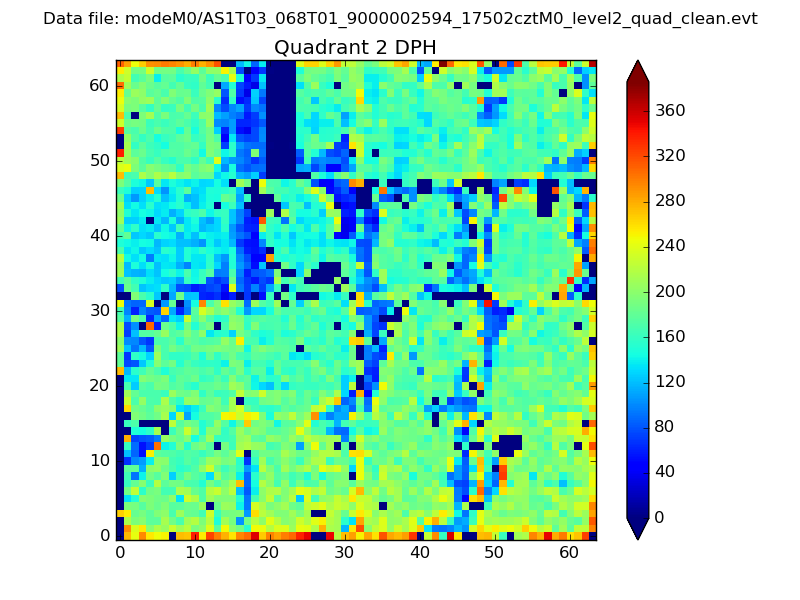 |
Quadrant C |
| Plot type | Count rate plots | Images |
|---|---|---|
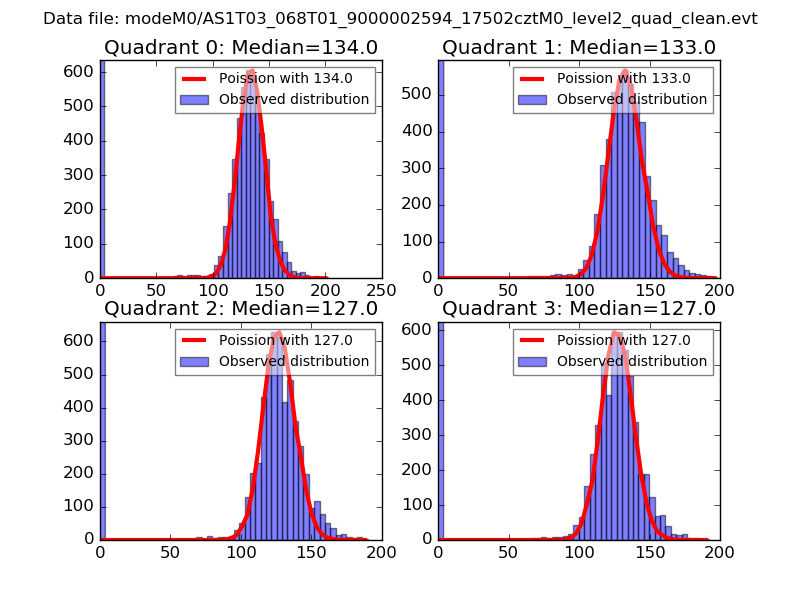
| Comparison with Poisson distribution Blue bars denote a histogram of data divided into 1 sec bins. Red curve is a Poisson curve with rate = median count rate of data. |
 |
 |
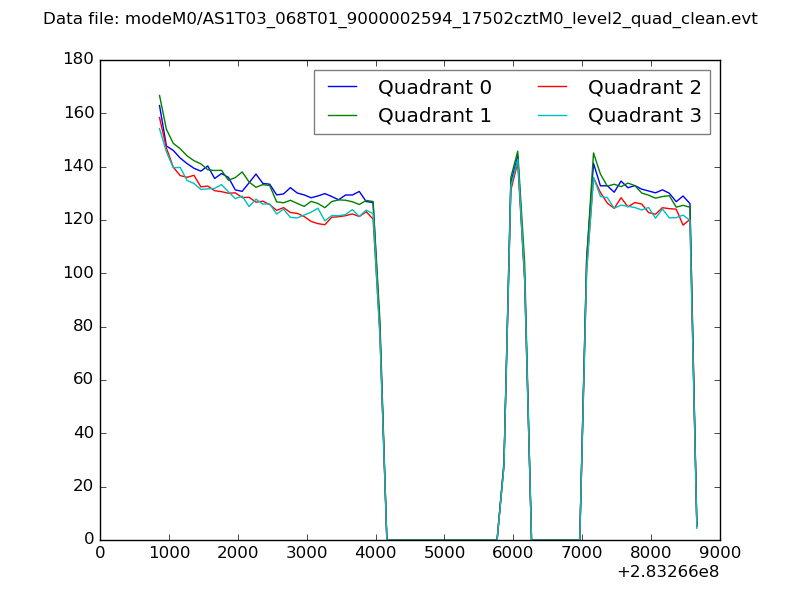
| Quadrant-wise count rates Data is divided into 100 sec bins |
 |
|
| Module-wise count rates for Quadrant A Data is divided into 100 sec bins |
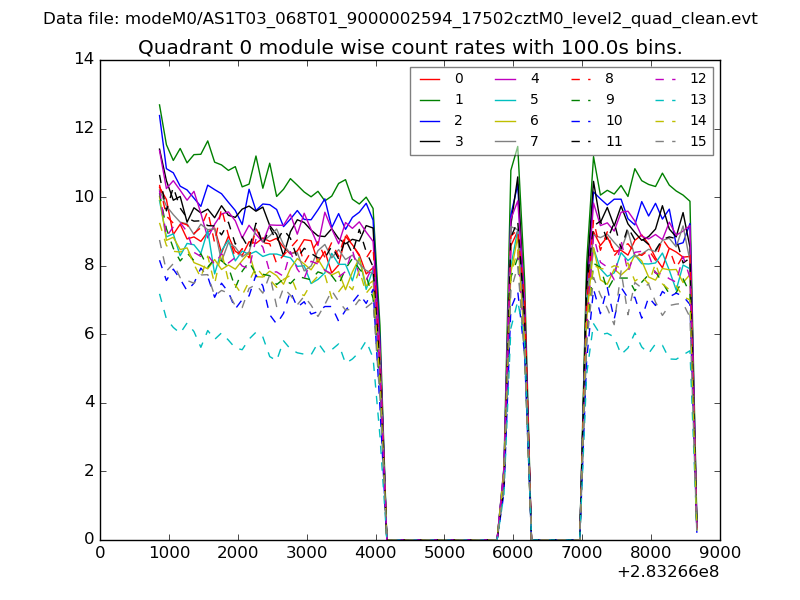 |
 |
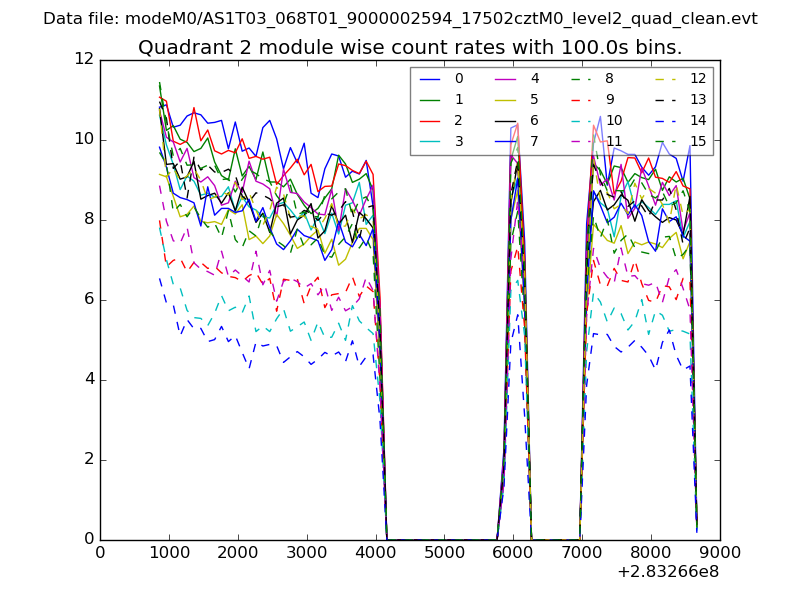
| Module-wise count rates for Quadrant B Data is divided into 100 sec bins |
 |
 |
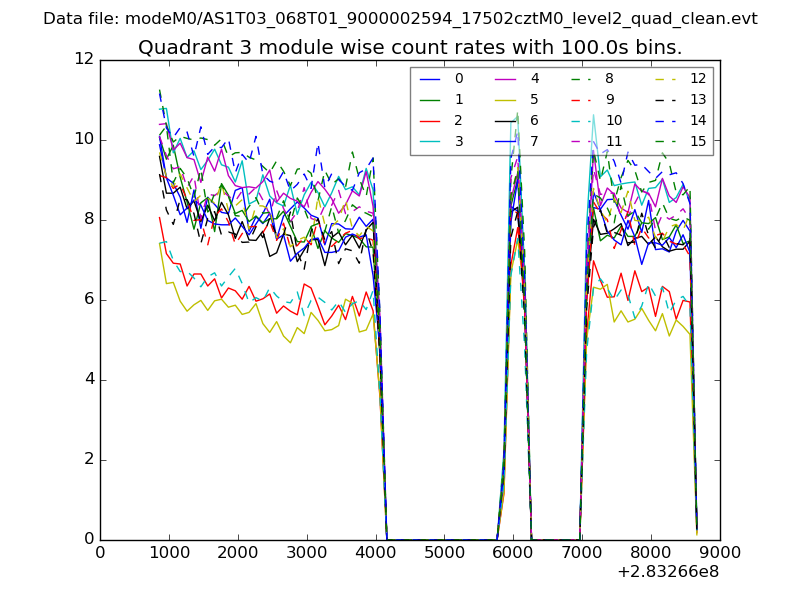
| Module-wise count rates for Quadrant C Data is divided into 100 sec bins |
 |
 |
| Module-wise count rates for Quadrant D Data is divided into 100 sec bins |
 |
 |
| Parameter | Plot |
|---|---|
| CZT HV Monitor |  |
| D_VDD | 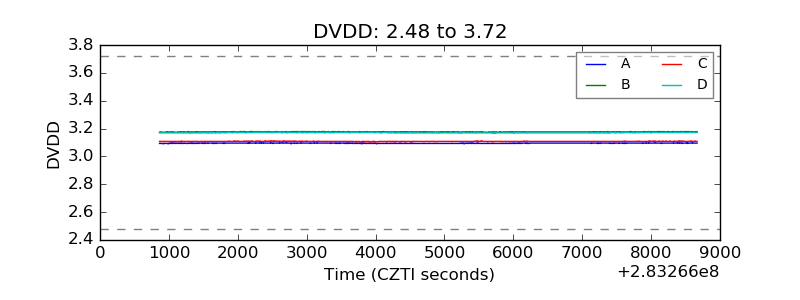 |
| Temperature 1 | 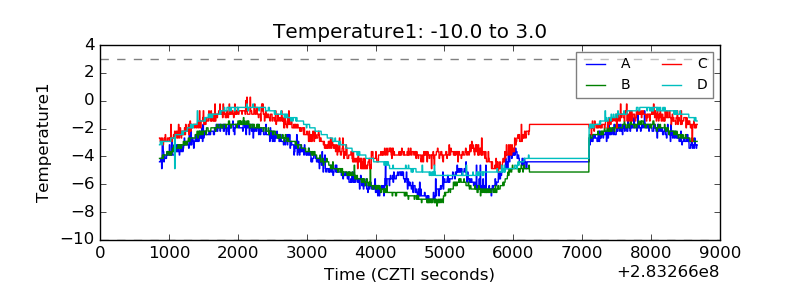 |
| Veto HV Monitor | 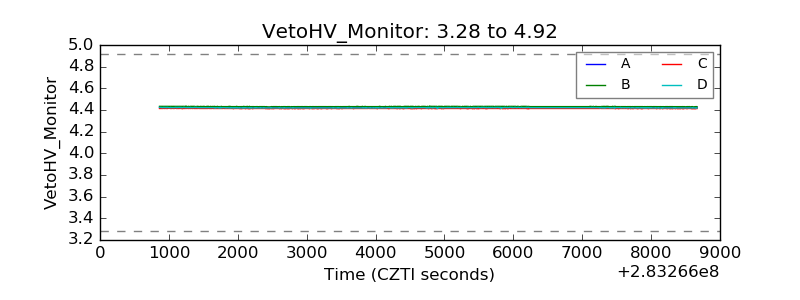 |
| Veto LLD |  |
| Alpha Counter | 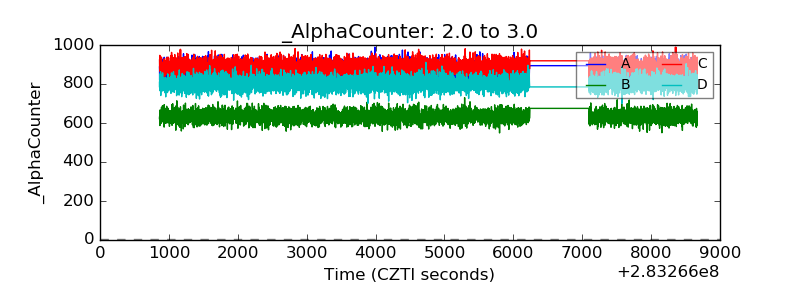 |
| _CPM_Rate | 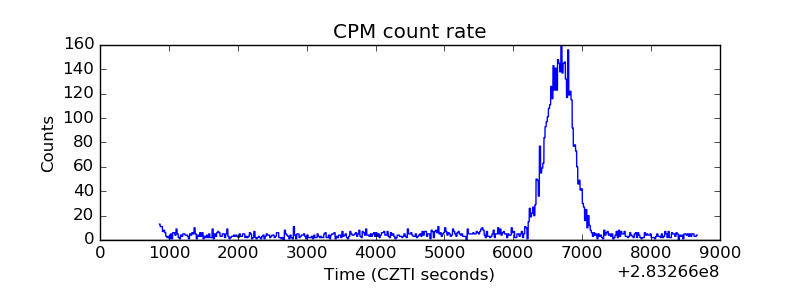 |
| CZT Counter | 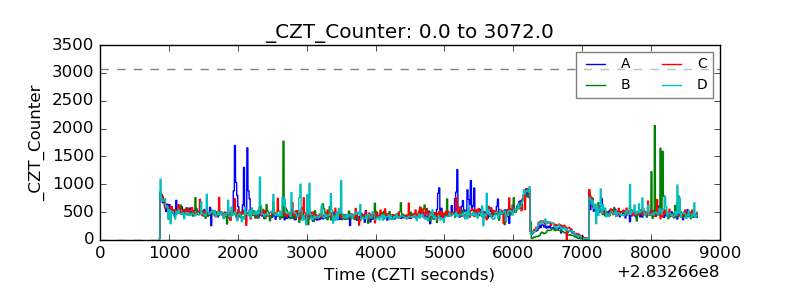 |
| +2.5 Volts monitor |  |
| +5 Volts monitor | 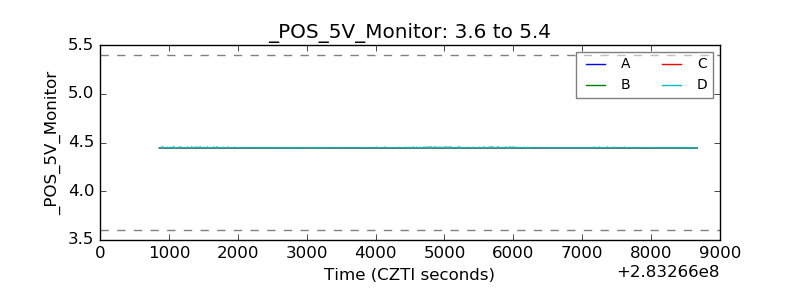 |
| _ROLL_ROT | 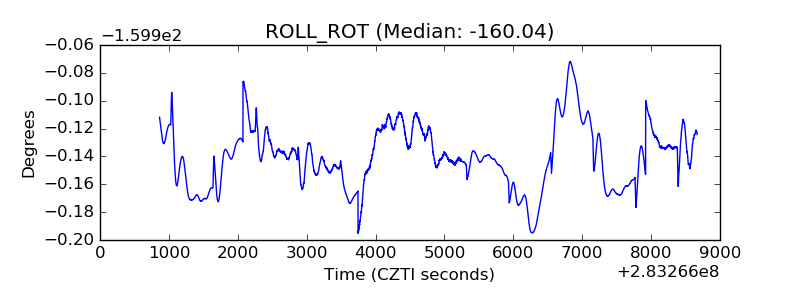 |
| _Roll_DEC |  |
| _Roll_RA | 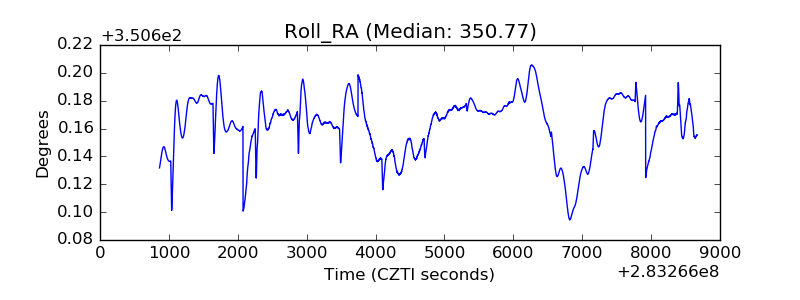 |
| Veto Counter |  |