| Param | Original file | Final file |
|---|---|---|
| Filename | modeM0/AS1T03_068T01_9000002594_17503cztM0_level2.evt | modeM0/AS1T03_068T01_9000002594_17503cztM0_level2_quad_clean.evt |
| Size (bytes) | 246,562,560 | 48,479,040 |
| Size | 235.1 MB | 46.2 MB |
| Events in quadrant A | 1,512,364 | 327,547 |
| Events in quadrant B | 1,562,499 | 328,312 |
| Events in quadrant C | 1,535,372 | 314,783 |
| Events in quadrant D | 2,649,382 | 281,353 |
| Mode M0 | |||
|---|---|---|---|
| Quadrant | BADHDUFLAG | Total packets | Discarded packets |
| A | 0 | 6754 | 349 |
| B | 0 | 6856 | 356 |
| C | 0 | 6785 | 361 |
| D | 0 | 10339 | 418 |
| Mode SS | |||
|---|---|---|---|
| Quadrant | BADHDUFLAG | Total packets | Discarded packets |
| A | 0 | 65 | 3 |
| B | 0 | 64 | 2 |
| C | 0 | 66 | 4 |
| D | 0 | 64 | 2 |
| Mode M9 | |||
|---|---|---|---|
| Quadrant | BADHDUFLAG | Total packets | Discarded packets |
| A | 0 | 5 | 0 |
| B | 0 | 5 | 0 |
| C | 0 | 5 | 0 |
| D | 0 | 5 | 0 |
| Quadrant | Total seconds | Saturated seconds | Saturation percentage |
|---|---|---|---|
| A | 3035 | 60 | 1.976936% |
| B | 3028 | 79 | 2.608983% |
| C | 3031 | 91 | 3.002309% |
| D | 3017 | 555 | 18.395757% |
Noise dominated data is calculated using 1-second bins in cleaned event files. If a bin has >2000 counts, and if more than 50% of those come from <1% of pixels, then it is considered to be noise-dominated and hence unusable.
| Quadrant | # 1 sec bins | Bins with >0 counts | Bins with >2000 counts | High rate bins dominated by noise | Noise dominated (total time) | Noise dominated (detector-on time) | Marked lightcurve |
|---|---|---|---|---|---|---|---|
| A | 4037 | 3059 | 0 | 0 | 0.00% | 0.00% | 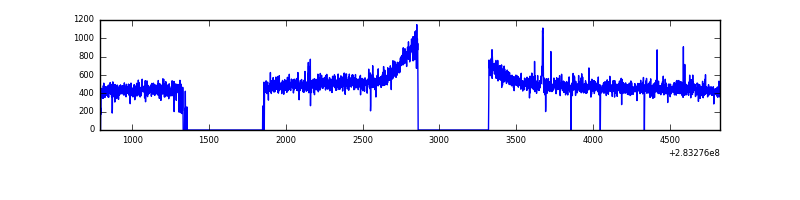 |
| B | 4035 | 3055 | 0 | 0 | 0.00% | 0.00% | 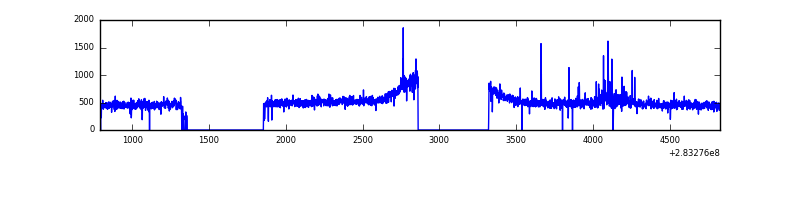 |
| C | 4031 | 3056 | 0 | 0 | 0.00% | 0.00% |  |
| D | 4034 | 3047 | 384 | 384 | 9.52% | 12.60% | 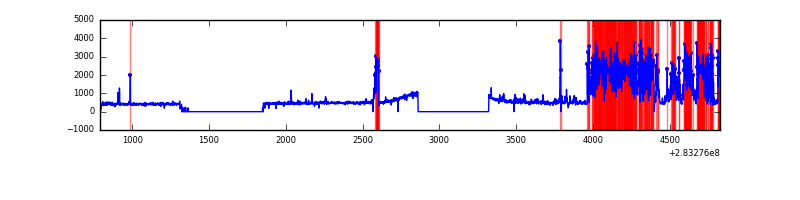 |
Top three noisy pixels from each quadrant. If the there are fewer than three noisy pixels in the level2.evt file, extra rows are filled as -1
| Pixel properties | Quadrant properties | ||||||
|---|---|---|---|---|---|---|---|
| Quadrant | DetID | PixID | Counts | Sigma | Mean | Median | Sigma |
| A | 4 | 2 | 5578 | 64.81 | 389 | 380 | 80.2 |
| A | 15 | 174 | 5336 | 61.79 | 389 | 380 | 80.2 |
| A | 0 | 226 | 3389 | 37.52 | 389 | 380 | 80.2 |
| B | 7 | 220 | 28317 | 366.72 | 384 | 375 | 76.2 |
| B | 3 | 64 | 11156 | 141.49 | 384 | 375 | 76.2 |
| B | 12 | 111 | 8938 | 112.38 | 384 | 375 | 76.2 |
| C | 14 | 238 | 56623 | 638.99 | 368 | 370 | 88.0 |
| C | 5 | 218 | 27060 | 303.18 | 368 | 370 | 88.0 |
| C | 3 | 233 | 11726 | 129.0 | 368 | 370 | 88.0 |
| D | 10 | 70 | 1191124 | 13742.26 | 354 | 343 | 86.7 |
| D | 13 | 189 | 95837 | 1102.05 | 354 | 343 | 86.7 |
| D | 2 | 234 | 11587 | 129.76 | 354 | 343 | 86.7 |
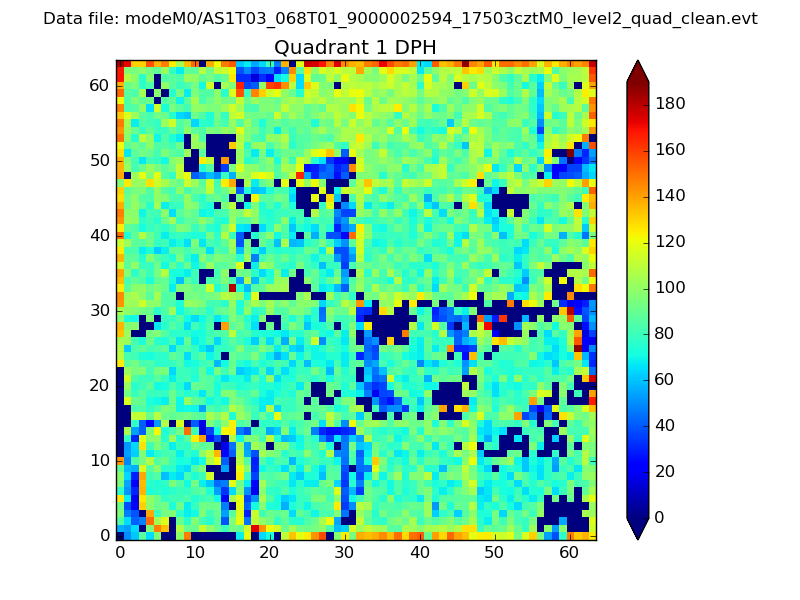
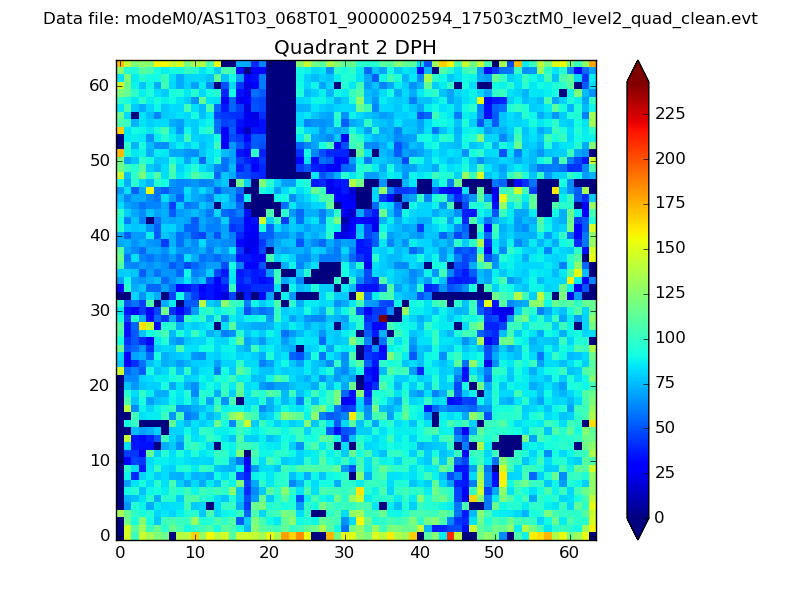
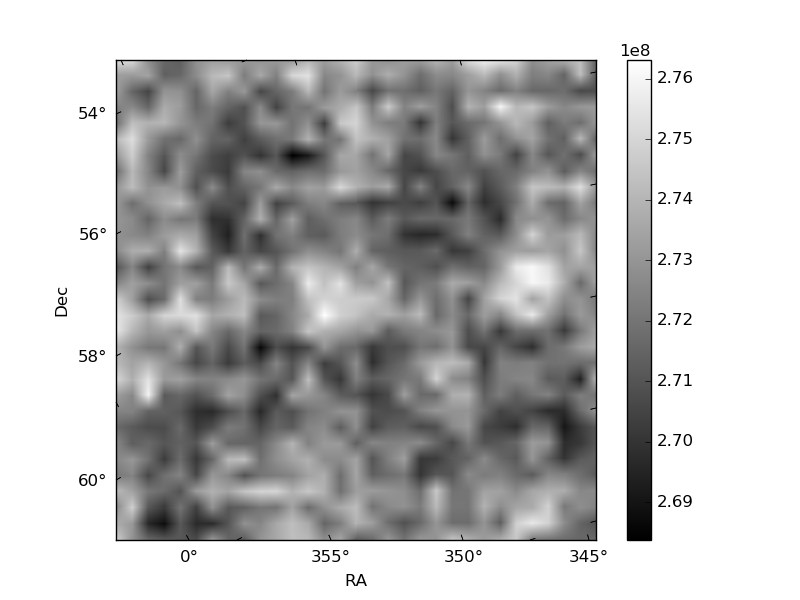
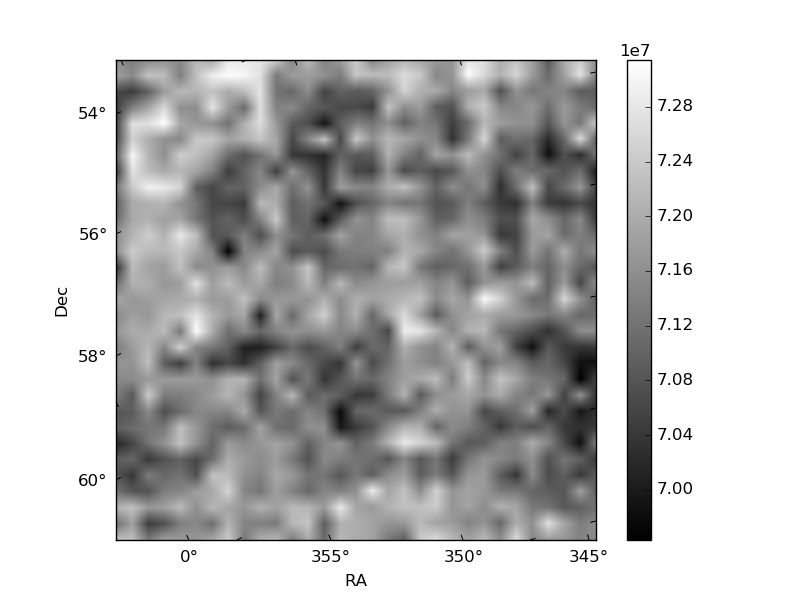
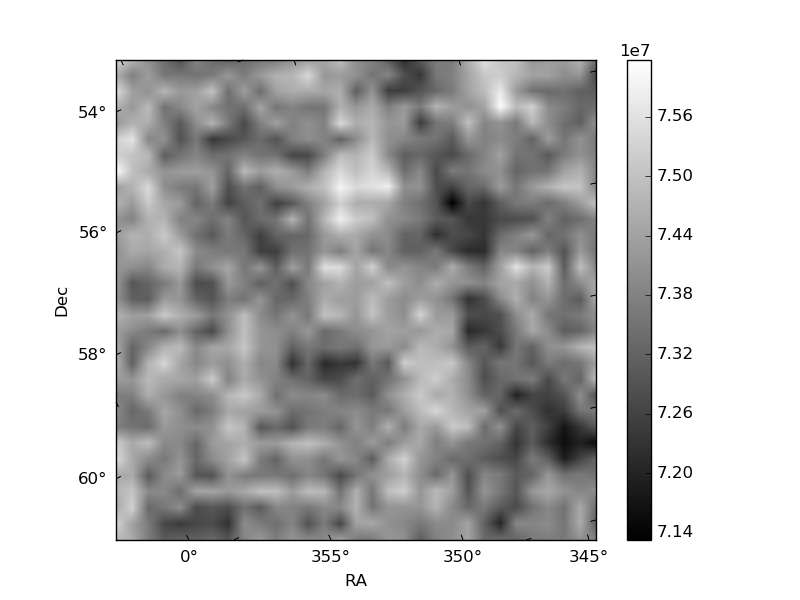
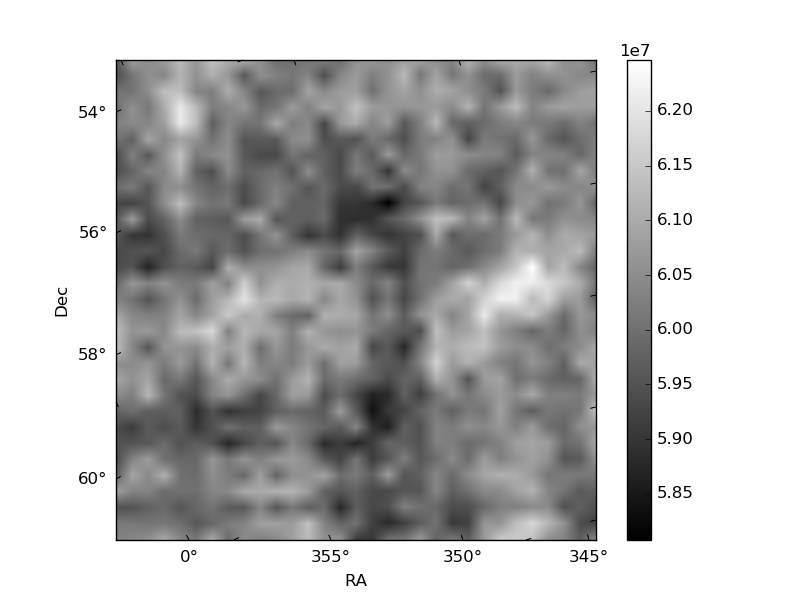
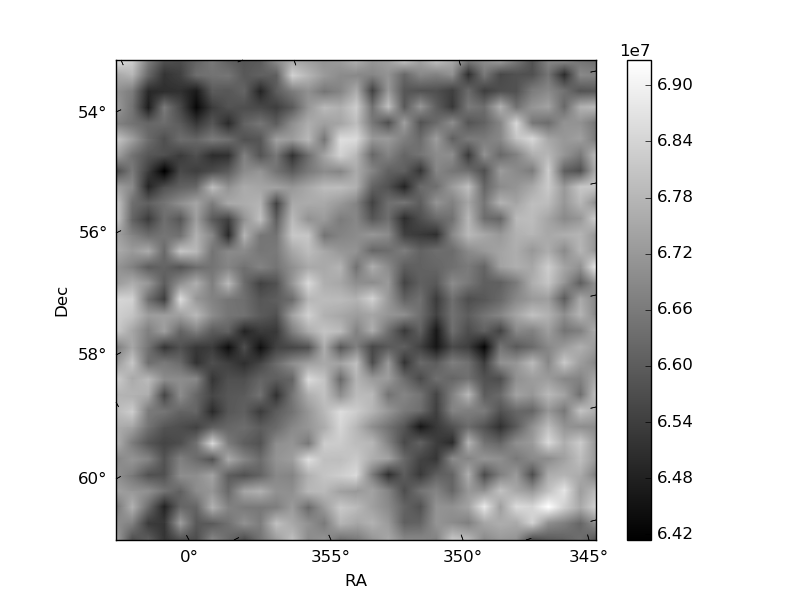
Histogram calculated using DETX and DETY for each event in the final _common_clean file
| Quadrant A | 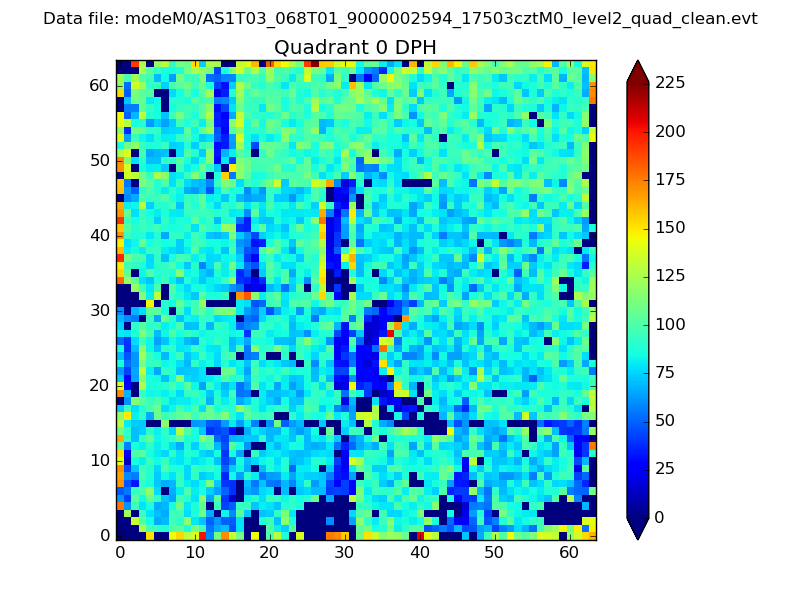 |
 |
Quadrant B |
|---|---|---|---|
| Quadrant D | 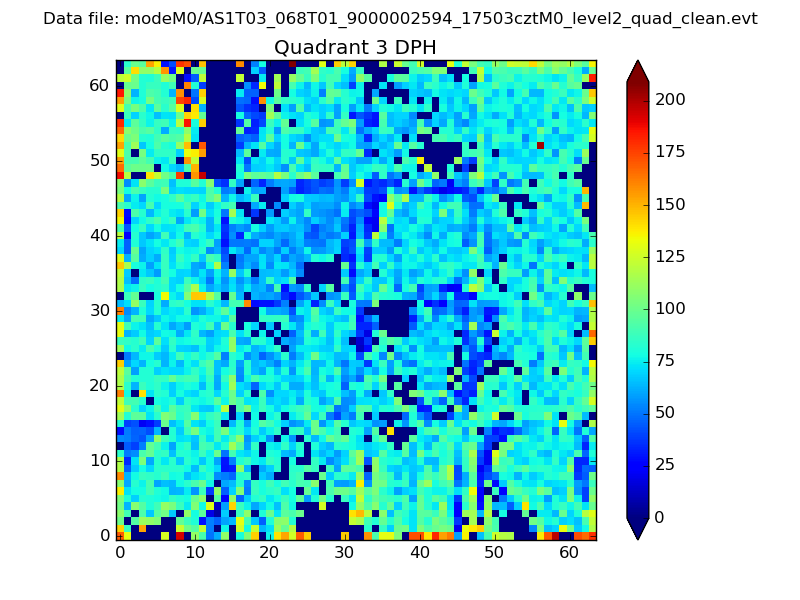 |
 |
Quadrant C |
| Plot type | Count rate plots | Images |
|---|---|---|
| Comparison with Poisson distribution Blue bars denote a histogram of data divided into 1 sec bins. Red curve is a Poisson curve with rate = median count rate of data. |
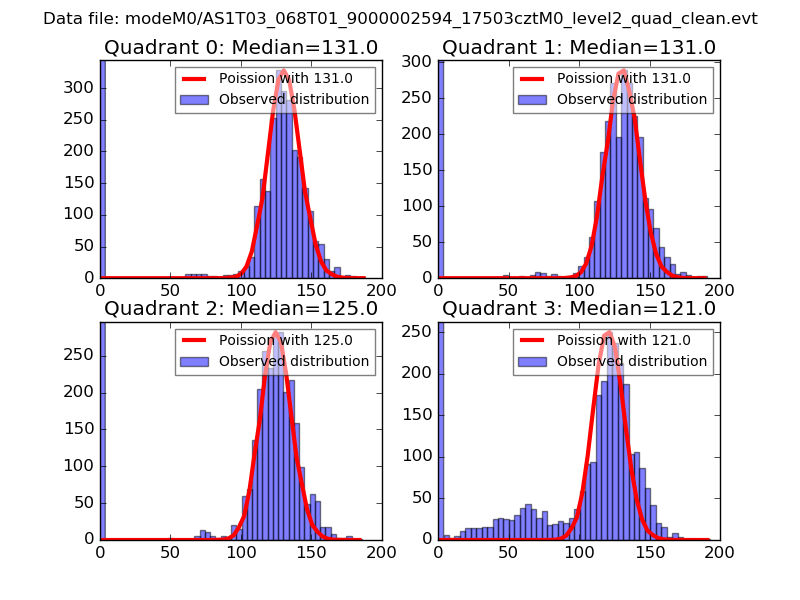 |
 |
| Quadrant-wise count rates Data is divided into 100 sec bins |
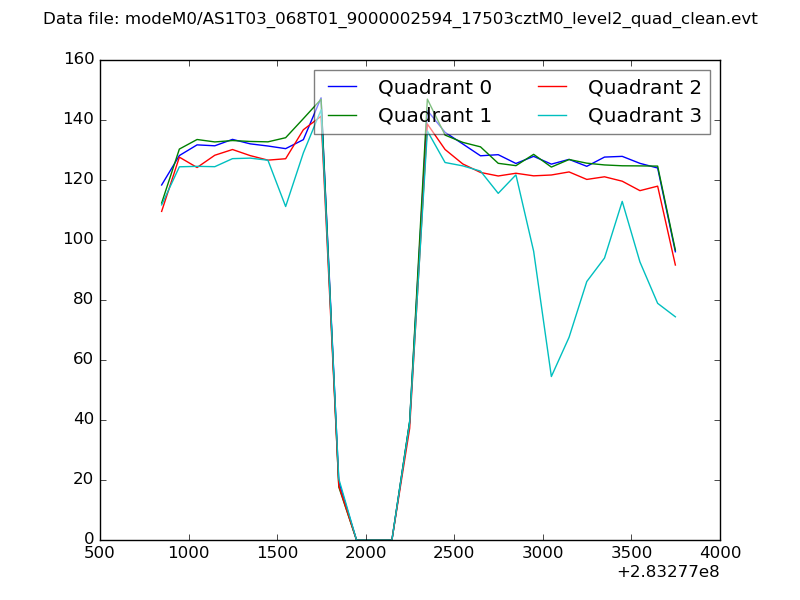 |
|
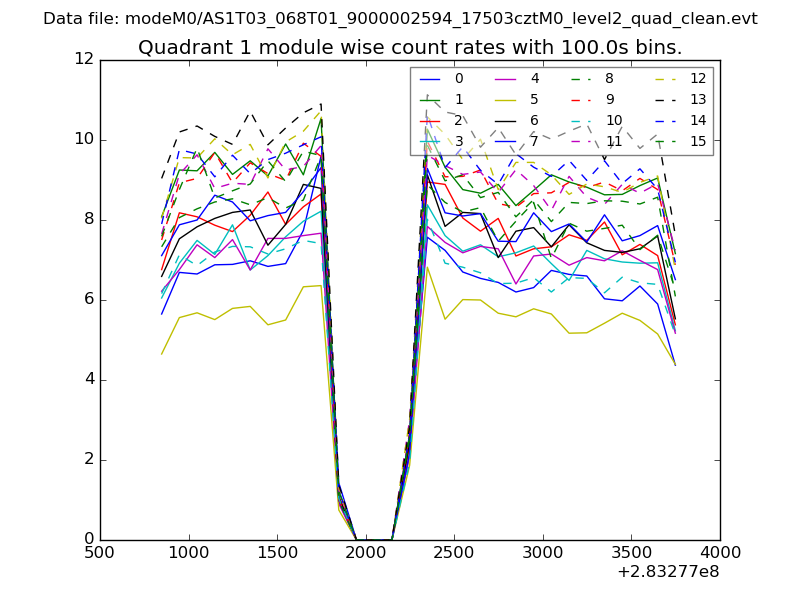
| Module-wise count rates for Quadrant A Data is divided into 100 sec bins |
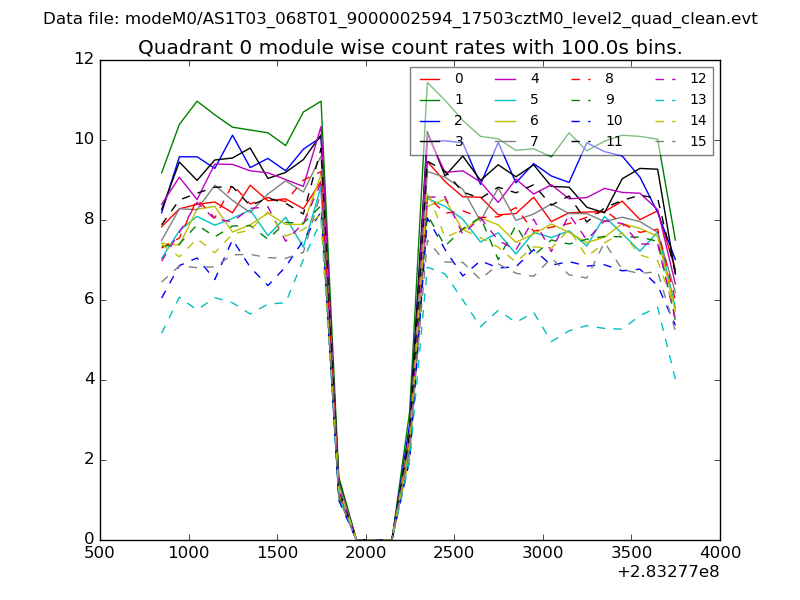 |
 |
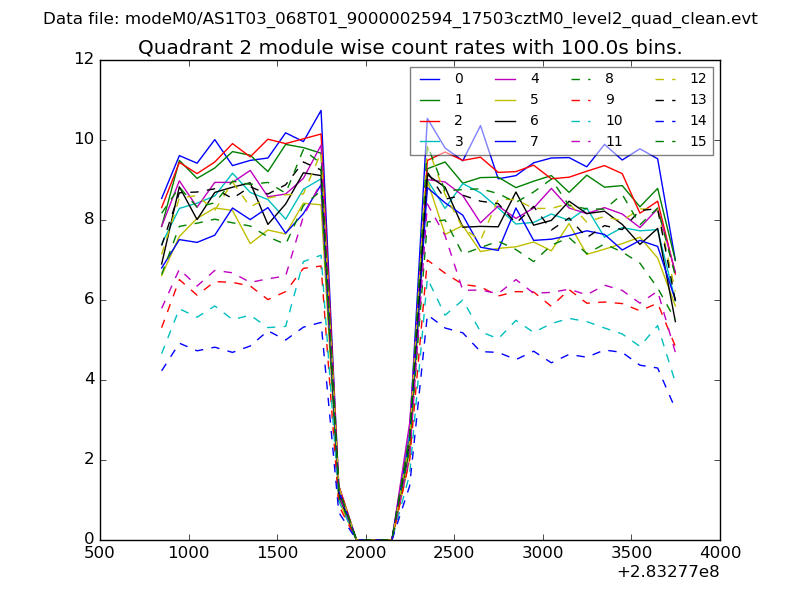
| Module-wise count rates for Quadrant B Data is divided into 100 sec bins |
 |
 |
| Module-wise count rates for Quadrant C Data is divided into 100 sec bins |
 |
 |
| Module-wise count rates for Quadrant D Data is divided into 100 sec bins |
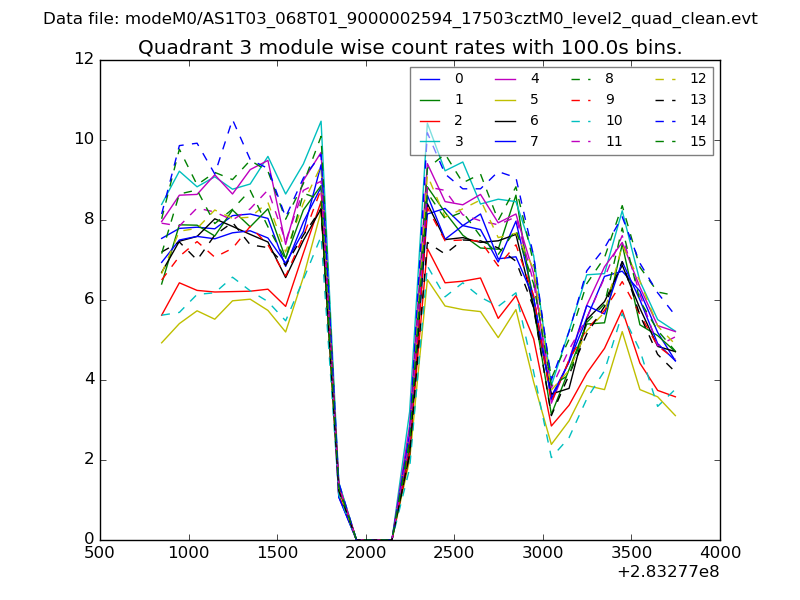 |
 |
| Parameter | Plot |
|---|---|
| CZT HV Monitor | 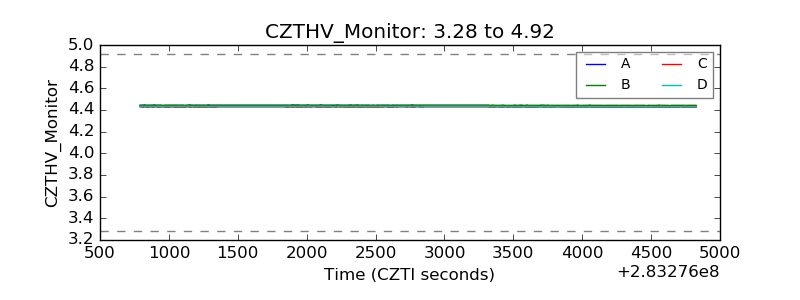 |
| D_VDD | 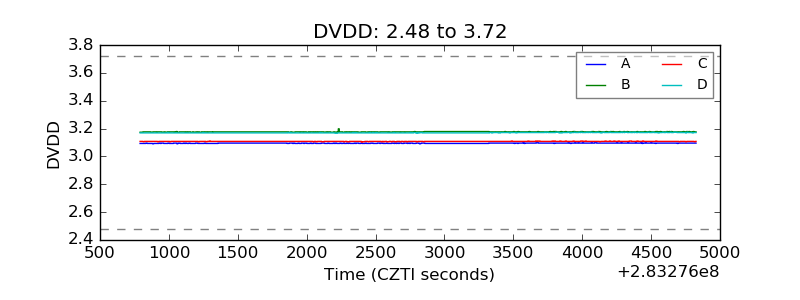 |
| Temperature 1 | 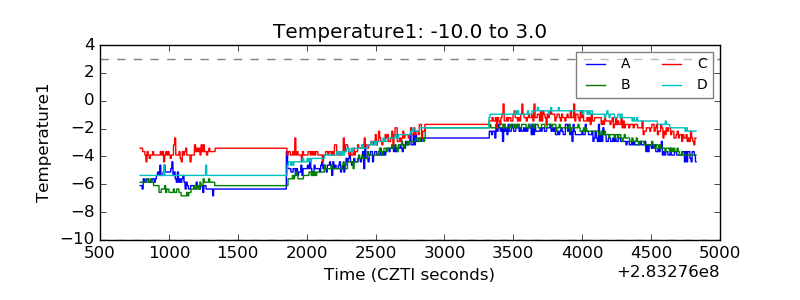 |
| Veto HV Monitor | 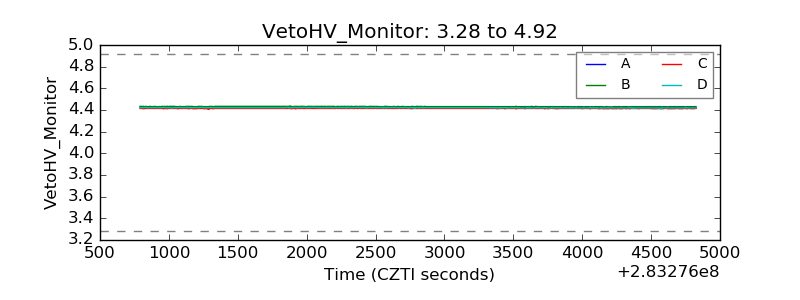 |
| Veto LLD | 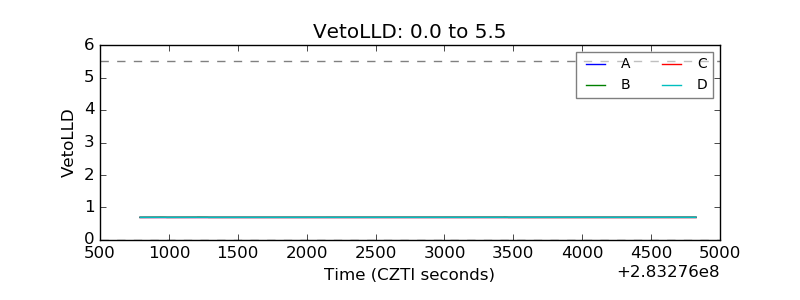 |
| Alpha Counter | 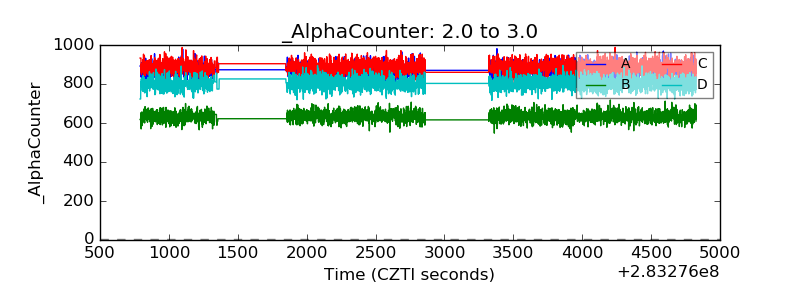 |
| _CPM_Rate | 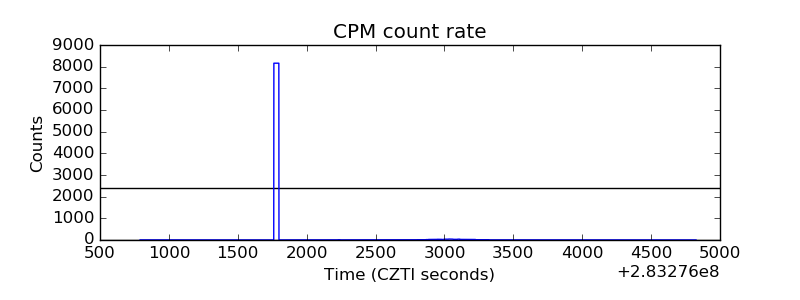 |
| CZT Counter | 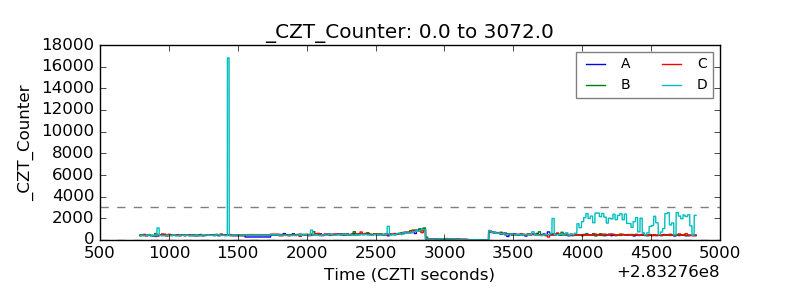 |
| +2.5 Volts monitor | 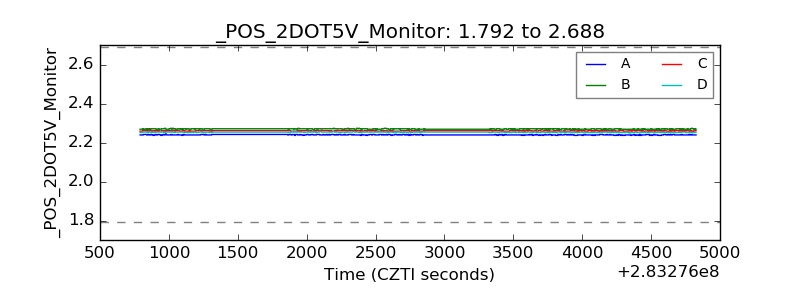 |
| +5 Volts monitor |  |
| _ROLL_ROT | 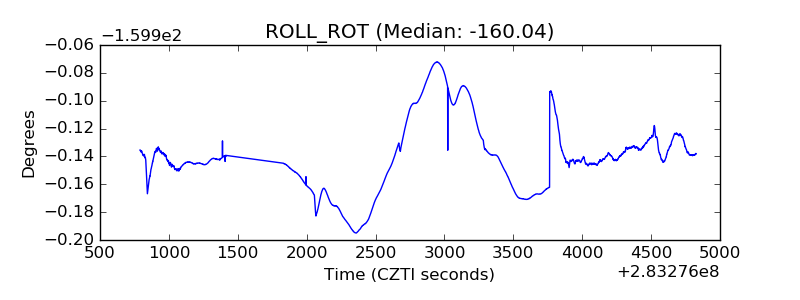 |
| _Roll_DEC | 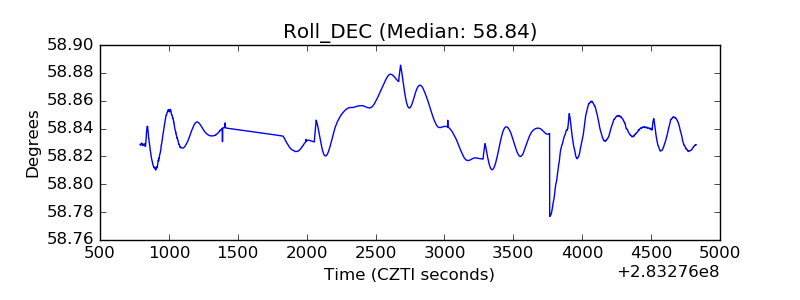 |
| _Roll_RA | 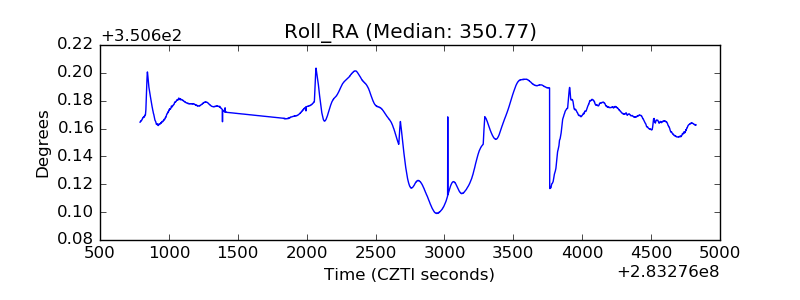 |
| Veto Counter | 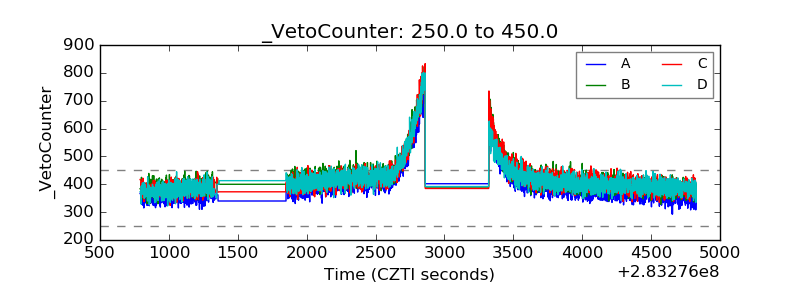 |