| Param | Original file | Final file |
|---|---|---|
| Filename | modeM0/AS1T03_068T01_9000002594_17505cztM0_level2.evt | modeM0/AS1T03_068T01_9000002594_17505cztM0_level2_quad_clean.evt |
| Size (bytes) | 533,695,680 | 118,235,520 |
| Size | 509.0 MB | 112.8 MB |
| Events in quadrant A | 3,692,487 | 773,605 |
| Events in quadrant B | 3,793,854 | 778,345 |
| Events in quadrant C | 3,862,823 | 743,087 |
| Events in quadrant D | 4,275,663 | 734,870 |
| Mode M0 | |||
|---|---|---|---|
| Quadrant | BADHDUFLAG | Total packets | Discarded packets |
| A | 0 | 16489 | 2 |
| B | 0 | 16515 | 2 |
| C | 0 | 16486 | 2 |
| D | 0 | 18343 | 2 |
| Mode SS | |||
|---|---|---|---|
| Quadrant | BADHDUFLAG | Total packets | Discarded packets |
| A | 0 | 164 | 0 |
| B | 0 | 164 | 0 |
| C | 0 | 164 | 0 |
| D | 0 | 164 | 0 |
| Mode M9 | |||
|---|---|---|---|
| Quadrant | BADHDUFLAG | Total packets | Discarded packets |
| A | 0 | 5 | 0 |
| B | 0 | 5 | 0 |
| C | 0 | 5 | 0 |
| D | 0 | 5 | 0 |
| Quadrant | Total seconds | Saturated seconds | Saturation percentage |
|---|---|---|---|
| A | 7921 | 55 | 0.694357% |
| B | 7921 | 72 | 0.908976% |
| C | 7920 | 104 | 1.313131% |
| D | 7921 | 141 | 1.780078% |
Noise dominated data is calculated using 1-second bins in cleaned event files. If a bin has >2000 counts, and if more than 50% of those come from <1% of pixels, then it is considered to be noise-dominated and hence unusable.
| Quadrant | # 1 sec bins | Bins with >0 counts | Bins with >2000 counts | High rate bins dominated by noise | Noise dominated (total time) | Noise dominated (detector-on time) | Marked lightcurve |
|---|---|---|---|---|---|---|---|
| A | 8496 | 7923 | 11 | 11 | 0.13% | 0.14% | 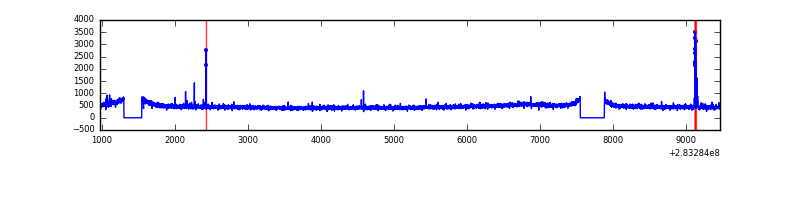 |
| B | 8496 | 7923 | 4 | 4 | 0.05% | 0.05% | 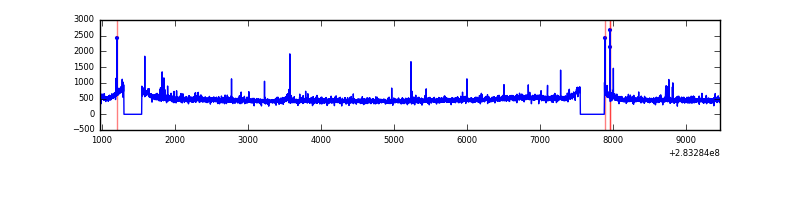 |
| C | 8495 | 7922 | 1 | 1 | 0.01% | 0.01% | 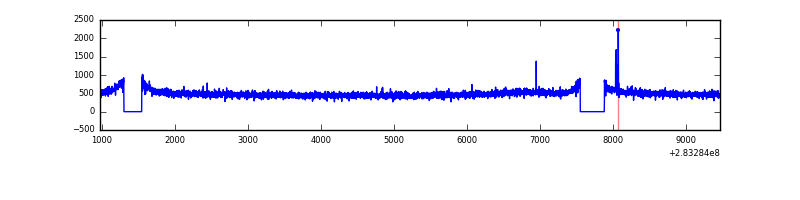 |
| D | 8496 | 7923 | 81 | 81 | 0.95% | 1.02% | 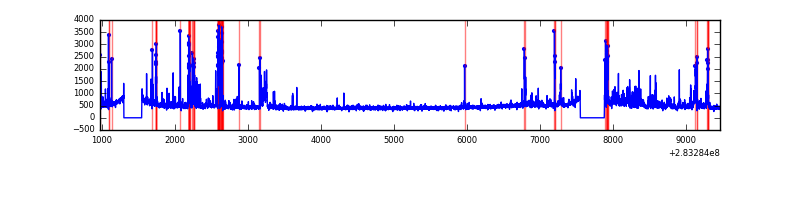 |
Top three noisy pixels from each quadrant. If the there are fewer than three noisy pixels in the level2.evt file, extra rows are filled as -1
| Pixel properties | Quadrant properties | ||||||
|---|---|---|---|---|---|---|---|
| Quadrant | DetID | PixID | Counts | Sigma | Mean | Median | Sigma |
| A | 13 | 210 | 35604 | 180.87 | 945 | 923 | 191.7 |
| A | 15 | 174 | 11910 | 57.3 | 945 | 923 | 191.7 |
| A | 4 | 2 | 10821 | 51.62 | 945 | 923 | 191.7 |
| B | 12 | 111 | 21027 | 111.45 | 942 | 915 | 180.5 |
| B | 7 | 220 | 21023 | 111.43 | 942 | 915 | 180.5 |
| B | 0 | 230 | 19277 | 101.75 | 942 | 915 | 180.5 |
| C | 14 | 238 | 138984 | 643.65 | 911 | 916 | 214.5 |
| C | 3 | 233 | 87708 | 404.61 | 911 | 916 | 214.5 |
| C | 5 | 218 | 63495 | 291.73 | 911 | 916 | 214.5 |
| D | 13 | 189 | 379627 | 1699.59 | 924 | 898 | 222.8 |
| D | 11 | 176 | 242274 | 1083.2 | 924 | 898 | 222.8 |
| D | 10 | 70 | 56569 | 249.83 | 924 | 898 | 222.8 |
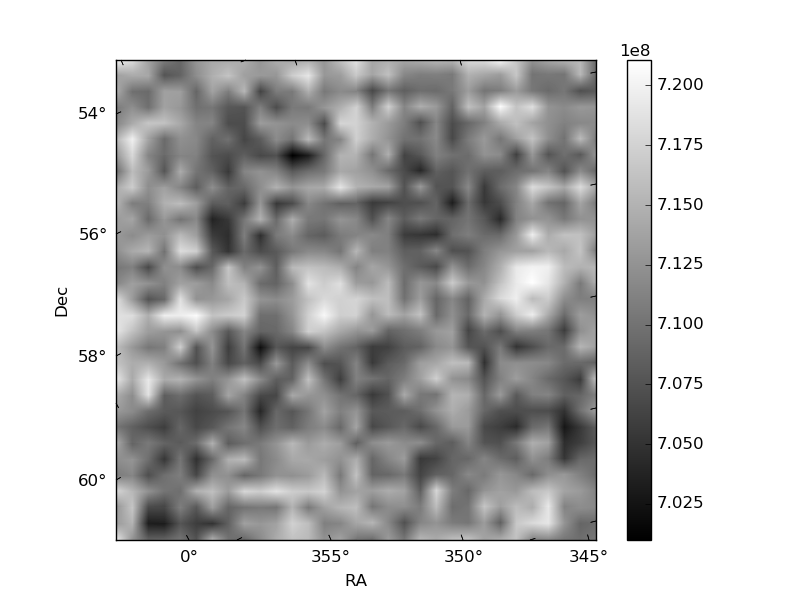
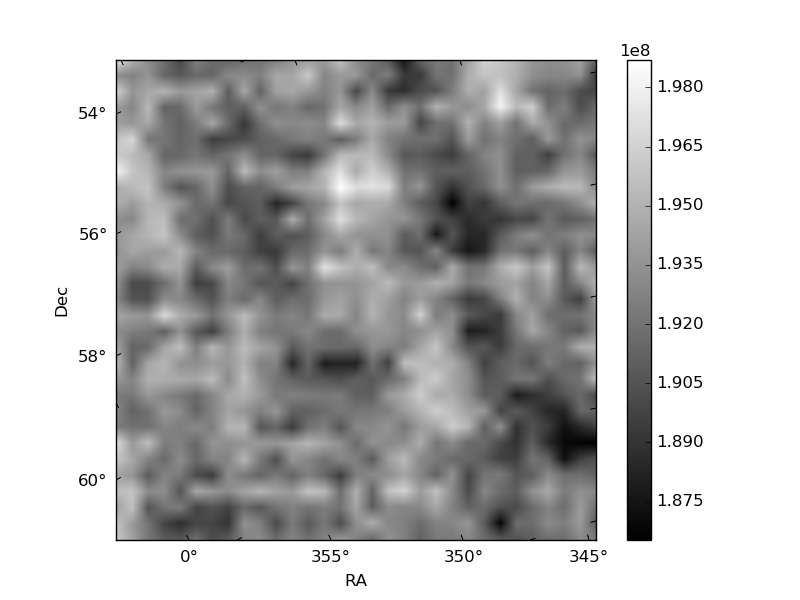
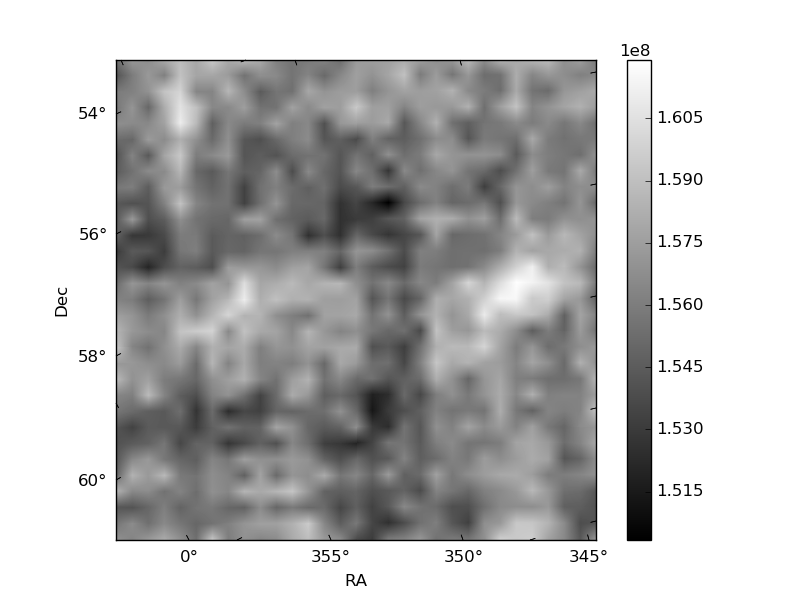
Histogram calculated using DETX and DETY for each event in the final _common_clean file
| Quadrant A | 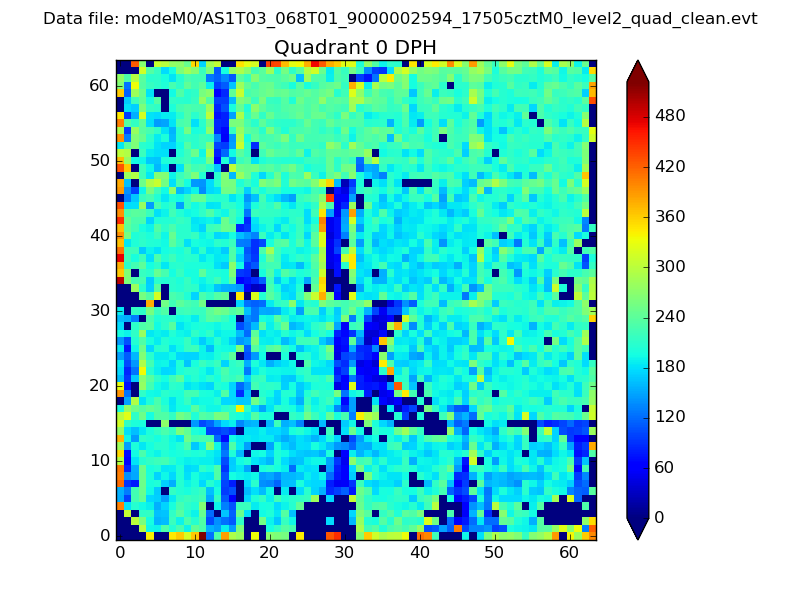 |
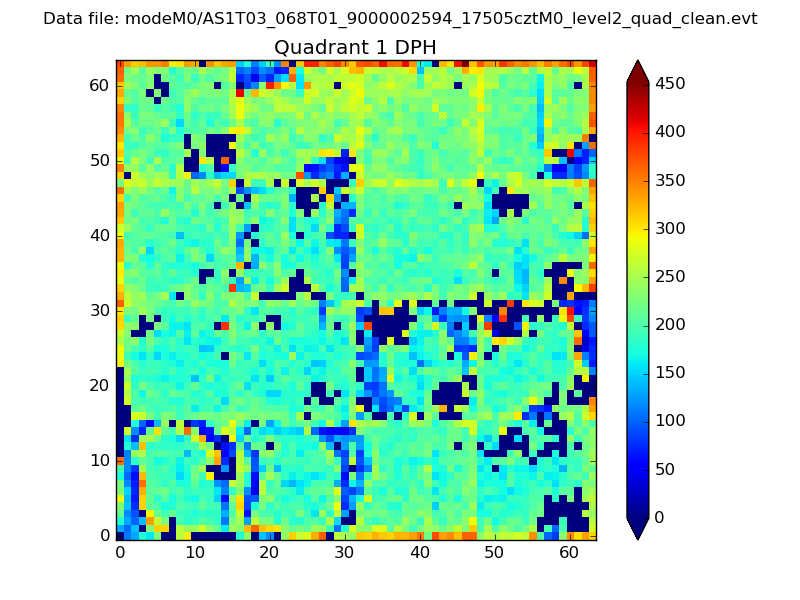 |
Quadrant B |
|---|---|---|---|
| Quadrant D | 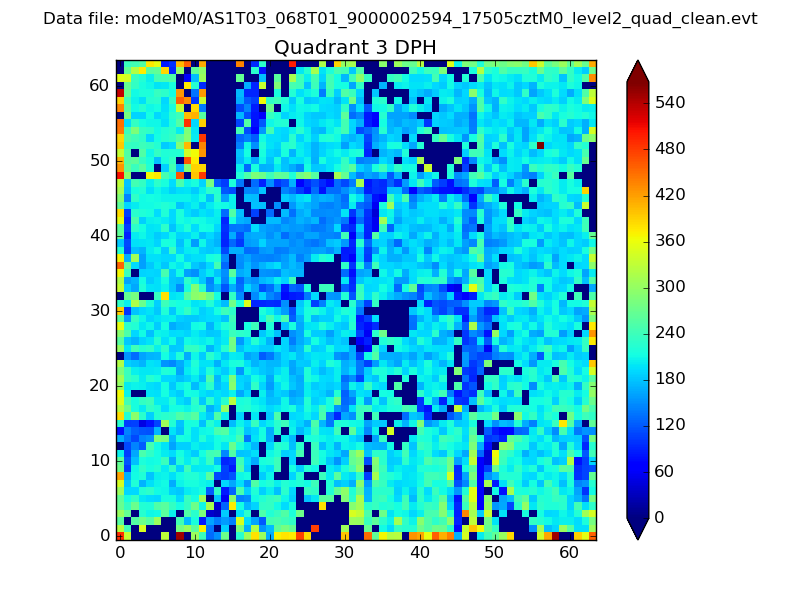 |
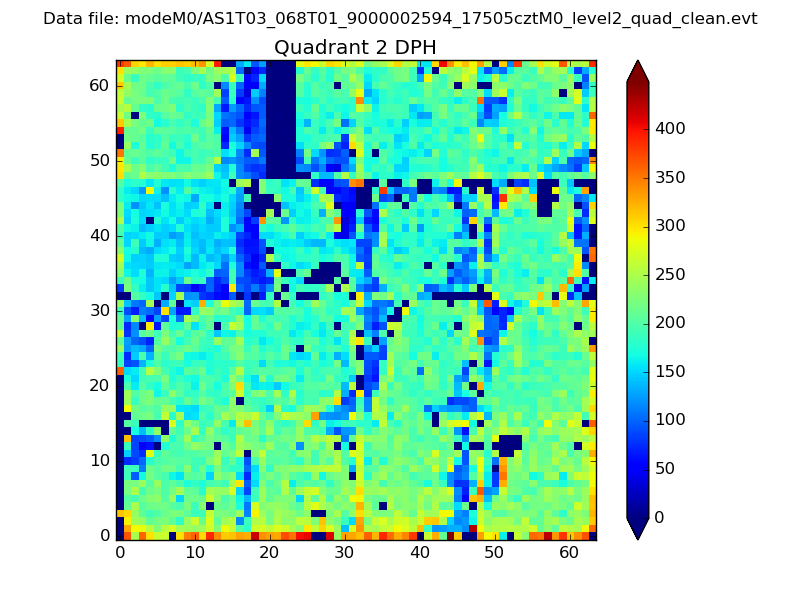 |
Quadrant C |
| Plot type | Count rate plots | Images |
|---|---|---|
| Comparison with Poisson distribution Blue bars denote a histogram of data divided into 1 sec bins. Red curve is a Poisson curve with rate = median count rate of data. |
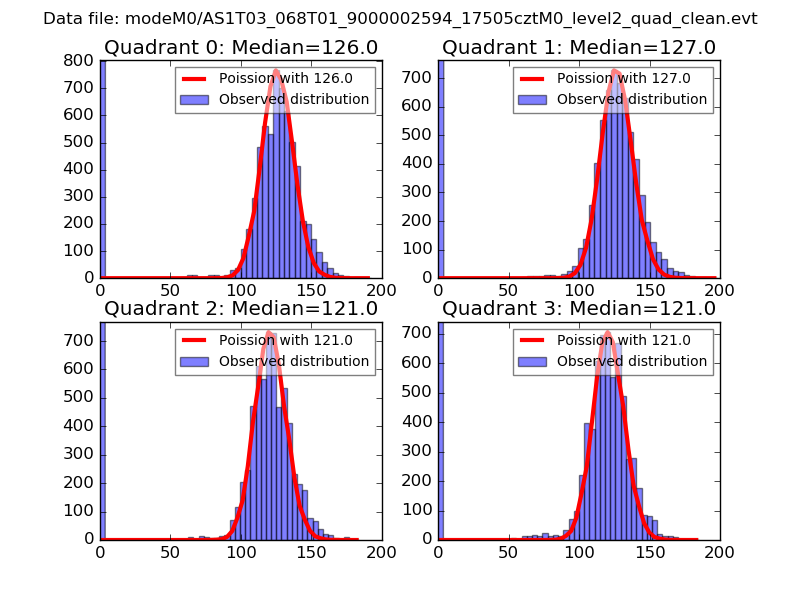 |
 |
| Quadrant-wise count rates Data is divided into 100 sec bins |
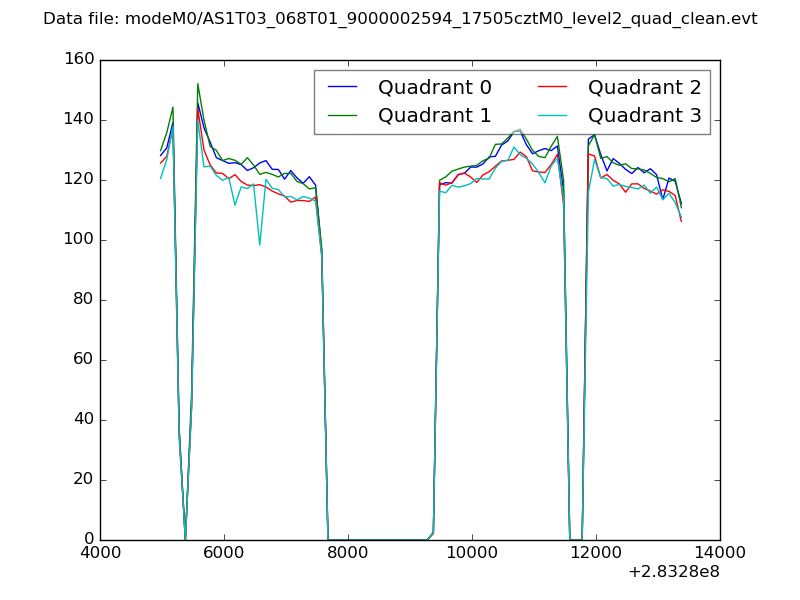 |
|
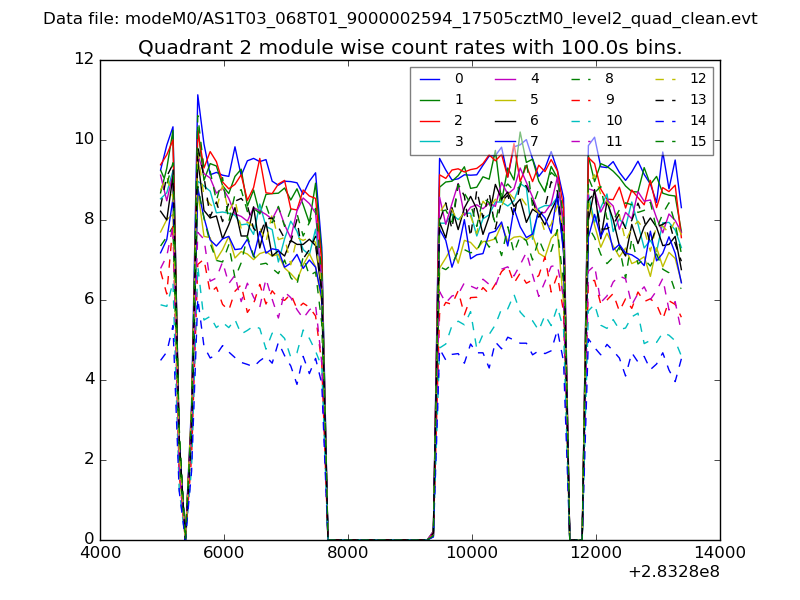
| Module-wise count rates for Quadrant A Data is divided into 100 sec bins |
 |
 |
| Module-wise count rates for Quadrant B Data is divided into 100 sec bins |
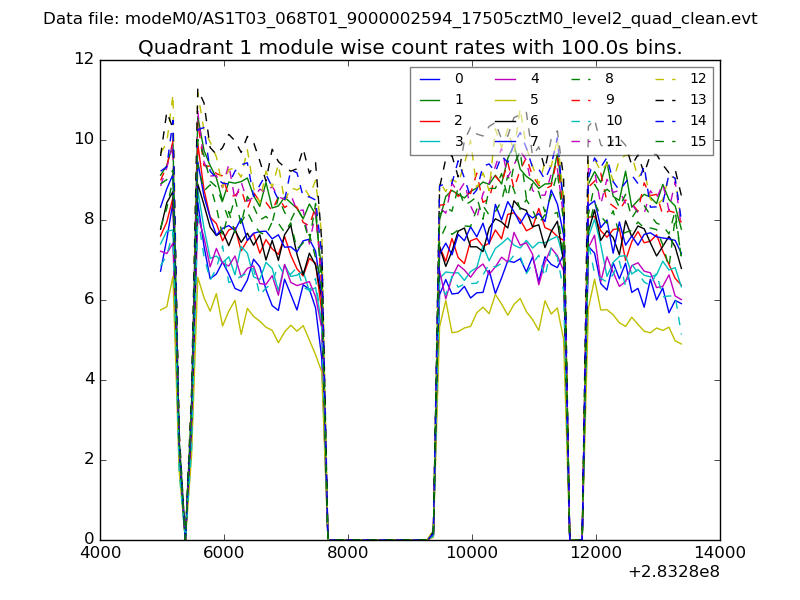 |
 |
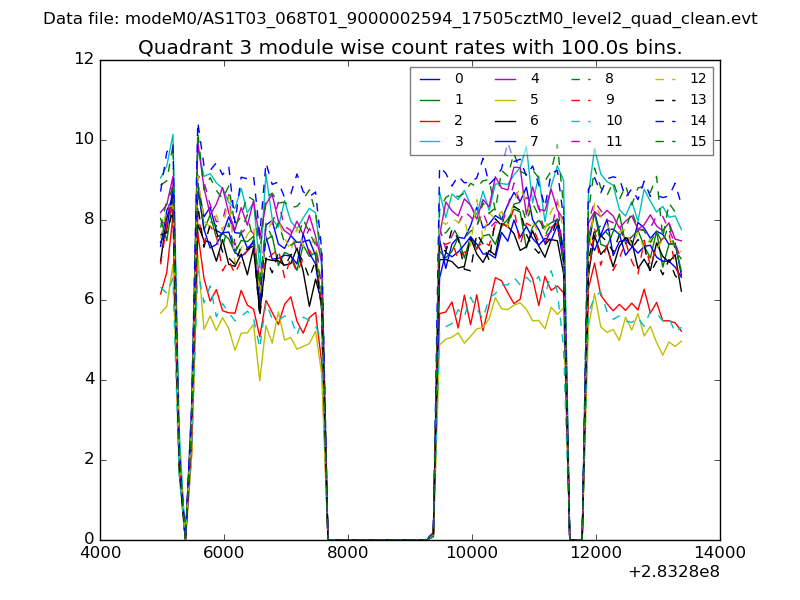
| Module-wise count rates for Quadrant C Data is divided into 100 sec bins |
 |
 |
| Module-wise count rates for Quadrant D Data is divided into 100 sec bins |
 |
 |
| Parameter | Plot |
|---|---|
| CZT HV Monitor | 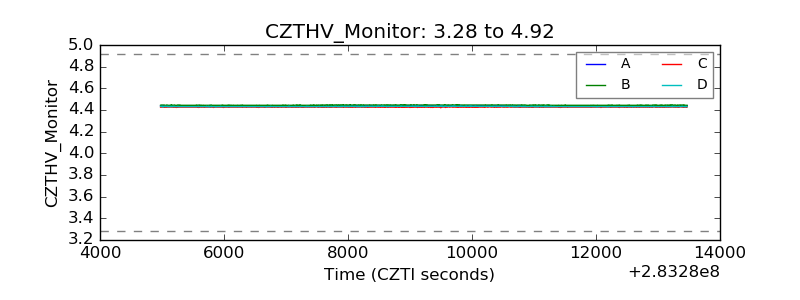 |
| D_VDD | 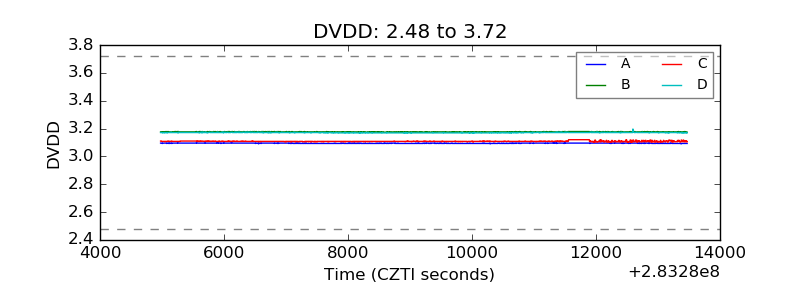 |
| Temperature 1 | 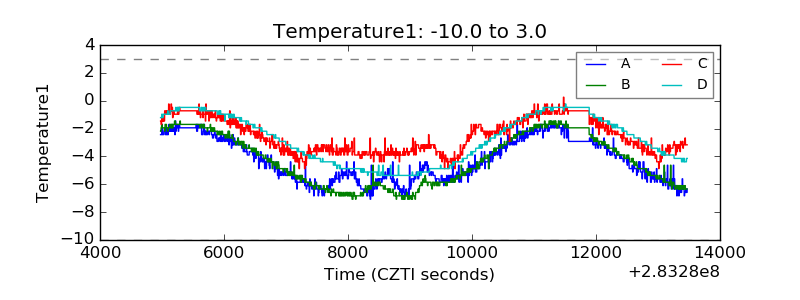 |
| Veto HV Monitor | 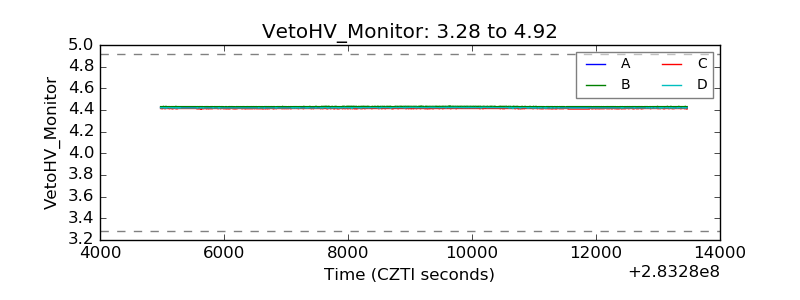 |
| Veto LLD | 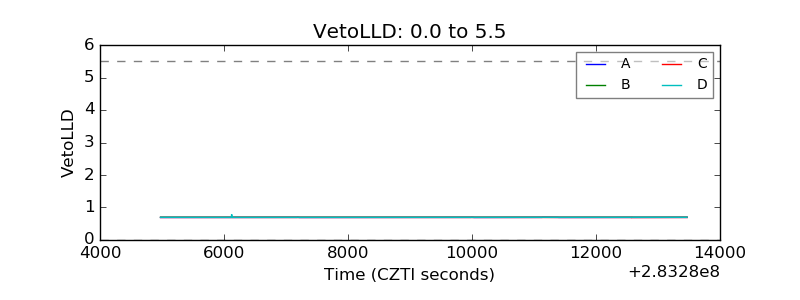 |
| Alpha Counter | 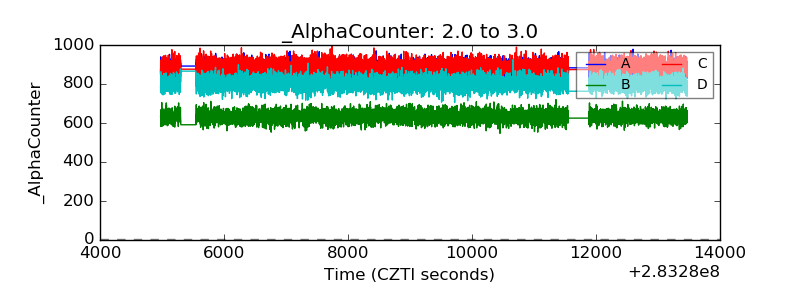 |
| _CPM_Rate | 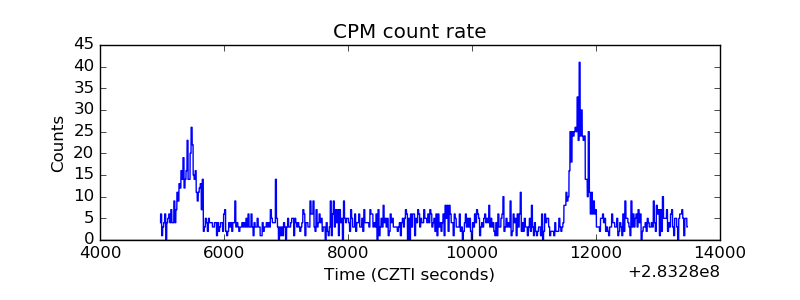 |
| CZT Counter | 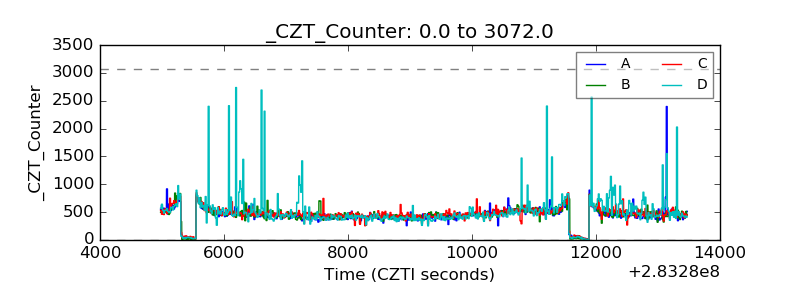 |
| +2.5 Volts monitor |  |
| +5 Volts monitor |  |
| _ROLL_ROT | 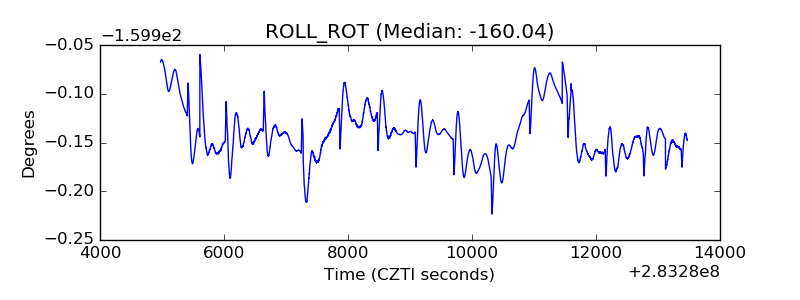 |
| _Roll_DEC | 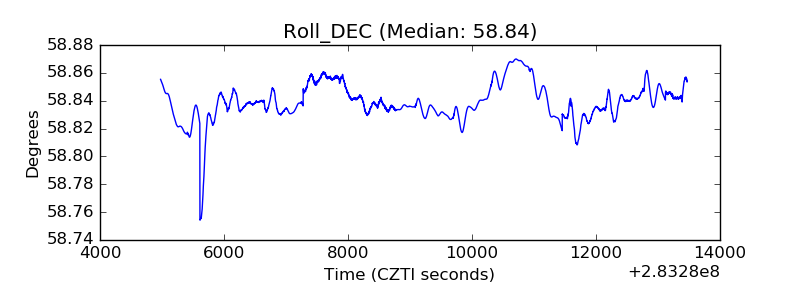 |
| _Roll_RA | 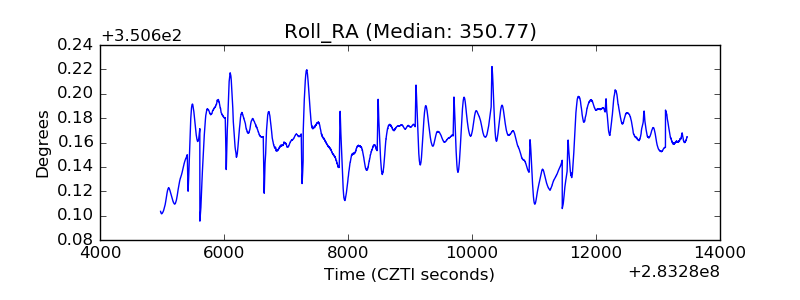 |
| Veto Counter | 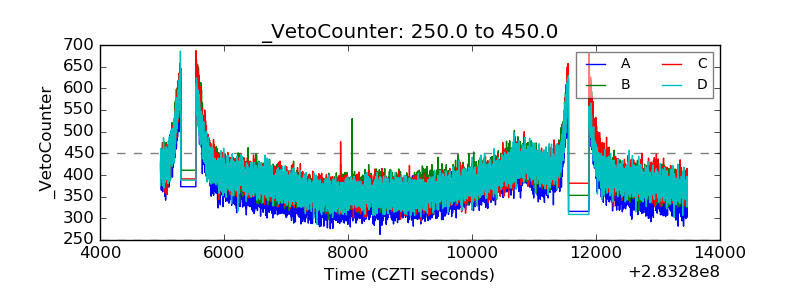 |